IISPPR

Peace, Justice, and Strong Institutions
Biswarupa Mishra

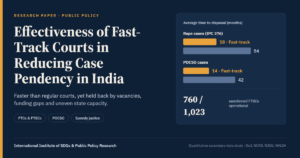
EFFECTIVENESS OF FAST-TRACK COURTS IN REDUCING CASE PENDENCY IN INDIA

This study evaluates the effectiveness of India’s Fast Track Courts (FTCs) and Fast Track Special Courts (FTSCs) in reducing case pendency and delivering substantive justice. Analyzing secondary data from the Department of Justice, NCRB, and NJDG, it reveals faster disposals alongside uneven progress driven by institutional capacities and vacancies. Sustainable impact requires dedicated infrastructure, stable funding, and fairness.

Read More »
Public Policies
Shivani Malik

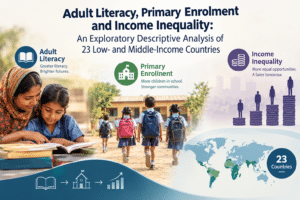
Adult Literacy, Primary Enrolment and Income Inequality: An Exploratory Descriptive Analysis of 23 Low- and Middle-Income Countries

This exploratory study examines whether adult literacy and primary gross enrolment move with income inequality (the Gini coefficient) across 23 low- and middle-income countries, using public UNESCO and World Bank data. Associations are weak, positive and imprecise, and none shows higher education accompanying lower inequality. Results are descriptive, sensitive to timing and measurement, and do not show causal effects

Read More »
FINANCE
prathinav meshram

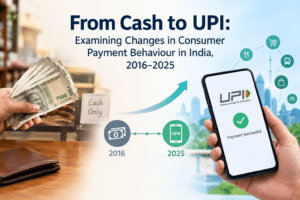
From Cash to UPI: Examining Changes in Consumer Payment Behaviour in India, 2016–2025

Authors:  Abdur Rehman, Prathinav Meshram, Riya Verma, Shreenedhi V, Sonia Agarwal, Aswathypadma Anil, Ananya Sharma, Ayush Chaudhary Abstract This study examines the changing consumer payment environment in India following the rapid expansion of the Unified Payments Interface (UPI) between 2016 and 2025. Rather than treating the growth of UPI transactions as direct evidence of higher consumption, the study distinguishes payment substitution from changes in spending behaviour. It asks whether the increasing availability of fast, interoperable and low-friction digital payments has altered the frequency, size and everyday character of consumer transactions. The study uses secondary data drawn from the National Payments Corporation of India (NPCI), the Reserve Bank of India (RBI), government publications and relevant academic literature. Particular attention is given to the growth of UPI transaction volume and value, the changing role of person-to-person (P2P) and person-to-merchant (P2M) payments, and the expansion of digital payment infrastructure. The analysis indicates that UPI has substantially changed the payment environment by making digital transactions more accessible and increasingly embedded in routine economic activity. The growth of P2M payments also suggests a wider movement of digital payments into everyday consumption. However, aggregate transaction growth cannot by itself establish that consumers spend more in total, because transaction counts may reflect the replacement of cash or other payment modes and changes in transaction frequency. The study therefore argues that UPI is best understood as an important factor in the reconfiguration of payment practices, while its precise effect on overall consumer expenditure requires further empirical investigation. Keywords: Unified Payments Interface (UPI); Consumer Spending Behaviour; Digital Payments; Payment Substitution; P2P Payments; P2M Payments; Digital Economy; India Introduction India’s payment system has undergone a major transformation during the last decade. For a long period, cash remained central to everyday economic activity, particularly for small-value purchases and informal transactions. The expansion of smartphones, internet connectivity, digital banking and payment infrastructure has gradually changed the payment environment. A major turning point came with the introduction of UPI in 2016. Developed by NPCI, UPI enabled interoperable, account-to-account payments through mobile applications and created a common infrastructure for transferring money and making merchant payments. Its subsequent expansion has made digital payment an increasingly routine part of economic activity in India. The growth of UPI has been particularly significant because it combines speed, interoperability and convenience within a single payment system. Users can initiate payments directly from bank accounts without relying on cash or entering lengthy banking details for every transaction. The increasing availability of QR-based merchant payments has also extended digital transactions beyond formal online commerce into shops, local businesses, transport, food services and other everyday settings. RBI reported that UPI accounted for 79.6% of the volume of retail payments in 2023–24, indicating its central position within India’s retail payment ecosystem. The RBI’s Digital Payments Index also increased from a base value of 100 in March 2018 to 465.33 in September 2024, reflecting the broader expansion of digital payment infrastructure and usage. The expansion of UPI raises an important question about consumer payment behaviour. A change in the method through which a purchase is paid for does not necessarily mean that the amount spent by a consumer has increased. If a person previously paid ₹100 in cash and now pays the same ₹100 through UPI, the payment mode has changed but the expenditure has not. This distinction between payment substitution and behavioural change is important when interpreting the rapid growth of UPI. Aggregate transaction statistics record the number and value of payments, but they do not directly reveal whether consumers are purchasing more goods and services, making smaller purchases more frequently, or simply replacing cash and other payment methods with UPI. Therefore, the present study uses transaction volume, transaction value and average transaction size as observable indicators of changes in the payment environment rather than as direct measures of total consumer expenditure. At the same time, the characteristics of digital payments may influence the way payments take place. Digital payments reduce the physical and transactional effort associated with making a payment. A consumer can complete a small purchase by scanning a QR code or using a mobile application within seconds. Such convenience may make frequent low-value transactions easier to conduct and may contribute to the normalisation of digital payments in everyday economic activity. However, whether this convenience results in changes in spending behaviour cannot be established from aggregate UPI growth alone. It therefore requires careful examination of transaction patterns alongside existing evidence on consumer behaviour. The distinction between P2P and P2M transactions is particularly relevant in this context. P2P payments mainly involve transfers between individuals, whereas P2M payments involve payments from individuals to merchants. Therefore, the expansion of P2M transactions can provide a more direct indication of the growing role of UPI in consumer and merchant transactions than overall UPI volume alone. However, P2P and P2M data are not available in a consistent form for the entire study period. For this reason, the study treats P2P and P2M patterns as supplementary evidence rather than as a complete measure of changes in consumer spending. The period from 2016 to 2025 is also important because UPI developed through several stages. Its early adoption was followed by broader expansion of digital payment infrastructure,increasing smartphone and internet use, and a rapid shift towards contactless transactions during the COVID-19 period. The growth of QR-code acceptance further strengthened the integration of UPI into physical markets. RBI data show that UPI QR codes increased by 35% during 2023–24 to 34.6 crore by March 2024. By June 2024, UPI was processing close to 45 crore transactions per day, while by September 2024 the number of active UPI QR codes had reached approximately 61 crores. These developments indicate that UPI is no longer limited to occasional digital transfers and has become increasingly embedded in routine payment activity across different economic settings. Existing research on digital payments often examines adoption, convenience, security, financial inclusion and consumer attitudes. A growing body of recent research has also considered whether digital payments influence spending frequency,

Read More »
Health
Kaustubh Lipare

District-Level Healthcare Infrastructure and Outcome Gaps in India: An Empirical Analysis of Secondary Care Specialist Shortfalls and Primary Infrastructure

Authors:  ¹Kaustubh R. Lipare, ²Najuka Jadhav, ³Kaavya Parashar, ⁴Enugandula Gangasairam, ⁵Indu Bharti, ⁶Daksh Pokar ABSTRACT Substantial public financial investments under the National Health Mission (NHM) have expanded physical health infrastructure across India. However, distinct district-level disparities in maternal and child health outcomes persist. This study evaluates whether variations in the Infant Mortality Rate (IMR) are driven primarily by deficits in physical infrastructure (‘bricks’) or critical structural shortages of clinical specialists (‘brains’) at referral centers. Utilizing a quantitative, cross-sectional, and ecological design, we analyzed a stratified systematic sample of 80 administrative districts from two Empowered Action Group (EAG) states (Uttar Pradesh and Chhattisgarh) and two Non-EAG states (Maharashtra and Tamil Nadu). Multivariate Ordinary Least Squares (OLS) regression models evaluated the predictive impact of primary clinic density, public hospital bed density, specialist doctor vacancy rates, and private sector delivery shares on district IMR, while controlling for female literacy and multidimensional poverty. Physical primary clinic density is relatively uniform across study regions and approaches standard Indian Public Health Standards (IPHS). Conversely, acute specialist physician vacancies at Community Health Centres (CHCs) average 79.1% in EAG districts compared to 36.5% in Non-EAG cohorts. Multivariate regression models reveal that the specialist doctor vacancy rate is the single most powerful statistical predictor of elevated district IMR (p < 0.001), carrying 5.2 times greater relative explanatory weight than primary clinic footprint (|β*| = 0.692 vs. |β*| = 0.133). Furthermore, a distinct moderation tipping point is observed: the marginal statistical return of constructing additional primary facilities flattens to zero once local specialist vacancies cross the 75% to 85% threshold. Diminishing returns exist for capital expenditure dedicated to building additional physical health structures if they remain unstaffed clinical shells. Policy instruments must prioritize human resource retention packages, functional secondary care, and verified institutional service readiness to accelerate progress toward regional Sustainable Development Goal (SDG) health targets. Keywords: Infant Mortality Rate; Healthcare Infrastructure; Specialist Vacancies; Indian Public Health Standards; Ecological Study; Public Policy 1. INTRODUCTION 1.1 Background and Problem: Spatial Heterogeneity in Health Outcomes While India has achieved significant macroeconomic progress, state-level maternal and child health averages conceal a sharper reality on the ground: the physical presence of a health facility on a government register does not mean that facility is functionally equipped to handle an obstetric or neonatal emergency. Historically, public health policy in India has prioritized the expansion of the built environment—focusing heavily on expanding the sheer volume of Sub-Centres, Primary Health Centres (PHCs), and hospital beds (Ministry of Health and Family Welfare [MoHFW], 2022). This persistent capital focus has treated district-level shortfalls primarily as a physical resource supply problem. What remains far less settled is whether the more consequential bottleneck lies in the institutional readiness and clinical capacity of these existing structures. Specifically, it remains unclear whether peripheral and secondary facilities are staffed by the medical specialists required to manage complicated deliveries, and whether a functioning referral pathway exists to transfer a patient safely from a primary outpost to a center equipped to provide emergency neonatal and obstetric care. This operational tension between physical asset expansion (‘bricks’) and clinical human resource availability (‘brains’) forms the core operational puzzle of contemporary Indian healthcare delivery (Patel & Ladusingh, 2015). Therefore, a critical empirical question arises: do localized bottlenecks in clinical specialist availability and secondary-tier referral capacity function as the primary drivers of district-level infant mortality, rather than an absolute deficit in primary outpatient structures? 1.2 Magnitude of District-Level Disparity The scale of this underlying disparity is considerable and spatially clustered across India’s administrative geography (Goli et al., 2022). Approximately 448 of India’s 640 districts report a maternal mortality ratio above the threshold set by the Sustainable Development Goals (SDG-3), with the most vulnerable zones concentrated across the central, eastern, and north-eastern regions (Goli et al., 2022). Infant mortality follows a similarly uneven spatial pattern, with high-mortality hotspots remaining deeply entrenched across central India and northern Uttar Pradesh even after adjusting for socioeconomic confounders and spatial autocorrelation (Puranik et al., 2018; Ranjan & Dwivedi, 2022). Within the 80-district sample analyzed in this study, the Infant Mortality Rate (IMR) ranges from 9.20 to 68.10 deaths per 1,000 live births—a seven-fold spread—while specialist doctor vacancy at Community Health Centres (CHCs) spans from 15.20% to 89.40%. Crucially, districts in Empowered Action Group (EAG) states report an average IMR that is two and a half times higher than that of non-EAG states (48.60 vs. 19.48 deaths per 1,000 live births), alongside a specialist vacancy rate that is more than double (79.06% vs. 36.51%). This comparative cohort framework is methodologically and substantively significant: it evaluates two functionally distinct health systems operating under the exact same national policy guidelines. Investigating this regional divide allows us to determine whether these systemic outcome gaps are primarily a function of physical infrastructure layout or if they are driven by severe, localized specialist shortfalls and secondary referral voids. 1.3 Rationale and Policy Relevance The stakes of resolving this structural puzzle are high because national capital expenditure tracks whichever explanation policymakers accept. Flagship national programmes, most notably the National Health Mission (NHM) and the Pradhan Mantri Ayushman Bharat Health Infrastructure Mission (PM-ABHIM), direct substantial public funding toward physical facility construction on the implicit premise that expanding the built environment is the primary lever for closing regional outcome gaps (MoHFW, 2022). If, however, the binding constraint in India’s worst-performing districts is not the number of physical buildings but rather the availability of specialized clinical staffing and secondary referral capacity, continued capital investment in construction will fail to move mortality figures in high-burden districts, leading to a severe misallocation of scarce public resources. This study directly tests the hypothesis that physical primary structures yield diminishing returns on infant survival when they are decoupled from functional secondary-care specialists, providing a necessary empirical baseline to guide national health infrastructure allocation. 1.4 The Research Gap The existing literature fails to resolve this tension due to fragmented study designs. Public health research tends to examine either socioeconomic determinants—such as rural-urban coverage gaps and maternal literacy (Panda et


Read More »
International Relations
Ayushi Baghel

“Developmental Deterrence as Strategic Tool : India’s Clean Energy Partnership in South Asia”

This paper explores how India’s clean energy cooperation with Nepal, Bhutan, and Bangladesh can serve as a source of regional strategic influence through the concept of “developmental deterrence.” Using Trade Expectations Theory, it examines whether cross-border electricity trade, hydropower agreements, and solar investments can strengthen economic interdependence and influence neighbouring countries’ relations with China and its Belt and Road Initiative. The study proposes the Green Connectivity and Regional Interdependence Model (GCRIM) and finds that, although India’s energy partnerships create significant economic ties and strategic opportunities, they have not substantially altered the political behaviour of its neighbours. Instead, Nepal, Bhutan, and Bangladesh continue to engage with both India and China through a strategy of hedging. The paper concludes that India’s clean energy cooperation holds considerable untapped strategic potential, whose effectiveness depends on the reliability, fairness, and mutual benefits of regional energy partnerships.

Read More »
Public Policies
Garima Sharma

The global learning crisis: why 273 million children are still out of school

This study presents a cross-country quantitative analysis of learning poverty, school completion, and gender disparities, examining their relationship with socioeconomic disadvantage. Findings reveal a significant positive association between poverty and learning poverty, situating educational exclusion within broader inequalities and crisis contexts.

Read More »
International Relations
Yasheeta Sulakhe Yasheeta

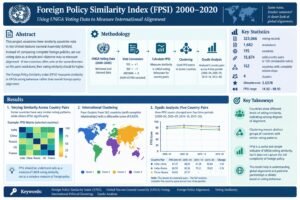
Foreign Policy Similarity Index 2000-2020

This project looks at how similarly countries voted in the United Nations General Assembly (UNGA). The main idea was to use voting data as a simple way of comparing countries instead of trying to compare their complete foreign policies. If two countries often vote in the same direction on the same resolutions, their voting similarity should be higher.
The project used United Nations General Assembly (UNGA) voting data from 2000 to 2020. After preparing the data, we represented YES as +1, NO as -1, and ABSTAIN as 0. We excluded NON-VOTING when comparing country pairs. We then calculated a score called the Foreign Policy Similarity Index (FPSI) for country pairs. This Foreign Policy Similarity Index (FPSI) measures similarity in United Nations General Assembly (UNGA) voting behavior rather than overall foreign-policy alignment.
The final data contained 323,066 voting records from 1,682 resolutions and 195 countries. After retaining country pairs with at least 100 comparable votes, 18,874 pairs remained. We also used the Foreign Policy Similarity Index (FPSI) matrix to cluster the data. We obtained four clusters from 162 countries with complete relationships, and the silhouette score was 0.6578. We ran a separate analysis of five country pairs to see how their scores changed over four time periods.
The results show clear differences between country pairs. Some countries have very similar voting patterns, while others differ much more. The Foreign Policy Similarity Index (FPSI) should be understood only as a measure of United Nations General Assembly (UNGA) voting similarity, not as a complete measure of foreign policy.

Read More »