Authors:
Souvik Biswas, Shikha Verma, Amrita Kumari
ABSTRACT
The Make in India initiative was launched in 2014 to transform India into a global manufacturing hub and make it an attractive destination by increasing domestic production, attracting foreign investment, and generating employment. This study examines changes in India’s taxation system after the initiative’s introduction, focusing on corporate taxation, Goods and Services Tax (GST), customs duties, tariffs, and their relationship with manufacturing-sector performance.
The study is significant because the factors under consideration are essential for assessing the current economy, as taxation plays an important role in shaping investment decisions, production costs, industrial competitiveness, and government revenue. Although tax reforms could create more attractive conditions for investors, a high tax burden for businesses and a complex tax system could hinder the country’s overall competitiveness.
Using secondary data for 2010–2025, the study combines policy review, descriptive trend analysis, Pearson correlation, and bivariate simple linear regression. None of the six tested relationships between manufacturing growth and the selected tax revenue, FDI, or export indicators was statistically significant at the 5% level.
The analysis indicates substantial improvement in selected business-environment indicators during the period for which comparable data are available. It was also found that India’s employment situation has improved post-pandemic. Further, GST collections increased substantially, particularly in the post-pandemic period, although this growth reflects multiple factors and cannot be attributed to Make in India alone. However, the merchandise trade deficit persisted and widened over the period examined, as merchandise imports increased by more than merchandise exports. Imports exceeded exports in India throughout the period under consideration in both absolute terms and as a percentage of the country’s Gross Domestic Product (GDP).
The observed changes in India’s tax-policy framework coincided with changes in foreign investment, although the available evidence does not permit the effect of taxation to be isolated from other determinants of FDI. It is also essential to consider other inhibiting and facilitating factors, such as infrastructure quality and access to knowledge, skills, technology, and investment.
Keywords
Make in India, Goods and Services Tax (GST), Foreign Direct Investment (FDI), taxation, business environment, imports, exports, employment, Gross Domestic Product (GDP).
INTRODUCTION
India’s manufacturing sector has long driven the country’s economic development, employment generation, investment attraction, and export competitiveness. Despite its large domestic market and substantial labor force, India has historically struggled to expand manufacturing capacity, attract investment into productive activities, improve industrial competitiveness, and reduce dependence on imported goods and inputs. Against this background, the Government of India launched the Make in India initiative on 25 September 2014 to strengthen manufacturing and position India as a globally competitive destination for investment and production. The initiative was intended to facilitate investment, foster innovation, develop manufacturing infrastructure, and improve the business environment.
The launch of Make in India coincided with significant changes in India’s economic and fiscal policy framework. Taxation became an important component of this broader policy environment because tax rates, tax administration, customs duties, and indirect taxation can influence production costs, investment decisions, market integration, and international competitiveness. Consequently, examining India’s tax-policy changes in the context of Make in India provides an opportunity to assess whether the evolution of the tax system has been broadly consistent with the objectives of promoting manufacturing, investment, and trade.
However, describing the post-2014 period simply as one of “rising taxes” would not adequately capture the direction and complexity of India’s tax reforms. The period witnessed both increases and reductions in different components of the tax system. One of the most significant developments was the introduction of the Goods and Services Tax (GST) on 1 July 2017, which replaced several central and state indirect taxes and sought to create a more integrated national market. The GST Council describes the reform as a major transformation of India’s indirect tax system and an effort toward a common national tax market. At the same time, the Government substantially reduced corporate income-tax rates in 2019. The new regime provided for a 22% corporate tax rate for eligible domestic companies and a 15% rate for eligible new manufacturing companies subject to specified conditions.
These developments demonstrate that India’s post-2014 tax environment cannot be characterized solely by increasing taxation. Rather, it involved tax restructuring, rate rationalization, tax-base expansion, changes in indirect taxation, customs-policy adjustments, and measures intended to improve investment and business conditions. The central issue is therefore not simply whether taxes increased, but how the changing tax-policy framework interacted with the objectives associated with Make in India.
This relationship matters for manufacturing because taxation can affect businesses through several channels. Corporate taxation influences after-tax returns and investment incentives, while indirect taxes can affect production costs, supply chains, and the movement of goods. Customs duties can influence the relative cost of domestic and imported products and intermediate inputs. At the same time, higher tax collections may reflect economic expansion, improved compliance, formalization, and changes in the tax base rather than increases in tax rates alone. Therefore, tax revenue growth should not automatically be interpreted as evidence of higher tax burdens or as evidence that Make in India has been successful.
The period following the introduction of Make in India also witnessed substantial changes in India’s investment and trade environment. Foreign direct investment (FDI), manufacturing activity, employment, exports, and imports all evolved during the period, but numerous factors beyond taxation and Make in India affected these outcomes. These include changes in global economic conditions, exchange rates, commodity prices, other domestic economic reforms, the COVID-19 pandemic, and subsequent disruptions to international supply chains. Consequently, movements in economic indicators after 2014 cannot, by themselves, establish that Make in India or tax reforms caused those changes. This distinction matters because the existing analysis observes simultaneous changes in Gross Domestic Product (GDP), employment, FDI, and tax revenue but does not, by itself, provide sufficient evidence for causal attribution.
Trade provides an especially relevant dimension for evaluating the manufacturing objectives of Make in India. The existing analysis indicates that India’s merchandise exports increased substantially between 2014 and 2024; however, merchandise imports increased by an even larger amount, widening the merchandise trade deficit. The draft reports exports increasing from approximately US$ 323 billion in 2014 to US$ 443 billion in 2024, while imports increased from approximately US$ 463 billion to US$ 718 billion over the same period. This pattern raises an important policy question: whether the expansion of India’s manufacturing and export capacity has been accompanied by a corresponding reduction in import dependence. A rising trade deficit does not necessarily indicate policy failure because imports of capital goods, machinery, and intermediate inputs may support domestic production. Nevertheless, the relationship between export expansion and import dependence deserves closer examination within the context of manufacturing competitiveness.
Similarly, FDI trends require careful interpretation. The existing study identifies an increase in net FDI inflows during part of the post-2014 period, followed by a decline after the pandemic, showing that foreign investment has not responded uniformly throughout the Make in India period. Therefore, rather than treating changes in FDI as direct evidence of Make in India’s success or failure, this study examines FDI as one of several economic outcomes associated with the changing policy environment.
Against this background, the present study examines the evolution of India’s tax-policy framework in the context of Make in India and investigates its relationship with selected indicators of manufacturing and economic performance. The study focuses particularly on corporate taxation, GST, customs and trade-related taxation, and considers their relationship with manufacturing performance, foreign investment, employment, exports, imports and tax revenue.
Importantly, this study treats Make in India as the broader industrial-policy context rather than the sole causal determinant of India’s tax reforms or economic outcomes. The analysis therefore does not assume that changes observed after 2014 were caused exclusively by Make in India. Instead, it compares developments over the study period and evaluates whether the direction of tax-policy changes has been broadly consistent with the manufacturing, investment and trade objectives associated with the initiative.
The study covers 2010–2025, allowing the post-2014 period to be compared with the preceding years. The pre-2014 period provides a reference point for understanding changes in India’s tax and economic indicators, while the post-2014 period captures the implementation of Make in India and subsequent major tax reforms, including GST and corporate-tax reform. The analysis also treats 2020–2021 as an exceptional period because the COVID-19 pandemic created a major external shock that affected production, investment, employment, and international trade.
The study contributes to the existing discussion by bringing taxation and industrial performance together rather than examining them in isolation. It seeks to determine whether changes in India’s tax framework have been associated with improvements in manufacturing-related outcomes and whether those developments have been consistent with the objectives of Make in India. At the same time, the study recognizes the limitations of observational macroeconomic data and avoids interpreting temporal association or correlation as proof of causality.
Accordingly, this research focuses not on whether India simply experienced “rising taxes” after the introduction of Make in India, but on whether the evolution of India’s tax-policy framework is consistent with the broader objectives of manufacturing development, investment attraction, employment generation, and trade competitiveness.
LITERATURE REVIEW AND RESEARCH GAP
Overview
According to the Economic Survey of 2013-14, the Indian manufacturing sector contributed 15% to India’s Gross Domestic Product (GDP) and was responsible for only 2% of the world’s manufacturing output in 2013-14. To revolutionize the manufacturing sector, the Indian government aimed to increase manufacturing’s share of GDP to 25% and create about 100 million jobs by 2022 (Gupta & Kapoor, 2016). To achieve this goal and to turn India into a global manufacturing hub, Indian Prime Minister Narendra Modi launched a national program called “Make in India” on 25 September 2014. The policy facilitated the introduction and implementation of new processes, new infrastructure, and new sectors encompassing 27 key areas, including the following manufacturing sectors: Aerospace and Defence, Automotive and Auto Components, Pharmaceuticals and Medical Devices, Biotechnology, Capital Goods, Textile and Apparels, Chemicals and Petrochemicals, Electronics System Design and Manufacturing (ESDM), Leather and Footwear, Food Processing, Gems and Jewellery, Shipping, Railways, Construction, and New and Renewable Energy (Kumar, Meena, & Kalia, 2024).
This study examines the evolution of India’s tax-policy framework in the context of Make in India, with particular attention to corporate taxation, GST, customs policy, manufacturing performance, investment and trade. Following the introduction of Make in India, India’s tax-policy framework underwent substantial changes, including GST implementation, corporate-tax reductions, customs-policy adjustments, and increased digitization of tax administration. These measures reflected several fiscal, administrative, investment, and market-integration objectives.
The purpose of this literature review is to identify and evaluate authentic evidence on the following:
- How changes in corporate tax impact manufacturing and foreign investments.
- How the introduction of Goods and Services Tax (GST) influenced industrial competitiveness.
- How imposing different import and export tariffs affected international trade.
- Whether the fiscal policy implemented for tax restructuring aligned with the industrial policy of the Make in India initiative.
Theme 1: Taxation and Manufacturing Growth
In September 2019, the Indian government significantly reduced corporate tax rates for domestic companies and new manufacturing units to boost domestic manufacturing, attract both domestic and foreign investment, and fuel job creation.
The reduction in corporate tax rates was accompanied by other economic reforms, including simplifying the tax system, aligning it with global compliance and international treaties, and offering incentives to boost the growth of startups and Micro, Small, and Medium Enterprises (MSMEs).
India has a history of a complicated indirect tax system with different types of taxes under different names, such as value-added tax (VAT), excise duty, customs duty, and service tax, which resulted in duplication, inefficiency, and cascading effects (Saini, Arora, & Bhardwaj, 2026).
According to analyses of tax trends, both direct and indirect taxes have increased substantially over the years. The share of direct taxes in total taxes has increased, while the share of indirect taxes in total taxes has declined; this shift reflects that the tax is borne directly by corporations and individuals rather than through consumption. Even if it appears to be straightforward, it is not as straightforward as it seems, as the tax-GDP ratio is a key indicator of fiscal health; it has shown fluctuations over time, which shows that it is important to mediate between GDP growth and tax collections (Behera, Sahoo, & Mohanty, 2019).
The reviewed literature proposes that reducing tax rates can positively affect the business environment, lower the cost of doing business, encourage existing businesses to reinvest profits, lower barriers to entry for new businesses, and boost corporations’ after-tax profitability (Sasanur, 2022).
The reviewed literature associates tax and regulatory reforms with lower compliance burdens, improved investment incentives, and greater business confidence. However, these studies do not isolate the effects of taxation from other domestic reforms and changes in global economic conditions.
Foreign Direct Investment (FDI) is central to the Make in India policy, as India’s investment ratio relative to its investment needs had a huge gap, so the policy was launched to increase foreign investment and promote Made in India products internationally. Make in India policy creates a pathway for investments that can result in the establishment of new companies or startups in the Indian market, create jobs for youth, and help in solving India’s two critical problems, i.e., unemployment and poverty (Srivastava, Devi, Mani, & Prasad, 2025).
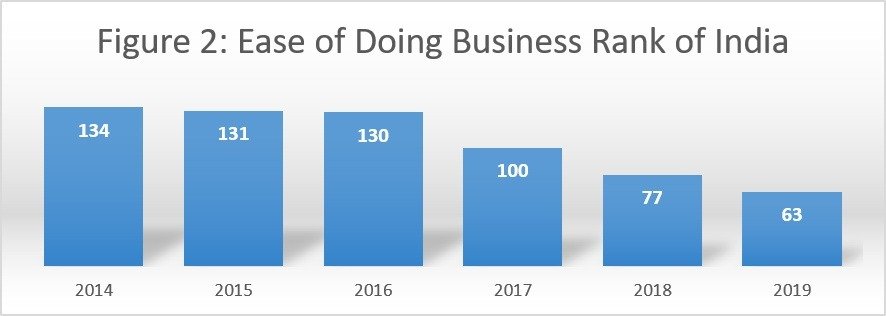
India claimed a top 100 ranking in the World Bank’s Ease of Doing Business (EoDB) Index. India climbed from 134th in 2014 to 63rd in the World Bank’s Doing Business Report (DBR) 2020, published in October 2019 (The World Bank Group, 2026).
The existing literature suggests that tax reforms have led to better manufacturing growth, but taxation alone cannot drive industrial development. Industrial development also requires improvements in infrastructure, labor reforms, innovation, and skill development. India can become a global manufacturing hub if it fully uses the vision of the Make in India policy. Researchers suggest that the introduction of GST has helped remove various indirect taxes in the manufacturing sector and made the manufacturing process cheaper for certain sectors, such as the automobile and cement industries.
Theme 2: Goods and Services Tax and Industrial Competitiveness
The Make in India initiative was subsequently followed and reinforced by the implementation of the Goods and Services Tax (GST) on July 1, 2017. This was a major step toward standardizing India’s tax policies and aligning with global practices and international tax treaties to attract foreign direct investment (FDI) and promote a stable, business-friendly environment.
Before the introduction of GST, India’s tax system was burdened with multiple layers of taxes on the sale and purchase of goods and services. The central government, state government, and local bodies imposed 17 types of taxes and 23 cesses on the same commodity from production to the end consumer. Traders also had to file separate returns for each tax. This led to inaccuracies and tax disputes. Errors at different stages of the taxation process resulted in tax fraud and evasion (Choudhari, 2023).
The introduction of GST marked a transformative milestone in India’s tax reforms. The reviewed literature suggests that GST unified all states and union territories into a single national market, simplified and standardized the tax structure, and eliminated the cascading effect of multiple taxes (Sureka & Bordoloi, 2025).
The reviewed literature argues that the availability of input-tax credits and the consolidation of indirect taxes may reduce cascading and production costs, although the magnitude of these effects differs across industries. The GST rate for over 200 products was reduced from 28% to 18%, enhancing overall transparency, efficiency, and productivity (Kumar, Meena, & Kalia, 2024).
Various tax reliefs and incentives were directed towards start-ups and MSMEs to ease the compliance challenges they were supposed to face during the transition. The incentives included tax holidays, tax concessions, and compliance simplifications. Thus, the Indian Government recognized the crucial role of entrepreneurs and MSMEs and provided necessary exemptions and deductions to support their growth and development (Kumar & Garg, 2024).
Parihar and Gujar agreed in their article that the GST helped the whole country become one big market. This happened because GST replaced multiple taxes with a single tax system. This reduced the tax cascade, meaning people no longer must pay tax on tax. It also increased transparency and made business easier (Parihar & Gujar, 2022).
Theme 3: Tariffs and Protectionism
India adapted to international norms while maintaining its unique cultural identity, following the principles of the Organization for Economic Cooperation and Development (OECD) and the terms of the World Trade Organization (WTO) Trade Facilitation Agreement.
Excise duty aligns with the nation’s priorities and balances industrial and social welfare. Customs duty regulates the movement of goods across India’s borders, resolves conflicts in international tax jurisdictions, generates revenue, and safeguards domestic industries.
Simplified import-export procedures and improvements in customs law and procedures, such as faceless assessments in a digitized environment, were key steps in enhancing India’s business environment.
The literature offers limited insight into tariffs and protectionism within the Make in India policy. Researchers suggest using trade policy and taxation simultaneously to promote domestic manufacturing and reduce reliance on imports. Thoughtful tariff formulation and duty-structure reversal can nurture infant industries and boost their international competitiveness.
Theme 4: Fiscal Policy versus Industrial Policy
On January 16, 2016, India launched the Startup India Initiative to support entrepreneurs, foster innovation, build a robust startup ecosystem, and generate employment. As of September 25, 2024, India became the world’s third-largest startup ecosystem, after the USA and China (Kumar, Meena, & Kalia, 2024).
The government offered a wide range of incentives to boost start-ups, including tax advantages, financial assistance, and simplified regulations. Eligible start-ups received tax breaks for a specific period and were granted angel tax exemptions to access early-stage funding more easily. These tax reliefs were intended to ease the administrative and financial strain on start-ups and promote an environment of innovation and entrepreneurship in India (Aswathanarayana, 2018).
Such reductions in tax rates may initially reduce government revenue, but they can offer greater economic benefits that may lead to larger revenue gains in the long run. Nonetheless, start-ups face regulatory compliance complexities, limited access to funding, and unpredictable market conditions.
The reviewed literature associates corporate-tax reforms with potential improvements in investment incentives, tax-base expansion, and fiscal outcomes, although the magnitude and causal effects remain difficult to isolate from other economic reforms.
A consistent GST revenue collection followed increased tax compliance, an expanded tax base, and a stable indirect tax framework through technological intermediation such as e-invoicing and automated return filing (Kumar, Sandhya, Rakshitha, & Dakshatha, 2025).
The reviewed articles conclude that taxation should be perceived as an element of industrial policy. GST simplifies taxation and increases compliance and transparency, benefiting India’s manufacturing sector. However, to meet rising demand for goods and services, India must invest in infrastructure, industrial parks, and skill development. These articles point out that although tax policies can generate economic growth and revenues, fiscal and tax policies should balance economic sustainability with incentives for industrial development. Thus, it is essential to combine taxation, investment, and industrial policies to meet the goals of the Make in India policy.
Literature Summary
GST has consolidated various central and state-level taxes into a unified national tax structure. GST has reduced the complexity of the indirect tax system. The growth in GST revenue coincided with improvements in tax administration, digitization, compliance, and formalization, although the relative contribution of each factor cannot be established from revenue growth alone. Digitization, automation, real-time data matching, and e-filing significantly reduced compliance time and improved tax administration efficiency.
Frequent regulatory changes and technological barriers pose significant challenges for corporations and individual taxpayers. Simplifying compliance standards, minimizing administrative barriers, and continuing taxpayer education can eliminate such challenges. Tax policies that are easy to comprehend encourage economic growth.
Through continuous administrative improvements and policy innovations, India aims to build and maintain a robust fiscal system that is efficient, transparent, and beneficial to economic progress, entrepreneurial development, investment growth, and employment generation.
Research Gap
Existing research has examined individual components of India’s post-2014 tax reforms, including corporate taxation, GST, and customs policy. However, these studies do not isolate the independent effect of taxation from other reforms. Separate studies have evaluated Make in India in relation to manufacturing, FDI, and trade. However, comparatively limited research integrates these tax-policy dimensions with manufacturing, investment, and trade outcomes over a common pre-2014 and post-2014 period. Furthermore, the simultaneous occurrence of GST implementation, corporate tax reform, COVID-19, and changes in global trade conditions complicates attribution of observed economic outcomes to Make in India alone. This study therefore examines the association between India’s evolving tax-policy framework and selected manufacturing, investment, employment, and trade indicators, while explicitly recognizing the limitations of causal inference.
RESEARCH QUESTIONS AND OBJECTIVES
Research Questions
- How did India’s tax-policy framework change following the introduction of Make in India in 2014?
- What relationship existed between major tax-policy changes and India’s manufacturing performance during 2010–2025?
- How did the post-2014 tax-policy environment correspond with trends in FDI, employment, and trade?
- To what extent are India’s changing tax and trade policies consistent with the manufacturing, investment, and trade objectives of Make in India?
- How did India’s merchandise export and import patterns evolve following the introduction of Make in India?
General Objective
To examine the relationship between India’s evolving tax-policy framework and selected economic outcomes associated with the objectives of the Make in India initiative during 2010-2025.
Specific Objectives
- To identify major changes in India’s corporate, GST, and customs taxation framework after 2014.
- To examine trends in manufacturing output and manufacturing’s contribution to GDP.
- To analyze the relationship between manufacturing growth and selected tax revenue, FDI, and export indicators.
- To examine changes in India’s export, import, and trade-deficit patterns.
- To evaluate whether observed trends are consistent with the objectives of Make in India while accounting for major confounding events and policy changes.
RESEARCH METHODOLOGY
Research Design
This study adopted a descriptive and analytical research design. The descriptive component examined changes in India’s taxation policies implemented under the Make in India initiative, while the analytical component evaluated the relationship between the tax policy changes and manufacturing performance, trade patterns, investment, and government revenue using secondary data.
Nature of Research
The study adopts a descriptive and exploratory analytical design combining policy review, quantitative trend analysis, Pearson correlation, and bivariate simple linear regression using secondary data.
Data Selection and Coverage
The study uses annual secondary macroeconomic and policy data for India. Indicators were selected purposively according to their relevance to the research questions, availability from official or established international sources, consistency of definition, and coverage during 2010–2025. Because the study uses national-level time-series indicators rather than observations drawn from a survey population, conventional probability-sampling terminology is not applicable.
Source
All data were collected from official government and international databases available in the public domain.
Data Collection Tool
Secondary data related to tax policy changes, changes in the business environment, FDI, import and export of goods and services, GST and customs collections, fiscal and macroeconomic indicators, and international comparisons were collected from various public sources such as the Goods and Services Tax Network (GSTN), the World Trade Organization (WTO), and the World Bank.
Variables Used
The variables used in the research paper are listed in the following table.
|
Category |
Variable |
Measurement |
|
Tax Policy |
GST |
GST Revenue (₹ in Lakh Crores) |
|
Tax Policy |
Tax Revenue |
% of GDP |
|
Outcome |
Manufacturing |
Manufacturing Value Added (Annual Growth %) |
|
Outcome |
FDI |
Net Inflow of FDI (Billion US$) |
|
Outcome |
FDI in Manufacturing |
FDI Inflows in Manufacturing Sector (Billion US$) |
|
Outcome |
Trade (Exports) |
Total Merchandise Exports (Billion US$) |
|
Outcome |
Trade (Manufactures Exports) |
Total Manufactures Exports (Billion US$) |
Data Analysis Techniques
All the quantitative data were collected and organized in tabular form in Microsoft Excel and analyzed using the following techniques.
- Tables
- Graphs or Charts
- Trend analysis
- Comparative analysis
- Percentage growth
- Descriptive statistics
- Correlation analysis
- Simple linear regression
Variable-Specific Data Availability
Although the study period is defined as 2010–2025, data availability varies across indicators. Therefore, each variable is analyzed over its longest consistent available period, and the applicable period is explicitly reported in the corresponding table. Comparisons across variables are not interpreted as if all indicators cover identical periods.
GST collections are financial-year data and are matched approximately with the corresponding calendar-year manufacturing-growth observation.
Ethical Considerations
The research used secondary data available in the public domain.
Therefore:
- No human participants were involved in any form of survey or questionnaire,
- All data were collected from publicly available, authentic domestic or international sources,
- All sources were properly cited using appropriate standardized citation methods,
- All findings were reported accurately and in an unbiased manner without any alteration.
Limitations
The following are the research limitations.
- The study was completely dependent on secondary data.
- It was difficult and sometimes not possible to completely isolate the effect of different tax policies from other economic factors.
- The time frame of multiple policy changes overlapped with the COVID-19 pandemic, and therefore the effects could not be identified and mapped appropriately.
- As multiple sources reported different types of data in different units and formats, making them comparable by converting and standardizing was extremely challenging and prone to approximation or round-off errors.
- Descriptive analysis alone was not sufficient to establish cause-and-effect relationships in most cases.
- The regression analyses are based on small annual samples ranging from 8 to 15 observations, which limits statistical power and makes the estimated coefficients sensitive to individual observations. Therefore, the regression results are interpreted as descriptive evidence of association rather than robust estimates of causal effects.
- The analyses use annual time-series data and do not formally test for stationarity, autocorrelation, lagged relationships, structural breaks, or common time trends. Several predictors are expressed as nominal levels, while the outcome is an annual growth rate. The estimates should therefore be interpreted as exploratory contemporaneous associations rather than time-series causal models.
DATA ANALYSIS AND INTERPRETATION
Overview
All data analyzed for this research were secondary and quantitative. They were collected from authentic international databases or Indian government data sources. All data were in the public domain and freely accessible. The data cover the period 2010 to 2025 and include indicators such as population, employment, business environment, Gross Domestic Product (GDP), inflation, Foreign Direct Investment (FDI), international trade, imports and exports, and various tax revenues, including Goods and Services Tax (GST). Where 2025 data were unavailable, the latest available year was used and is identified in the relevant table
The data were organized in Microsoft Excel in tabular form, and charts and graphs were created to depict trend analyses and support the research. The following section presents and explains the tables and charts with appropriate references.
Results
Bivariate simple linear regression and Pearson correlation analysis have been done on different variables to find out how they are linked with manufacturing growth. The p-values relate to the estimated slope in each bivariate regression; p < 0.05 has been used as the significance threshold. The results are listed in the following table.
Dependent Variable: Annual manufacturing value-added growth (%)
|
Table 1: Linear Regression Table |
|||||||
|
Year Range |
Independent Variables |
Pearson-R |
R2 |
Slope b |
P-Value |
n |
Interpretation |
|
2018-2025 |
GST Revenue |
0.5 |
0.25 |
0.6 |
0.21 |
8 |
Not Significant |
|
2011-2018 |
Tax Revenue/GDP |
-0.1 |
0.01 |
-0.47 |
0.81 |
8 |
Not Significant |
|
2011-2022 |
Manufacturing FDI |
0.09 |
0.01 |
0.15 |
0.78 |
12 |
Not Significant |
|
2011-2025 |
Net Inflow of FDI |
-0.41 |
0.17 |
-0.18 |
0.13 |
15 |
Not Significant |
|
2011-2024 |
Total Exports |
0.01 |
0.00 |
0.001 |
0.97 |
14 |
Not Significant |
|
2011-2024 |
Manufacturing Exports |
0.02 |
0.00 |
0.002 |
0.95 |
14 |
Not Significant |
Findings and Explanations
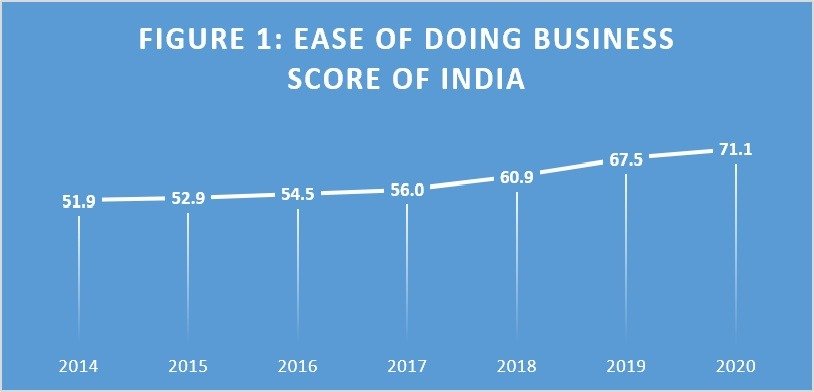
According to the historical Doing Business indicators of the World Bank, India’s business environment has improved significantly since 2014. The following table and charts show that India’s Ease of Doing Business score increased from 51.9 in 2014 to 71.1 in 2020, and India climbed from rank 134 in 2014 to 63 in 2019 on the World Bank’s Ease of Doing Business scale.
|
Table 2: Ease of Doing Business in India |
||
|
Year |
Ease of Doing Business Score |
Ease of Doing Business Rank |
|
2014 |
51.9 |
134 |
|
2015 |
52.9 |
131 |
|
2016 |
54.5 |
130 |
|
2017 |
56.0 |
100 |
|
2018 |
60.9 |
77 |
|
2019 |
67.5 |
63 |
|
2020 |
71.1 |
|
(The World Bank Group, 2026) (Trading Economics, 2026)
(The World Bank Group, 2026)
(Trading Economics, 2026)
The following table shows changes in India’s population and employment from 2011 to 2025.
|
Table 3: Population and Employment Growth in India |
||||
|
Year |
Population |
Annual Population Growth (%) |
Employment to Population Ratio |
Unemployment |
|
2011 |
1.26 |
1.42 |
50.01 |
7.61 |
|
2012 |
1.28 |
1.37 |
49.42 |
7.65 |
|
2013 |
1.30 |
1.33 |
49.27 |
7.68 |
|
2014 |
1.31 |
1.26 |
49.13 |
7.66 |
|
2015 |
1.33 |
1.19 |
48.99 |
7.63 |
|
2016 |
1.34 |
1.19 |
48.83 |
7.61 |
|
2017 |
1.36 |
1.16 |
48.66 |
7.63 |
|
2018 |
1.37 |
1.10 |
48.47 |
7.65 |
|
2019 |
1.39 |
1.04 |
48.88 |
6.51 |
|
2020 |
1.40 |
0.97 |
47.50 |
7.86 |
|
2021 |
1.41 |
0.82 |
49.17 |
6.38 |
|
2022 |
1.43 |
0.79 |
51.00 |
4.82 |
|
2023 |
1.44 |
0.88 |
52.42 |
4.17 |
|
2024 |
1.45 |
0.89 |
53.32 |
4.17 |
|
2025 |
1.46 |
0.89 |
53.31 |
4.22 |
(The World Bank Group, 2026)
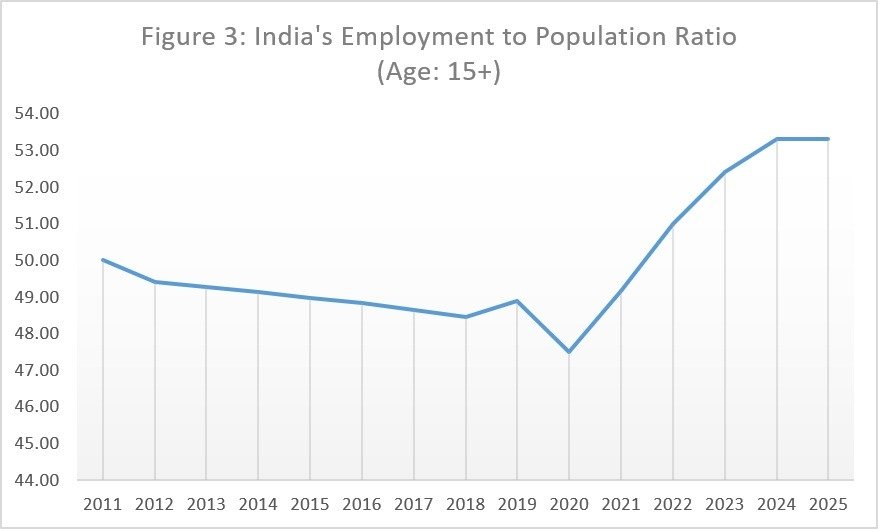
India’s employment-to-population ratio for the population aged 15 and above dipped until 2020. But in the post-COVID period, the ratio rose sharply, indicating more employment opportunities for a growing population.
(The World Bank Group, 2026)
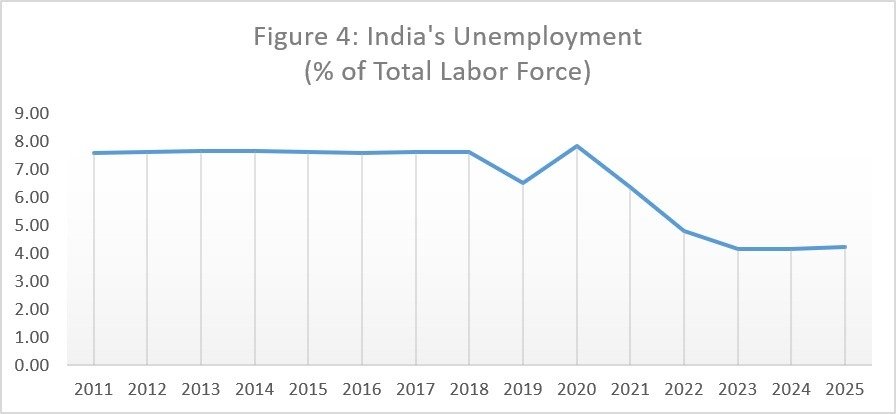
The unemployment rate was consistently between 7% and 8% of the total labor force from 2011 to 2020, except for a slight dip in 2019. During the COVID period in 2020, it spiked to nearly 8%, but it has since declined sharply. Since 2022, it has stayed between 4% and 5%. The employment-to-population ratio increased substantially after 2020, while the unemployment rate declined. These indicators suggest an improvement in aggregate employment conditions, although the data do not establish the extent to which manufacturing or Make in India contributed to this improvement.
(The World Bank Group, 2026)
The following table shows changes in GDP and inflation from 2011 to 2025.
|
Table 4: GDP and Inflation of India |
|||||
|
Year |
GDP |
Annual GDP Growth |
Annual Inflation |
GDP Per Capita |
Annual GDP Per Capita Growth |
|
2011 |
1.82 |
5.24 |
8.73 |
1,445.46 |
3.76 |
|
2012 |
1.83 |
5.46 |
7.93 |
1,429.32 |
4.02 |
|
2013 |
1.86 |
6.39 |
6.19 |
1,432.84 |
4.98 |
|
2014 |
2.04 |
7.41 |
3.33 |
1,553.88 |
6.06 |
|
2015 |
2.10 |
8.00 |
2.28 |
1,584.00 |
6.72 |
|
2016 |
2.29 |
8.26 |
3.24 |
1,707.51 |
6.97 |
|
2017 |
2.65 |
6.80 |
3.97 |
1,950.10 |
5.56 |
|
2018 |
2.70 |
6.45 |
3.88 |
1,966.25 |
5.29 |
|
2019 |
2.84 |
3.87 |
2.41 |
2,041.43 |
2.80 |
|
2020 |
2.67 |
-5.78 |
4.81 |
1,907.04 |
-6.69 |
|
2021 |
3.17 |
9.69 |
8.35 |
2,239.61 |
8.79 |
|
2022 |
3.25 |
7.61 |
2.85 |
2,279.98 |
6.76 |
|
2023 |
3.50 |
7.21 |
3.51 |
2,434.45 |
6.27 |
|
2024 |
3.76 |
7.10 |
2.47 |
2,591.99 |
6.15 |
|
2025 |
3.96 |
7.57 |
0.97 |
2,702.48 |
6.62 |
(The World Bank Group, 2026)
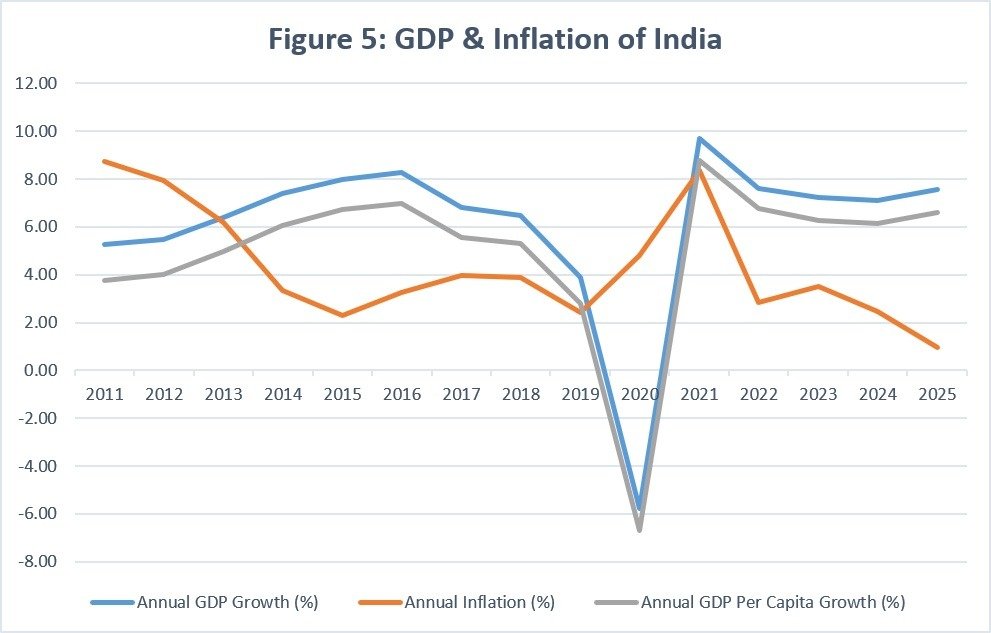
The following chart shows that India’s annual GDP and GDP per capita growth rates have been steady, with a major disruption around the COVID-19 pandemic. Inflation showed the opposite trend. It declined steadily but spiked during the pandemic and then fell steeply in the post-pandemic period.
(The World Bank Group, 2026)
The following table shows the details of net FDI inflow in India from 2011 to 2025.
|
Table 5: Net Inflow of FDI in India |
||
|
Year |
Net Inflow of FDI (Billion US$) |
Net Inflow of FDI (% of GDP) |
|
2011 |
36.50 |
2.00 |
|
2012 |
24.00 |
1.31 |
|
2013 |
28.15 |
1.52 |
|
2014 |
34.58 |
1.70 |
|
2015 |
44.01 |
2.09 |
|
2016 |
44.46 |
1.94 |
|
2017 |
39.97 |
1.51 |
|
2018 |
42.12 |
1.56 |
|
2019 |
50.61 |
1.78 |
|
2020 |
64.36 |
2.41 |
|
2021 |
44.73 |
1.41 |
|
2022 |
49.94 |
1.54 |
|
2023 |
28.09 |
0.80 |
|
2024 |
27.14 |
0.72 |
|
2025 |
39.10 |
0.99 |
(The World Bank Group, 2026)
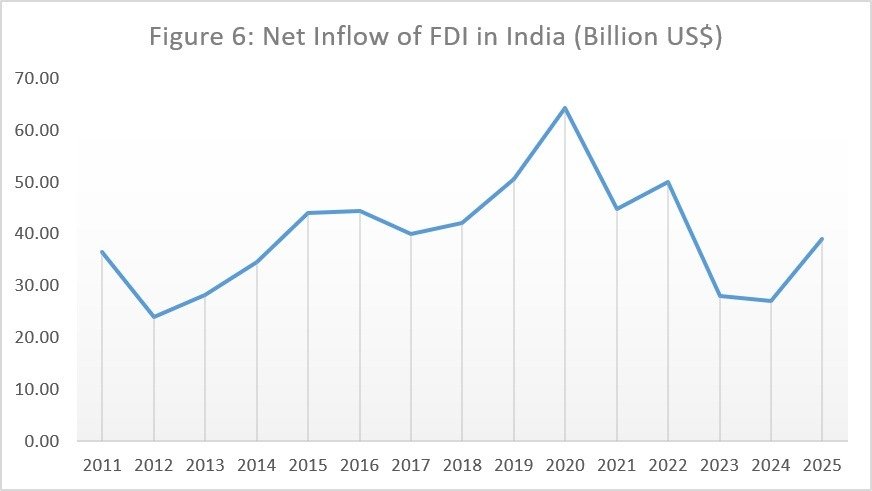
The following chart clearly shows that net FDI inflow has followed an overall upward trend since 2012, even before the introduction of the Make in India policy, with minor fluctuations during 2015-2017. Afterward, net FDI inflow continued to rise until 2020; in the post-pandemic period, it has declined from the 2020 peak, followed by a recovery in 2025, with intervening fluctuations.
(The World Bank Group, 2026)
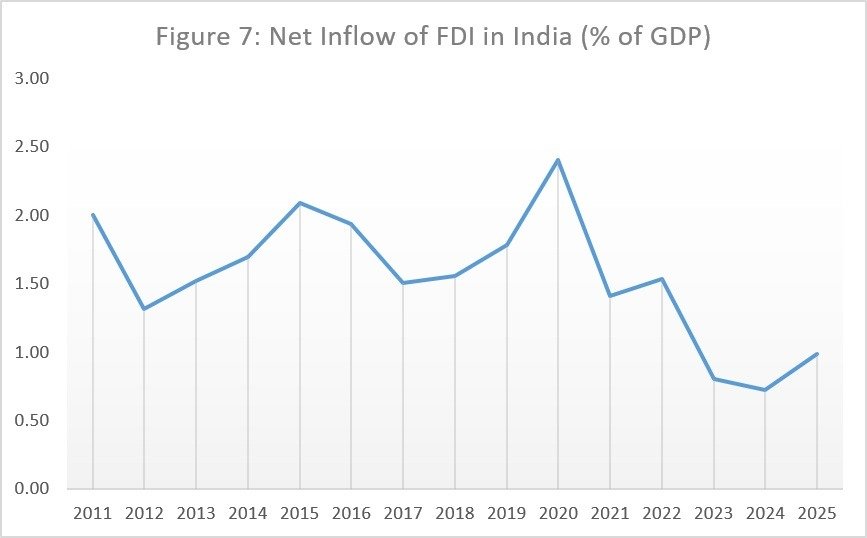
The following chart shows that net FDI inflow as a percentage of India’s GDP has been uneven since the introduction of the Make in India policy in 2014, and it declined sharply after the COVID-19 pandemic in 2020.
(The World Bank Group, 2026)
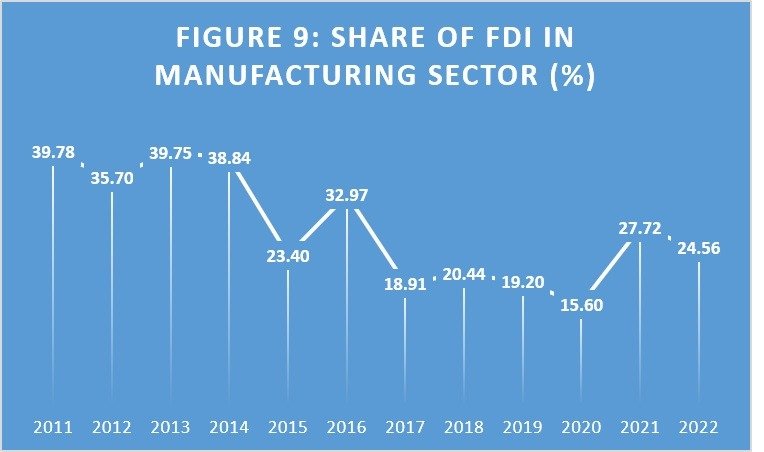
The following table shows FDI inflows in India’s manufacturing sector from 2011 to 2022. It also shows the percentage share of FDI in the manufacturing sector during that period.
|
Table 6: FDI in Manufacturing in India |
||
|
Year |
FDI Inflows in Manufacturing Sector (Billion US$) |
Share of FDI in Manufacturing Sector (%) |
|
2011 |
9.34 |
39.78 |
|
2012 |
6.53 |
35.70 |
|
2013 |
6.38 |
39.75 |
|
2014 |
9.61 |
38.84 |
|
2015 |
8.44 |
23.40 |
|
2016 |
11.97 |
32.97 |
|
2017 |
7.07 |
18.91 |
|
2018 |
7.92 |
20.44 |
|
2019 |
9.60 |
19.20 |
|
2020 |
9.30 |
15.60 |
|
2021 |
16.30 |
27.72 |
|
2022 |
11.30 |
24.56 |
(Srivastava, Devi, Mani, & Prasad, 2025)
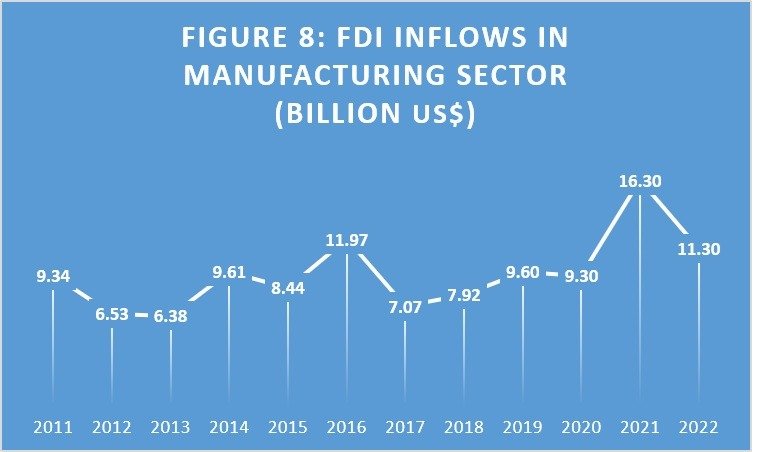
The following chart shows that FDI inflows into manufacturing in India during 2011-2022 have been quite inconsistent. There has been no consistent increase that can be directly attributed to the Make in India policy. Instead, FDI inflows in the manufacturing sector have fluctuated regularly after Make in India was introduced.
(Srivastava, Devi, Mani, & Prasad, 2025)
The following chart shows that the percentage share of FDI in India’s manufacturing sector has also been inconsistent. In fact, after the launch of Make in India, the FDI share has decreased significantly. Recently, it has increased and is hovering around 24%.
(Srivastava, Devi, Mani, & Prasad, 2025)
The following table shows value addition in India’s manufacturing sector from 2011 to 2025.
|
Table 7: Value Addition in Manufacturing in India |
||
|
Year |
Manufacturing Value Added (% of GDP) |
Manufacturing Value Added (Annual Growth %) |
|
2011 |
16.14 |
3.13 |
|
2012 |
15.82 |
5.45 |
|
2013 |
15.25 |
4.97 |
|
2014 |
15.07 |
7.90 |
|
2015 |
15.58 |
13.06 |
|
2016 |
15.16 |
7.93 |
|
2017 |
15.02 |
7.53 |
|
2018 |
14.88 |
5.41 |
|
2019 |
13.46 |
-2.97 |
|
2020 |
14.12 |
3.07 |
|
2021 |
14.38 |
9.96 |
|
2022 |
13.33 |
-1.74 |
|
2023 |
13.31 |
12.71 |
|
2024 |
13.14 |
9.29 |
|
2025 |
13.47 |
11.53 |
(The World Bank Group, 2026)
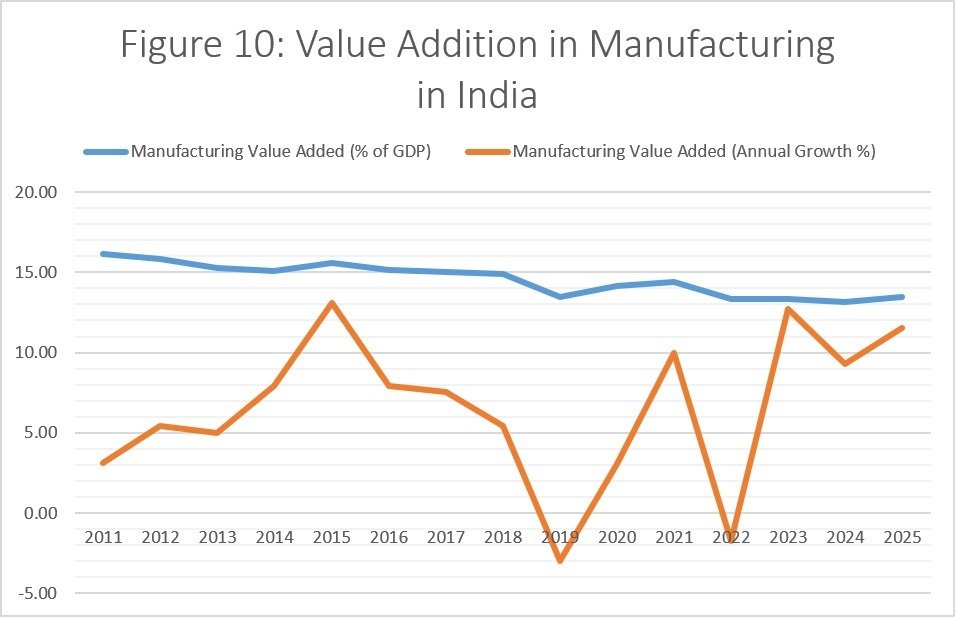
The following chart shows a downward trend in value addition in the manufacturing sector as a percentage of GDP. It also shows a very inconsistent pattern in the annual growth rate of value addition in the manufacturing sector.
(The World Bank Group, 2026)
The following table shows India’s tax revenue as a percentage of GDP from 2011 to 2018 and the share of that revenue from import and export duties.
|
Table 8: Tax Revenue of India |
|||
|
Year |
Tax Revenue |
Customs & Other Import Duties |
Taxes on Exports |
|
2011 |
10.18 |
16.79 |
0.007 |
|
2012 |
10.84 |
17.32 |
0.006 |
|
2013 |
11.00 |
15.15 |
0.004 |
|
2014 |
9.98 |
15.10 |
0.003 |
|
2015 |
10.57 |
14.44 |
0.008 |
|
2016 |
11.15 |
13.01 |
0.010 |
|
2017 |
11.39 |
6.94 |
0.005 |
|
2018 |
12.02 |
4.95 |
0.005 |
(The World Bank Group, 2026)
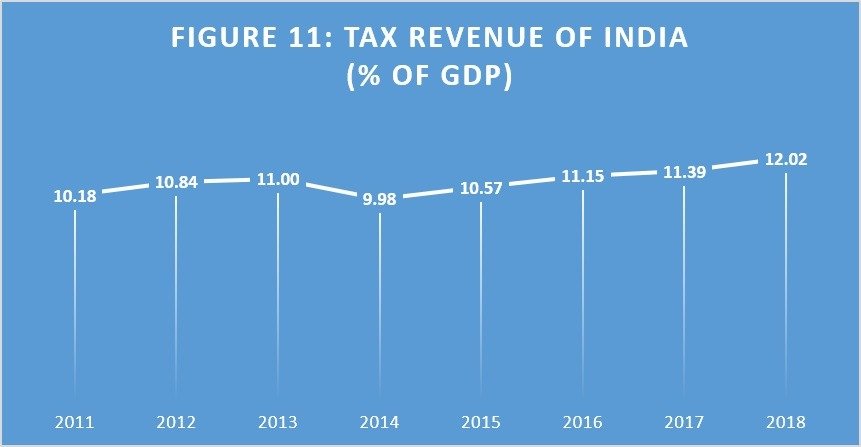
According to the chart below, tax revenue as a percentage of GDP has remained quite flat over time. India has earned annual tax revenue between 10% and 12% of GDP from 2011 to 2018.
(The World Bank Group, 2026)
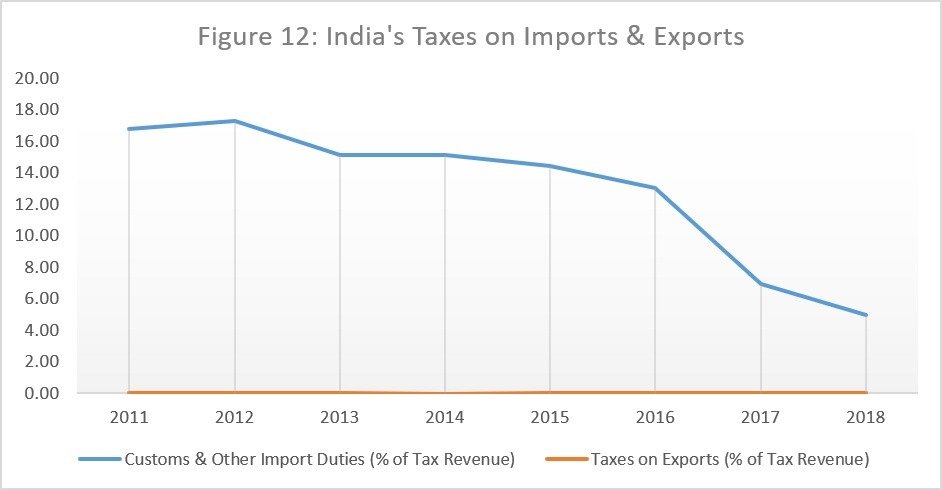
The following chart shows that the share of tax revenue contributed by customs and other import duties declined from 16.79% in 2011 to 4.95% in 2018, while export taxes contributed a very small share. These figures describe revenue composition and do not independently establish changes in statutory rates or policy intentions.
(The World Bank Group, 2026)
The following table shows India’s GST collection since the inception of the GST system in 2017.
|
Table 9: India’s GST Collection |
|
|
Financial Year |
Gross GST Collection (₹ in Lakh Crores) |
|
2017-2018 |
7.41 |
|
2018-2019 |
11.77 |
|
2019-2020 |
12.22 |
|
2020-2021 |
11.37 |
|
2021-2022 |
14.88 |
|
2022-2023 |
18.08 |
|
2023-2024 |
20.18 |
|
2024-2025 |
22.09 |
(Goods and Services Tax Network, 2026)
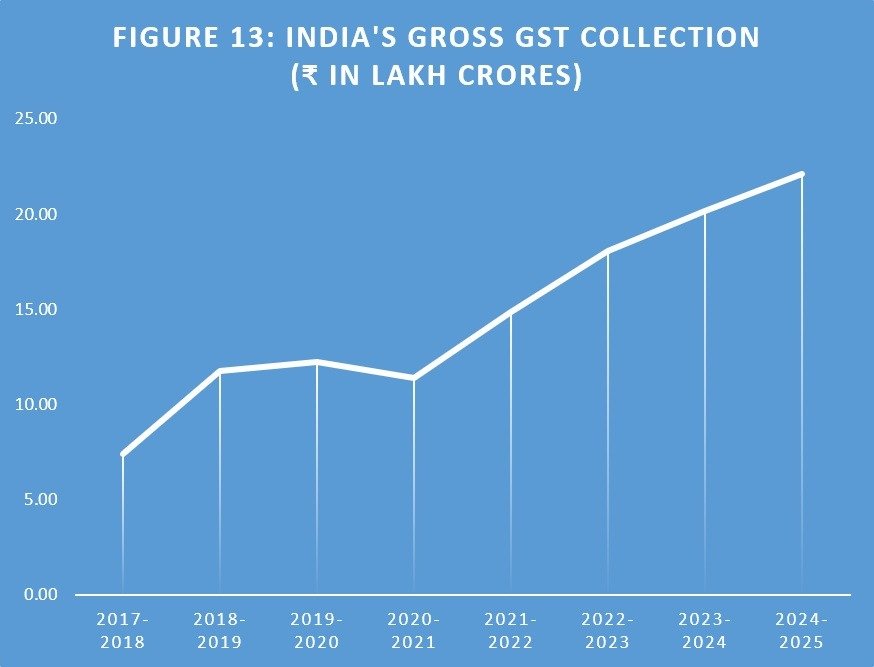
The following chart shows that since India launched the GST system in 2017, the country has earned a massive amount of tax revenue, and the GST collection has increased significantly each year during the post-pandemic period.
(Goods and Services Tax Network, 2026)
The following table shows India’s imports and exports of goods and services as a percentage of GDP.
|
Table 10: India’s Imports and Exports |
||
|
Year |
Exports of Goods & Services |
Imports of Goods & Services |
|
2011 |
24.54 |
31.08 |
|
2012 |
24.53 |
31.26 |
|
2013 |
25.43 |
28.41 |
|
2014 |
22.97 |
25.95 |
|
2015 |
19.81 |
22.11 |
|
2016 |
19.16 |
20.92 |
|
2017 |
18.79 |
21.95 |
|
2018 |
19.93 |
23.69 |
|
2019 |
18.66 |
21.24 |
|
2020 |
18.68 |
19.08 |
|
2021 |
21.40 |
24.02 |
|
2022 |
24.04 |
26.66 |
|
2023 |
22.35 |
23.97 |
|
2024 |
22.06 |
23.85 |
|
2025 |
22.26 |
24.01 |
(The World Bank Group, 2026)
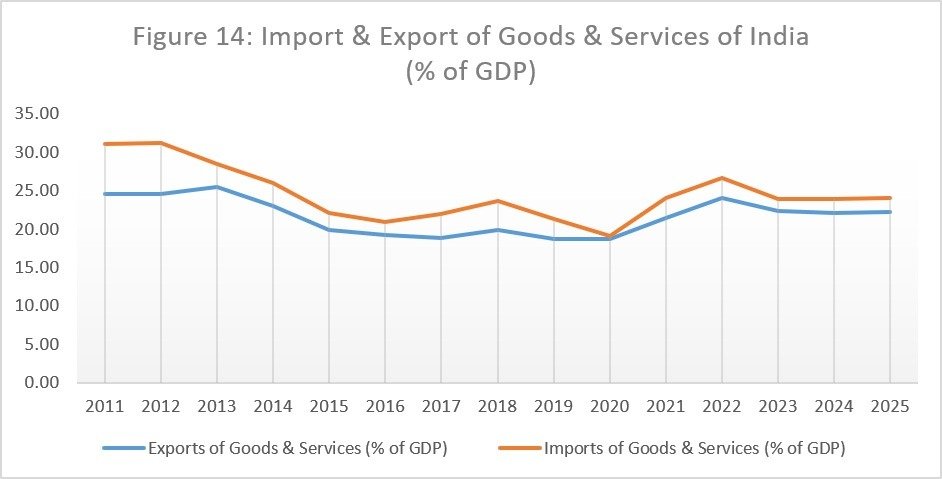
The chart shows that, from 2011 to 2025, India’s imports consistently exceeded its exports as a percentage of GDP.
(The World Bank Group, 2026)
The following table shows, from 2011 to 2024, what percentage of the exported merchandise belonged to the manufacturing sector.
|
Table 11: Exports from Manufacturing Sector in India |
|
|
Year |
Manufactures Exports (% of Merchandise Exports) |
|
2011 |
61.14 |
|
2012 |
62.22 |
|
2013 |
60.08 |
|
2014 |
62.61 |
|
2015 |
68.76 |
|
2016 |
71.51 |
|
2017 |
69.70 |
|
2018 |
69.27 |
|
2019 |
71.02 |
|
2020 |
71.01 |
|
2021 |
68.07 |
|
2022 |
62.33 |
|
2023 |
63.55 |
|
2024 |
67.10 |
(The World Bank Group, 2026)
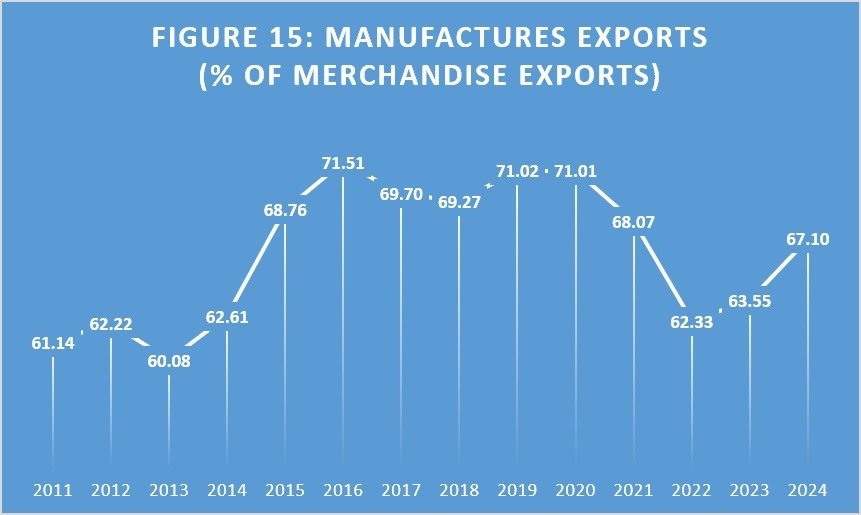
The chart shows that manufactured products accounted for approximately 60–71% of India’s merchandise exports during the period. Its share rose from 60% to 70% between 2013 and 2016 and remained stable for a few years, then fell slightly after 2020 before rising again to 67% in 2024, showing an overall upward trend.
(The World Bank Group, 2026)
Goods-and-services trade relative to GDP is used to assess overall external-sector integration, while merchandise trade values are examined separately because manufacturing competitiveness is more directly associated with trade in physical goods.
The following table shows India’s actual imports and exports, along with its trade balance, from 2010 to 2024.
[Note: The figures below were converted from million US$ to billion US$ and rounded off. Therefore, the independently rounded figures may not reconcile exactly.]
|
Table 12: Import and Export Trends of India |
|||
|
Year |
Total Merchandise Exports |
Total Merchandise Imports |
Balance of Trade |
|
2010 |
226 |
350 |
-124 |
|
2011 |
303 |
464 |
-162 |
|
2012 |
297 |
490 |
-193 |
|
2013 |
315 |
465 |
-151 |
|
2014 |
323 |
463 |
-140 |
|
2015 |
268 |
394 |
-126 |
|
2016 |
265 |
362 |
-97 |
|
2017 |
299 |
450 |
-151 |
|
2018 |
325 |
514 |
-190 |
|
2019 |
324 |
486 |
-162 |
|
2020 |
276 |
373 |
-97 |
|
2021 |
395 |
573 |
-178 |
|
2022 |
453 |
720 |
-267 |
|
2023 |
432 |
674 |
-242 |
|
2024 |
443 |
718 |
-275 |
(World Trade Organization, 2026)
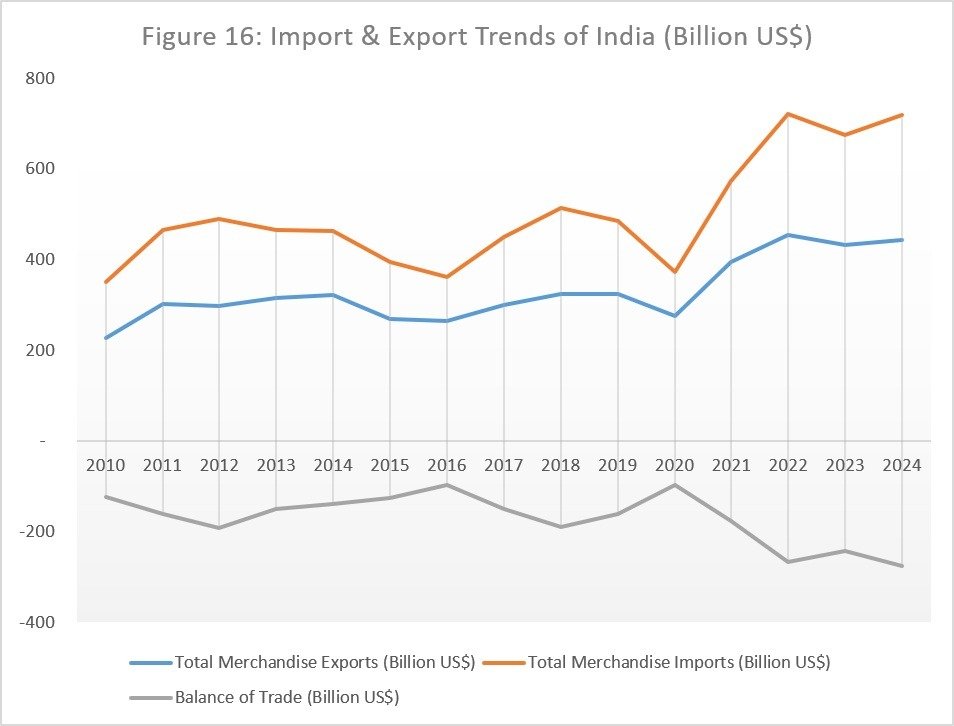
The chart clearly shows a persistent gap between India’s imports and exports. Imports have always been higher than exports, and this has not changed since the introduction of the Make in India policy in 2014. After the COVID-19 pandemic, the gap widened, and the trade balance became more negative, showing a downward trend.
(World Trade Organization, 2026)
The following table shows India’s imports and exports of manufactures, along with the trade balance in manufactures, from 2010 to 2024.
[Note: The figures below were converted from million US$ to billion US$ and rounded off. Therefore, the independently rounded figures may not reconcile exactly.]
|
Table 13: Trade in Manufactures in India |
|||
|
Year |
Total Exports of Manufactures (Billion US$) |
Total Imports of Manufactures (Billion US$) |
Trade Balance in Manufactures (Billion US$) |
|
2010 |
138 |
157 |
-19 |
|
2011 |
184 |
192 |
-7 |
|
2012 |
180 |
188 |
-8 |
|
2013 |
188 |
181 |
7 |
|
2014 |
199 |
186 |
13 |
|
2015 |
182 |
187 |
-6 |
|
2016 |
186 |
186 |
0 |
|
2017 |
205 |
223 |
-18 |
|
2018 |
223 |
246 |
-23 |
|
2019 |
229 |
240 |
-11 |
|
2020 |
195 |
194 |
1 |
|
2021 |
269 |
273 |
-5 |
|
2022 |
282 |
327 |
-45 |
|
2023 |
274 |
326 |
-52 |
|
2024 |
291 |
327 |
-36 |
(World Trade Organization, 2026)
The chart shows that India’s imports and exports of manufactures were almost equal until 2021. Since 2022, imports of manufactures have increased significantly more than exports, and the trade balance has become more negative.
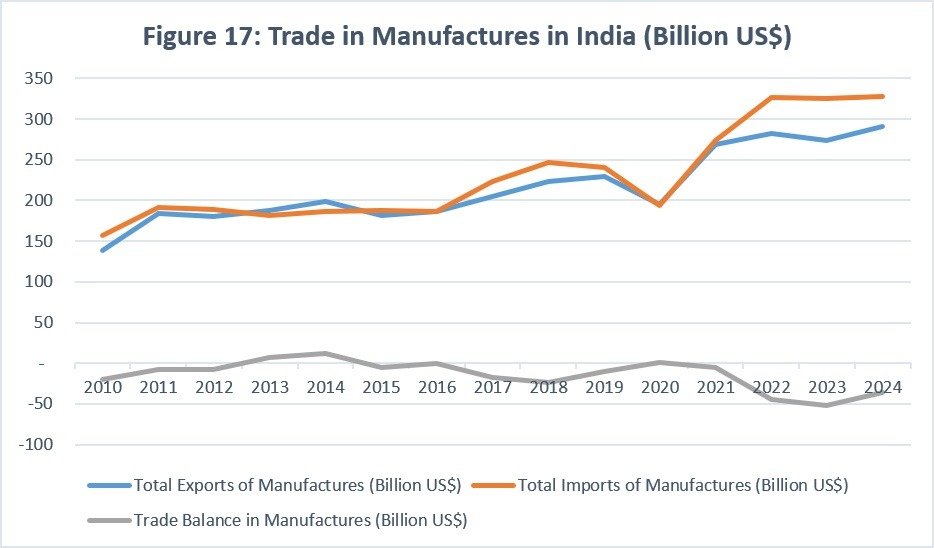
(World Trade Organization, 2026)
DISCUSSION
Ease of Doing Business
India recorded substantial improvements in the World Bank’s Doing Business indicators between 2014 and 2020. India’s climb from 134th rank in 2014 to 63rd rank in 2019 resulted from a significant increase in score from 51.9 to 67.5. However, because the indicator was discontinued thereafter and captures multiple dimensions of the business environment, it should not be interpreted as a direct measure of Make in India’s causal impact.
Employment
Employment indicators improved during the post-2014 period. The employment-to-population ratio rose from 48.47 in 2018 to 53.32 in 2024, while unemployment fell from 7.65% in 2018 to 4.17% in 2024. However, the observed improvement cannot be attributed exclusively to the Make in India initiative because several macroeconomic and policy factors operated simultaneously.
Foreign Direct Investment (FDI)
FDI showed substantial year-to-year variation during the post-2014 period. Net FDI inflow increased from US$ 34.58 billion in 2014 to US$ 64.36 billion in 2020 but then dropped sharply to US$ 27.14 billion in 2024 and again recovered to US$ 39.10 billion in 2025. FDI as a percentage of GDP fell from 1.70% in 2014 to 0.72% in 2024, then climbed to 0.99% in 2025.
Tax Policy Timeline
The following table lists key changes in India’s tax policy along with their timeline and targeted channels.
|
Year |
Tax-Policy Development |
Targeted Channel |
|
2014 |
Launch of Make in India |
Manufacturing/Investment |
|
2017 |
Implementation of GST |
Tax integration / Compliance |
|
2019 |
Corporate-tax reduction |
Investment/Manufacturing |
Taxation
Available World Bank data for 2014–2018 show an increase in tax revenue as a percentage of GDP from 9.98% to 12.02%. Because this series ends in 2018, it provides only partial evidence for the broader 2014–2025 period.
GST collections were ₹ 7.41 lakh crore in 2017-2018 and rose to ₹ 22.09 lakh crore in 2024-2025. However, the available descriptive evidence does not establish that Make in India caused these changes.
Manufacturing
Although manufacturing value added recorded positive growth in several years, its share of GDP declined from 15.07% in 2014 to 13.47% in 2025, indicating that manufacturing did not increase its relative contribution to GDP during the period. The annual growth rate of value addition in the manufacturing sector has been inconsistent. Manufacturing value added as a share of GDP declined over the period, while annual manufacturing growth remained volatile, including both strong positive-growth years and contraction years.
Trade
Trade statistics indicate that the expansion of merchandise exports after 2014 was accompanied by a larger increase in merchandise imports, widening the merchandise trade deficit. Exports increased from US$ 323 billion in 2014 to US$ 443 billion in 2024, whereas imports increased further – from US$ 463 billion in 2014 to US$ 718 billion in 2024 – and the trade deficit increased from a negative US$ 140 billion in 2014 to a negative US$ 275 billion in 2024.
Manufactured products accounted for more than 60% of India’s merchandise exports during most of the period examined; they increased after the introduction of the Make in India policy and continue to trend upward.
Synthesis
The study found increased GST collections, mixed manufacturing performance, variable FDI, widening trade deficits, and statistically insignificant bivariate estimates. The regressions test tax revenue indicators, not the isolated effects of GST implementation or corporate-tax reductions. Revenue collections can increase while manufacturing outcomes remain mixed. The insignificant estimates do not establish that taxation has no economic relationship with manufacturing. The study’s design cannot identify causal effects, irrespective of statistical significance.
Answers to Research Questions
- How did India’s tax-policy framework change following the introduction of Make in India in 2014?
Answer: India’s post-2014 tax-policy framework underwent substantial restructuring rather than a uniform increase in taxation. Major developments included the introduction of GST, reductions in corporate income-tax rates, changes in customs and tariff policy, and greater digitization of tax administration. These changes reflected a combination of revenue-mobilization, compliance, market-integration, and investment-related objectives.
- What relationship existed between major tax-policy changes and India’s manufacturing performance during 2010–2025?
Answer: The bivariate regression analyses did not identify statistically significant relationships between annual manufacturing growth and the selected tax revenue, FDI, or export indicators over their respective sample periods. The results therefore do not provide sufficient statistical evidence to establish a systematic relationship, and they do not support causal attribution.
GST: Moderate positive correlation, but statistically insignificant.
Net FDI: Moderate negative correlation, but statistically insignificant.
Other variables: Near-zero or very weak correlations.
- How did the post-2014 tax-policy environment correspond with trends in FDI, employment, and trade?
Answer: The post-2014 period was characterized by substantial variation in FDI, improvement in aggregate employment indicators after the pandemic, and continued export growth accompanied by larger merchandise imports. These patterns cannot be attributed exclusively to changes in taxation.
- To what extent are India’s changing tax and trade policies consistent with the manufacturing, investment, and trade objectives of Make in India?
Answer: The evidence indicates mixed consistency with Make in India’s objectives. Tax reforms, improvements in selected business-environment indicators, higher GST collections, and periods of increased FDI were broadly consistent with investment and formalization objectives. However, manufacturing’s share of GDP declined over the study period, FDI remained variable, and the merchandise trade deficit widened. The available evidence therefore does not support a uniform assessment of the tax and trade-policy framework as either achieving or failing to achieve Make in India’s broader objectives.
- How did India’s merchandise export and import patterns evolve following the introduction of Make in India?
Answer: Merchandise exports increased from approximately US$ 323 billion in 2014 to US$ 443 billion in 2024, while imports increased from approximately US$ 463 billion to US$ 718 billion. Consequently, the merchandise trade deficit widened from approximately US$ 140 billion to US$ 275 billion. For manufactures specifically, the trade balance shifted from a surplus of approximately US$ 13 billion in 2014 to a deficit of approximately US$ 36 billion in 2024. These aggregate trade data do not identify the extent to which imports consisted of intermediate inputs, capital goods, or final manufactured products.
CONCLUSION
India’s post-2014 tax framework underwent significant structural changes, including GST implementation, corporate tax reductions, and changes in customs policy. These reforms coincided with improvements in tax collection, economic activity, and periods of increased FDI, but the evidence does not support attributing these outcomes solely to Make in India. The persistence and widening of the merchandise trade deficit, together with uneven FDI performance and a declining manufacturing share of GDP, indicate that improvements observed in selected fiscal and business-environment indicators have not been accompanied by a uniform reduction in import dependence or an increase in manufacturing’s relative contribution to GDP. The bivariate regression analysis also did not identify statistically significant relationships between the selected tax, FDI, and export variables and annual manufacturing growth over the respective sample periods.
RECOMMENDATIONS
Based on the findings, it is recommended that India focus on the following five areas:
- Strengthen domestic value addition
Excessive dependence on imported intermediate inputs should be reduced where economically feasible.
- Target tariff policy carefully
Higher tariffs may not be inherently beneficial. Tariff structures should be examined carefully so that they support domestic value addition without substantially increasing input costs for Indian exporters.
- Improve manufacturing-specific investment conditions
Any policy related to manufacturing should address infrastructure, logistics, skills, technology, and regulatory predictability alongside taxation.
- Maintain tax-policy predictability
In tax policy, predictability and administrative simplicity should be emphasized alongside revenue mobilization.
- Link tax incentives to measurable outcomes
Where tax incentives are used to promote manufacturing, their effectiveness could be assessed against investment, employment, domestic value addition, exports, and productivity.
REFERENCES
Aswathanarayana, G. S. (2018, March). Corporate Tax Reforms in India: Impact on Business Environment and Economic Growth. Retrieved from International Journal of Research and Analytical Reviews (IJRAR): https://www.ijrar.org/papers/IJRAR19D5356.pdf
Behera, P. K., Sahoo, J., & Mohanty, B. (2019, January 22). An Analysis of Trend, Pattern and Impact of Taxation in India. Retrieved from ResearchGate GmbH: https://www.researchgate.net/publication/390627089_AN_ANALYSIS_OF_TREND_PATTERN_AND_IMPACT_OF_TAXATION_IN_INDIA
Choudhari, R. P. (2023). Changes In Indian Economy Due to Goods and Services Tax. Retrieved from International Journal for Multidisciplinary Research (IJFMR): https://www.ijfmr.com/special-issues/2/138.pdf
Goods and Services Tax Network. (2026). GST Statistics. Retrieved from Goods and Services Tax: https://tutorial.gst.gov.in/offlineutilities/gst_statistics/8YearsReport.pdf
Gupta, P., & Kapoor, R. (2016). Make in India and Direct Tax: A Critical Analysis of Direct Tax Reforms 2015. Retrieved from The RMLNLU Law Review Blog: https://rmlnlulawreview.com/wp-content/uploads/2020/05/2.-make-in-india-and-direct-tax-a-critical-analysis-of-direct-tax-reforms-2015.pdf
Kumar, K., Sandhya, Rakshitha, & Dakshatha. (2025, April). Understanding The Effectiveness of India’s Tax Policy Framework. Retrieved from International Journal of Multidisciplinary Research in Science, Engineering and Technology: https://www.ijmrset.com/upload/153_Understanding%20The.pdf
Kumar, P., & Garg, P. (2024, June). Taxation Policies in India: A Critical Examination of Tax Rates, Structures, and Their Impact on Entrepreneurship, Investment, and Economic Growth. Retrieved from International Journal for Multidisciplinary Research (IJFMR): https://www.ijfmr.com/papers/2024/3/19195.pdf
Kumar, S., Meena, S., & Kalia, S. (2024, September 25). 10 Years of Make in India – Transforming India into a Global Manufacturing Powerhouse. Retrieved from Press Information Bureau, Government of India: https://static.pib.gov.in/WriteReadData/specificdocs/documents/2024/sep/doc2024925401801.pdf
Parihar, A. S., & Gujar, C. P. (2022, December). Goods and Service Tax (GST): Make in India by Making One India. Retrieved from International Journal of Innovative Research in Technology: https://gramodayachitrakoot.ac.in/wp-content/uploads/2024/05/14.21-22.pdf
Saini, K., Arora, S., & Bhardwaj, P. (2026, February). An Analytical Study of Taxation Practices in India with Special Reference to Goods and Services Tax (GST), Income Tax Return (ITR), and Tax Deducted at Source (TDS). Retrieved from International Journal of Scientific Research and Engineering Development (IJSRED): https://ijsred.com/volume9/issue1/IJSRED-V9I1P14.pdf
Sasanur, N. G. (2022, April). Impact of Tax Policy Changes on Economic Growth in India: A Conceptual Study. Retrieved from International Journal of Research and Analytical Reviews (IJRAR): https://ijrar.org/papers/IJRAR22B3899.pdf
Srivastava, A., Devi, V., Mani, S., & Prasad, S. (2025, September 27). Impact of Make in India Initiative on Foreign Direct Investment Inflows in Manufacturing Sector: An Empirical Study of Pre and Post Make in India Policy Intervention. Retrieved from MGM Publishing House: https://doi.org/10.62823/mgm/ijaer/01.03.101
Sureka, A., & Bordoloi, N. (2025). A Comparative Analysis of VAT, Service Tax, and GST: Implications, Challenges, and Transition in the Indian Tax System. Retrieved from Journal of Cases in Management Studies: https://journals.dbuniversity.ac.in/ojs/index.php/jcms/article/view/4367
The World Bank Group. (2026). Databank – World Development Indicators. Retrieved from World Bank Group: https://databank.worldbank.org/source/world-development-indicators/
The World Bank Group. (2026). World Bank Group Doing Business Data. Retrieved from World Bank Group Doing Business Archive: https://archive.doingbusiness.org/en/data
Trading Economics. (2026). Ease of Doing Business in India. Retrieved from Trading Economics: https://tradingeconomics.com/india/ease-of-doing-business
World Trade Organization. (2026). WTO Data. Retrieved from WTO Stats: https://stats.wto.org/