
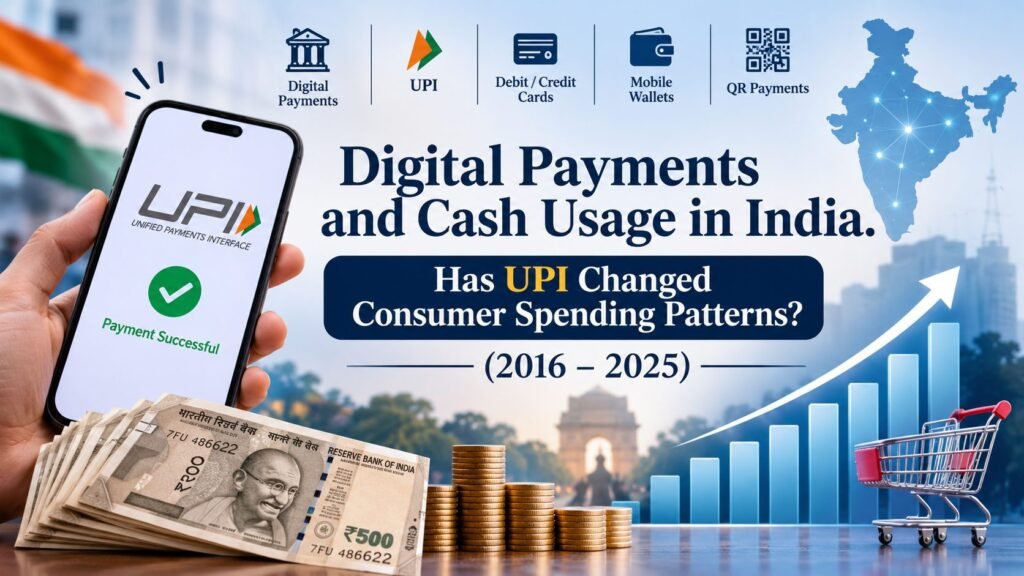
Authors: Shivani Brijwasi, Subham Sahu, Deeksha Bundela, Abhinav BJ
1. Abstract
The rapid expansion of digital payment systems has brought a significant change in the way consumers in India make and receive payments. This study examines the relationship between Unified Payments Interface (UPI) adoption, cash usage, and consumer spending patterns in India during the period 2016 to 2025. The study explains consumer behaviour, measures the adoption of digital payments, and determines whether the growth of UPI represents an actual change in spending or mainly a shift from cash to digital payment methods. The study uses secondary data obtained from the National Payments Corporation of India (NPCI), Reserve Bank of India (RBI), National Statistical Office (NSO), existing surveys, and published research. UPI usage is examined through transaction value and its share in digital payments, while cash usage is assessed through currency in circulation and other cash demand indicators. The convenience of UPI and the low transaction fiction are leading to more frequent micro transactions and unplanned purchases, especially among youth people. Consumer spending is examined primarily through payment frequency and average transaction size because aggregate UPI data cannot directly measure total household expenditure. Descriptive and trend analysis are used to compare changes across the study period. The findings indicate that UPI expanded substantially, with transaction volume increasing from 1.78 crore in FY 2016-17 to 18,587 crore in FY 2024-25, while average transaction size declined. UPI growth is associated with lower cash demand, but cash continues to remain important. Overall, the study concludes that UPI has changed Indians’ mode of payment, but the available aggregate evidence does not establish that it has caused an increase in total consumer spending.
Keywords:
Unified Payments Interface (UPI); Digital Payments; Cash Usage; Consumer Spending Behaviour; Impulse Buying; India.
2. INTRODUCTION
Digital technology has changed many aspects of everyday life in India, including the way people make and receive payments. For a long time, cash was the usual method of payment, particularly for small purchases and transactions in local shops and markets. The wider availability of smartphones, internet services and mobile banking has gradually increased the use of digital payment methods. One of the most important developments in this area was the introduction of the Unified Payments Interface (UPI) in 2016 by the National Payments Corporation of India (NPCI). The UPI pilot was launched on 11 April 2016 and enabled users to transfer money directly between bank accounts through mobile devices. Since then, UPI has expanded rapidly and has become an important part of India’s digital payment system. The use of UPI can now be seen in many ordinary transactions. Consumers use it for buying groceries, paying restaurant bills, shopping online, paying utility bills and making payments to local shops and small businesses. QR-code payments have made this process even simpler because a consumer can make a payment through a mobile phone without carrying physical cash or a card. UPI has therefore become more than a facility for online banking; for many people, it is now a regular method of making payments in their daily lives. NPCI describes UPI as an instant payment system that supports both person-to-person and merchant transactions.
The Reserve Bank of India (RBI) has also reported continuing growth in digital payment systems in India. However, the rapid growth of digital payments does not mean that cash has lost its importance. Cash continues to be used for many transactions across the country. Some consumers may choose cash because they are familiar with it, while others may continue to depend on it because of limited digital access, internet or connectivity problems, or the nature of the transaction. The continued demand for cash along with the growth of digital payments is an important feature of the Indian economy. The RBI has discussed this situation in terms of the “currency demand paradox”, where the use of digital payment methods increases even though the demand for physical currency also remains significant. Therefore, increasing UPI transactions cannot automatically be understood as evidence that consumers have completely shifted away from cash. The growth of UPI also raises an important question about consumer spending behaviour. A higher number of UPI transactions does not necessarily mean that consumers are spending more money. A person may simply use UPI for a purchase that would previously have been paid for in cash. At the same time, digital payments are quick and convenient, and this convenience may make small or frequent purchases easier to make. The reduced need to carry cash may also change how consumers experience and manage their expenditure.
Thus, the method used to make a payment may have some connection with spending behaviour. However, consumers do not necessarily use one payment method for all transactions. They may use UPI for some purchases and cash for others depending on their needs and circumstances. The period from 2016 to 2025 is particularly useful for studying these developments. It begins with the introduction of UPI and covers the period in which the system expanded from a relatively new payment facility to a widely used method of payment. NPCI’s official product statistics provide UPI transaction data from 2016-17 onwards and show a substantial increase in transaction volume and value during the following years. These figures demonstrate the growing use of UPI, but they do not by themselves explain whether consumer spending patterns have changed. An increase in digital transactions could represent a change in the method of payment rather than an increase in total expenditure. The relationship between payment methods and spending is therefore worth examining more closely. Cash is physically visible to the person spending it, whereas a UPI transaction can be completed within a few seconds through a mobile phone.
This difference may influence the convenience, frequency and manner of spending. However, the effect may differ from one consumer to another because factors such as income, age, digital awareness, access to technology and personal preference can influence payment choices. It is therefore important not to assume that the growth of UPI has had the same effect on every consumer. In this context, the present study examines the relationship between digital payments, cash usage and consumer spending patterns in India, with particular focus on UPI during the period from 2016 to 2025. It seeks to examine whether the rapid growth of UPI has influenced the way consumers make payments and manage their spending, and whether digital payments are gradually replacing cash or continuing alongside it. By considering both digital and cash payments, the study aims to provide a balanced understanding of changing payment practices in India and their possible relationship with consumer spending behaviour.
3. LITERATURE REVIEW
The growth of digital payments has changed everyday payment practices in India. The introduction of the Unified Payments Interface (UPI) in 2016 made bank-to-bank transfers easier through mobile devices. Since then, the spread of smartphones, internet access and digital payment infrastructure has contributed to the wider use of cashless payment methods. Existing studies have examined several parts of this transition, including the reasons consumers adopt digital payments, the development of UPI, changes in cash usage and possible changes in consumer spending. However, these areas have often been examined separately.
Theme 1:
Digital Payments in India. Research on digital payment adoption has identified convenience, ease of use, trust, security, access to technology and financial infrastructure as important factors associated with consumers’ willingness to use digital payment methods. These factors are relevant to the present study because changes in the availability and attractiveness of digital payment methods may affect the payment instrument consumers choose. A change in payment method, however, should not automatically be treated as evidence of a change in the amount consumers spend. Agarwal, Ghosh, Li and Ruan (2024) examine the relationship between digital payments and consumption using the 2016 demonetization as a natural experiment setting. Their study reports higher monthly spending alongside increased digital payment adoption. The authors discuss the possibility that digital transactions reduce the psychological importance of physical money, making payment feel less tangible. This finding is relevant to the question of spending behaviour, but it should be interpreted within the particular setting and research design of the study. It does not by itself establish that UPI caused higher spending among Indian consumers generally. Bhuyan (2024) approaches the issue from a different perspective through the Cash Usage Indicator for India. Rather than directly estimating the effect of UPI on household expenditure, the study examines changes in the balance between cash and digital payment methods over time. The evidence is useful for understanding the changing role of cash, but it should not be interpreted as direct evidence that UPI reduces household spending. The difference between the two studies illustrates why payment substitution and expenditure need to be treated as separate questions.
Theme 2:
UPI Adoption and Development. UPI has become an important part of India’s digital payment system since its introduction in 2016. Research on UPI adoption has mainly focused on the factors that encourage consumers to use the system. Kapoor, Singhal et al. (2022), drawing on diffusion of innovation theory, identify the perceived advantages of UPI and other characteristics of the innovation as relevant to adoption. Their work helps explain why consumers may prefer UPI to existing payment methods. Kiran and Sailaja examine UPI adoption using the UTAUT framework. Their study, based on 416 UPI users, reports significant roles for facilitating conditions, performance expectancy, effort expectancy, social influence, promotional benefits and perceived trust in users’ intention to adopt UPI. This suggests that UPI adoption is not determined by convenience alone. Trust, social influence and the conditions that support digital payments also matter. These studies are important for the present research because they explain the development and adoption of UPI. At the same time, adoption research does not necessarily show whether consumers spend more or less after using UPI. It therefore provides background for examining payment behaviour, while the proposed study addresses the additional question of whether changes in payment behaviour are associated with changes in spending and cash usage.
Theme 3:
Cash Usage versus Digital Payments. The rapid expansion of digital payments has not made cash irrelevant in India. Cash continues to have a role alongside digital payment methods, and consumers may choose between them depending on the circumstances of a transaction. For this reason, cash and digital payments should not automatically be treated as complete substitutes. Cash may be used for transactions while also being held for precautionary purposes or as a store of value. Panda and Priya (2024) examine cash and digital payment transactions and report that the share of cash as a payment medium has declined even though currency in circulation has continued to grow. Their analysis points to precautionary and store-of-value motives as part of the continuing demand for cash. They also report an inverse relationship between digital payments and cash holdings. This evidence is relevant to the present study, but cash holdings and cash expenditure represent different concepts and should not be treated as interchangeable. Tagat, Özmen and Markowsky (2024) provide another perspective by examining the survival and disposal of banknotes using RBI issuance data. Their findings indicate that lower denomination notes, which are more likely to be used for everyday transactions, have shorter circulation lives, while higher denomination notes remain in circulation for longer. The authors’ findings are consistent with differences between transactional and store-of-value uses of cash. The study is not specifically about UPI adoption, so it is best used as supporting evidence about the changing role of physical currency. Taken together, these studies suggest that digital payment growth can occur at the same time as continued demand for cash. A reduction in cash transactions does not necessarily mean that people hold less cash, and neither measure can by itself demonstrate a reduction in total consumer spending. These distinctions are important when assessing the relationship between UPI, cash usage and expenditure.
Theme 4:
UPI and Consumer Spending Behaviour. Studies that examine digital payments and consumer spending provides a more direct connection to the central research question, although their findings and methods differ. Dev et al. (2024) surveyed and interviewed Indian UPI users about their spending behaviour. Many respondents reported that they spent more after beginning to use UPI, while some also reported overspending. The study links these responses to the greater ease and reduced visibility of money during digital transactions. However, the sample was urban, and the expenditure information was self-reported. The findings therefore describe the reported experiences of the participants and should not be generalised to all Indian consumers. Faraz and Anjum (2025) examine a related psychological mechanism through the concept of ‘Spendception’. Their study uses 1,162 respondents and structural equation modelling and reports a relationship between reduced psychological resistance to digital purchases and expenditure-related outcomes. The study is concerned with digital payments more broadly rather than UPI alone. It therefore provides supporting evidence about the possible psychological dimension of cashless payments, rather than direct evidence of the effect of UPI. The apparently different findings in this area need to be considered carefully. A study reporting higher spending among digital payment users is addressing a different outcome from a study showing a reduction in cash transactions or cash holdings. Similarly, a higher number of transactions does not necessarily mean that the total amount spent has increased. The literature therefore does not justify a simple conclusion that digital payments either increase or decrease spending. Instead, it indicates the need to examine transaction volume, transaction value, expenditure and cash usage separately.
Critical Synthesis and Link to the Proposed Study
The reviewed literature identifies three closely connected developments. First, UPI adoption has expanded alongside the development of digital payment infrastructure and consumer acceptance. Second, cash continues to be used and held even as its role in some transactions changes. Third, studies of digital payment behaviour suggest that cashless payments may influence consumer spending through psychological and behavioural mechanisms.
However, the studies differ in their research methods, samples and outcome measures. Agarwal et al. (2024) use transaction-level data and a natural-experiment setting to investigate spending responses to digital payment adoption. Bhuyan (2024) examines aggregate cash usage. Fahad and Shahid (2022) and Kiran and Vedala (2025) focus on factors associated with UPI adoption. Panda and Priya (2024) discuss cash demand alongside digital payment expansion, while Tagat et al. (2024) examine banknote lifespan. Dev et al. (2024) and Faraz and Anjum (2025) investigate reported spending behaviour and psychological mechanisms. These contributions are complementary, but their findings cannot be combined without accounting for differences in methodology and the variables being measured.
The research gap addressed by the present study is the need to examine UPI expansion, cash usage and consumer spending patterns together within the defined period of 2016-2025. Rather than claiming that previous studies have ignored these subjects, the proposed research brings the existing evidence into a common analytical framework while maintaining clear distinctions between digital transaction volume, transaction value, cash usage, cash holdings and consumer expenditure.
The study also recognises the distinction between association and causation. If the analysis relies on aggregate secondary data from the Reserve Bank of India and the National Payments Corporation of India, it can identify trends and relationships over time, but it cannot automatically establish that UPI caused changes in household expenditure. Other factors, including income growth, inflation, the COVID-19 pandemic and improvements in digital infrastructure, may also influence the observed trends.
4. Research Gap
The literature available treats UPI adoption, cash usage and consumer spending as largely separate domains and each of these leaves the most critical question open: Has UPI changed how much consumers spend or only how they pay?
Adoption studies (Fahad, 2022; Kiran & Vedala, 2025) try to explain why consumers choose UPI by focusing on its advantages, trust, social influence and facilitating conditions, but they neglect expenditure outcomes. Behavioural studies focus more on spending. Dev et al. (2024) have reported that many surveyed UPI users said that they spent more post adoption, however, the sample was urban and spending was self-reported rather than observed. Faraz and Anjum (2025) have linked reduced psychological resistance to digital purchases with expenditure related outcomes among 1,162 respondents, but, they study digital payments broadly and not UPI specifically. Agarwal et al. (2024) have used the 2016 demonetisation as an experiment and found that there was higher monthly spending alongside greater digital payment adoption. The cash-focused studies (Bhuyan, 2024; Panda & Priya, 2024; Tagat et al., 2024) try to measure cash usage, cash holdings and banknote lifespans instead of spending. These findings answer a different question but they do not contradict the spending evidence. Panda and Priya (2024), for instance, have shown that even as currency in circulation keeps growing, cash’s share as a payment medium has fallen.
Therefore, the gap is more about measurement and linkage, not an absence of research. Among the studies reviewed in this paper, none of them examine UPI transaction volume, value, average ticket size and cash indicators together across the entire 2016-2025 time period while also keeping transaction frequency, transaction value, cash holdings and spending analytically distinct. Aggregate NPCI and RBI figures show increasing volumes and since 2020-21, a falling average ticket size, which is consistent with more frequent, smaller payments. However, it is important to understand that the headline product statistics do not separate person-to-person from person-to-merchant transfers, and they cannot differentiate new spending from existing spending that has simply moved from cash to UPI.
This study addressed a part of that gap. It uses NPCI and RBI time-series data(2016-2025) to understand how UPI growth, average ticket size and cash indicators move together, and it separates payment frequency from payment value throughout. Since aggregate data cannot measure household expenditure directly, its conclusions about spending are limited to association and timing rather than causation.
5. Methodology
Research Design
This study uses a quantitative, explanatory, correlational and comparative research design. The analysis covers 2016 to the latest month common to the NPCI and RBI bulletin datasets in 2025. UPI transactions, transaction values, Average Ticket Size (ATS), cash in circulation and available consumer spending indicators. It is correlational because the study looks at whether changes in UPI usage, cash usage and spending indicators are related to each other. The study does not assume that a change in one variable directly caused a change in another.
Nature of Research
The research is quantitative and empirical in nature and is mainly based on secondary data. Instead of collecting responses directly from people, the study uses information that has already been published by recognised institutions and researchers and information have in NPCI, RBI websites.
Data Collection Tool
Consumer Spending Indicators
In this study, consumer spending will be examined using the following indicators obtained from available secondary data:
Private Final Consumption Expenditure (PFCE): This indicator measures the total expenditure on goods and services for private consumption in India. Data published by the Ministry of Statistics and Programme Implementation (MoSPI) will be used to examine changes in overall consumer expenditure from 2016 to 2025.
Household Consumption Expenditure: This indicator represents the amount spent by households on goods and services such as food, clothing, transportation and other necessities. Available household consumption surveys and government reports will be used to understand changes in spending patterns.
Average Ticket Size (ATS) of UPI Transactions: This indicator measures the average monetary value of a UPI transaction. It is calculated by dividing the total UPI transaction value by the total number of UPI transactions. ATS will help examine whether the average size of UPI payments has increased or decreased over time. However, ATS is treated as a payment behaviour indicator rather than a direct measure of consumer expenditure.
These indicators will help examine changes in consumer spending and payment behaviour during the period 2016 to 2025. UPI transaction value will not be treated as equivalent to total consumer spending because UPI transactions may include both personal transfers and payments for goods and services.
Methods of Data Analysis
The collected secondary data will be analysed using quantitative statistical techniques to examine the relationship between UPI usage, cash usage and consumer spending in India during 2016 to 2025.
1. Trend Analysis
Trend analysis will be used to examine changes in UPI transaction volume, transaction value, Average Ticket Size, currency in circulation and consumer spending indicators over the study period. Line graphs and tables will be prepared to identify increasing, decreasing or fluctuating patterns.
2. Percentage Growth Analysis
Percentage growth analysis will be used to measure year to year changes in UPI transactions, cash related indicators and consumer spending. This will help compare the rate of change in these variables over time.
Percentage Growth = [(Current Year Value – Previous Year Value) / Previous Year Value] x 100
3. Comparative Analysis
Comparative analysis will be used to examine differences in payment behaviour and consumer spending patterns during the earlier and later years of UPI adoption. The study will compare available indicators to understand whether increased digital payment usage occurred alongside changes in cash dependence and consumer expenditure.
4. Correlation Analysis
Correlation analysis will be used, where sufficient comparable data are available, to examine the statistical relationship between UPI usage, cash usage and consumer spending indicators. This analysis will help identify whether the variables move in the same or opposite directions. However, correlation does not establish a cause and effect relationship.
5. Regression Analysis
Regression analysis may be applied if sufficient consistent observations are available. Consumer spending, measured through PFCE, will be considered the dependent variable, while UPI usage and cash related indicators will be considered explanatory variables. The analysis will examine statistical associations between these variables without assuming that UPI adoption directly causes changes in consumer spending.
Variables Used
Summary of Indicators and Measurements
|
Variable |
Indicator |
Measurement |
Source |
|
UPI Usage |
Transaction volume |
Number of transactions (crore) |
NPCI |
|
UPI Usage |
Transaction value |
₹ crore |
NPCI |
|
UPI Payment Behaviour |
Average Ticket Size |
₹ per transaction |
NPCI, calculated |
|
Cash Usage |
Currency in circulation |
₹ crore |
RBI |
|
Consumer Spending |
PFCE |
₹ crore, preferably constant prices |
MoSPI |
|
Consumer Spending |
Household consumption expenditure |
₹ per person or household, per month |
MoSPI household surveys |
Important considerations for research:
- Use PFCE as the primary consumer spending indicator because it provides a consistent national level measure of consumption expenditure.
- Use household consumption surveys as supplementary evidence, since survey data may not be available annually throughout 2016 to 2025.
- Use inflation adjusted PFCE when comparing real consumer spending over time.
- Correlation and regression should be performed only when sufficient comparable observations are available. Annual data for this period provide a small sample, and common upward trends can produce misleading correlations.
6. DATA ANALYSIS AND INTERPRETATION
Overview
This section analyses the growth of digital payments in India, with particular focus on the Unified Payments Interface (UPI) during 2016-2025. It examines transaction volume, transaction value and Average Ticket Size (ATS), alongside the continued use of physical cash. The objective is to identify broad trends rather than establish a strict causal relationship between UPI and cash usage.
The analysis uses secondary data supplied in the working tables attributed to NPCI UPI Product Statistics and RBI Payment System Indicators. Figures are rounded, so calculated growth rates and average ticket sizes are approximate. Aggregate UPI transaction value is not identical to household consumption: it includes different types of transfers and payments.
Growth of UPI Transaction Volume, 2016-2025
Table 1 presents the transaction volume and value supplied in the source material. Year-on-year volume growth has been recalculated from the volume column using (current-year volume ÷ previous-year volume-1) × 100.
|
Financial year |
UPI transaction volume (crore) |
UPI transaction value (₹ lakh crore) |
Year-on-year volume growth |
|
2016-17 |
1.78 |
0.07 |
— |
|
2017-18 |
91.52 |
1.10 |
5042% |
|
2018-19 |
535.00 |
8.77 |
485% |
|
2019-20 |
1,252.00 |
21.32 |
134% |
|
2020-21 |
2,233.00 |
41.04 |
78% |
|
2021-22 |
4,597.00 |
84.18 |
106% |
|
2022-23 |
8,375.00 |
139.21 |
82% |
|
2023-24 |
13,116.00 |
200.00 |
57% |
|
2024-25 |
18,587.00 |
261.00 |
42% |
Source: Figures supplied in the working table, attributed to NPCI UPI Product Statistics and RBI Payment System Indicators. Verify against the original official annual data before final submission.
Figure 1. UPI transaction volume by financial year (2016-17 to 2024-25).
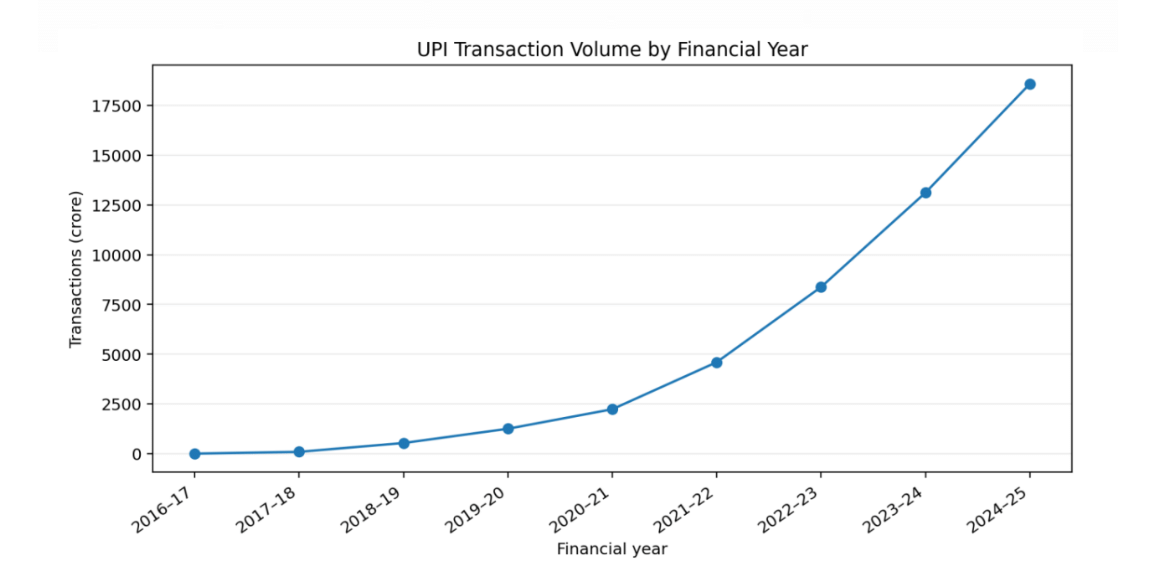
UPI transaction volume increased from 1.78 crore transactions in 2016-17 to 18,587 crore in 2024-25. The annual growth rate is exceptionally high in the early years because the initial base was very small. Although the percentage growth rate generally becomes lower as the base expands, the absolute number of transactions continues to rise. This indicates a major expansion in UPI use, but transaction volume alone does not show whether total consumer expenditure increased.
Growth in UPI Transaction Value
Figure 2. UPI Transaction Value by Financial year (2016-17 to 2024-25)
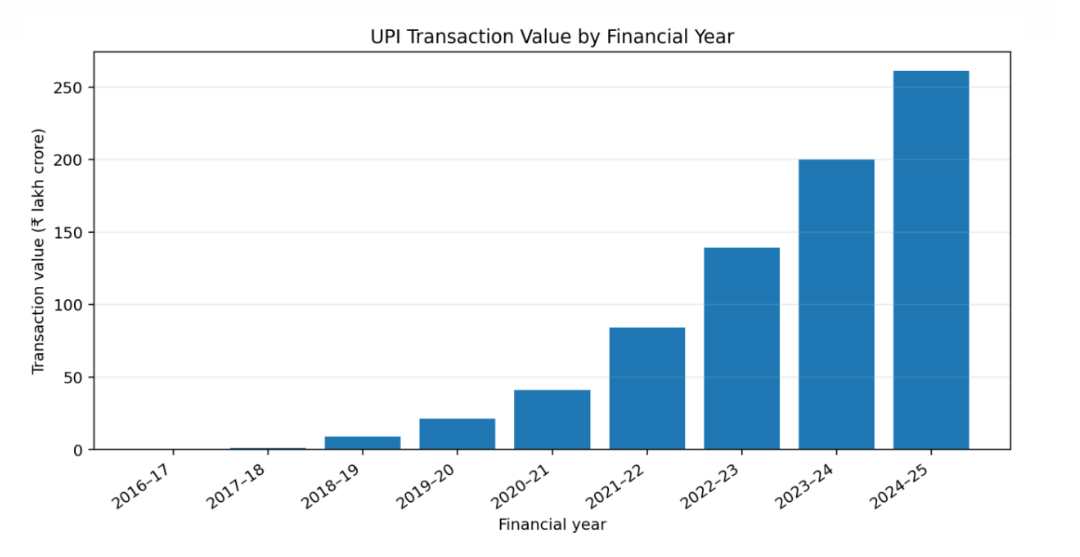
UPI transaction value increased from approximately ₹0.07 lakh crore in 2016-17 to ₹261 lakh crore in 2024-25. The growth in value alongside the growth in volume shows that UPI processes an increasingly large total value of transactions. However, this value should not be interpreted as an equivalent increase in consumer spending because UPI includes person-to-person transfers, merchant payments and other transactions. The aggregate figures show expansion of the payment system, not a standalone causal effect on total consumption.
Average Ticket Size and Small-Value Payments
Average Ticket Size (ATS) is calculated by dividing transaction value by transaction volume. Because the value is expressed in ₹ lakh crore and volume in crore transactions, the ratio is multiplied by 100,000 to convert it to rupees per transaction: ATS = (transaction value ÷ transaction volume) × 100,000. The results below are approximate because the source values are rounded.
|
Financial year |
Calculated ATS (₹) |
Rounded ATS used in Figure 3 (₹) |
|
2016-17 |
3,932.58 |
3,933 |
|
2017-18 |
1,201.92 |
1,202 |
|
2018-19 |
1,639.25 |
1,639 |
|
2019-20 |
1,702.88 |
1,703 |
|
2020-21 |
1,837.89 |
1,838 |
|
2021-22 |
1,831.19 |
1,831 |
|
2022-23 |
1,662.21 |
1,662 |
|
2023-24 |
1,524.86 |
1,525 |
|
2024-25 |
1,404.21 |
1,404 |
Source: Authors’ calculations from the transaction volume and value figures in Table 1.
Figure 3. Approximate average ticket size of UPI transactions by financial year.
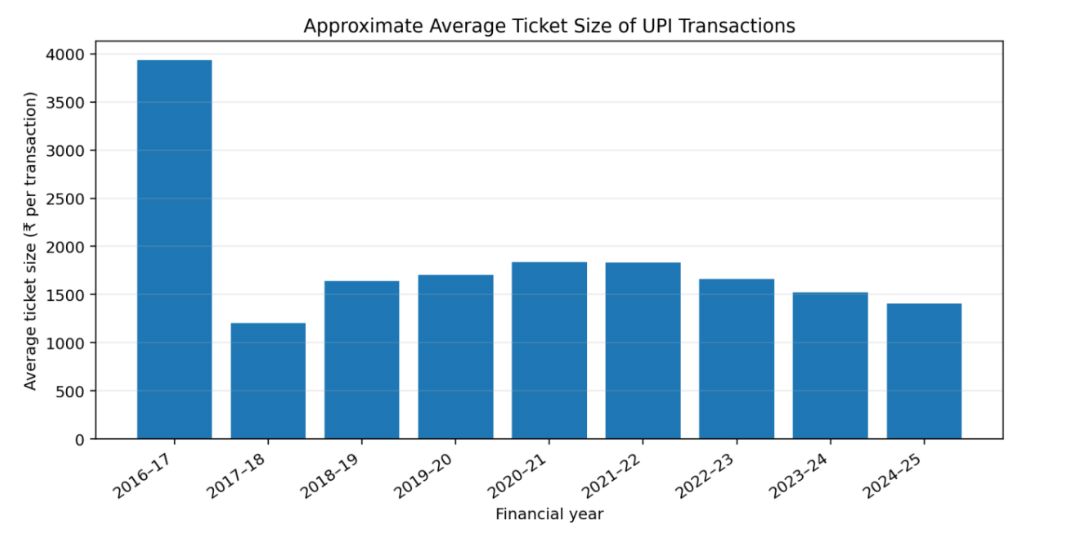
The calculated ATS was approximately ₹3,933 in 2016-17, fell to around ₹1,202 in 2017-18 and then fluctuated before declining to approximately ₹1,404 in 2024-25. The unusually high first-year estimate is based on a very small transaction base and rounded aggregate figures, so it should be interpreted cautiously. In the later years, ATS was generally lower than the initial estimate. This is consistent with UPI being used for a broad range of transaction sizes, including smaller payments, but ATS alone cannot prove that a particular share of transactions is for everyday purchases. Transaction-level or person-to-merchant data would be needed to establish that more directly.
UPI and Changes in Consumer Payment Behaviour
The simultaneous rise in UPI transaction volume and value indicates that UPI has become a significant payment method. The lower ATS compared with the initial year is consistent with broader use across different transaction sizes. Nevertheless, aggregate volume, value and ATS do not independently identify the purpose of transactions or establish that total consumption has increased.
|
Indicator |
Observation supported by the data |
Interpretation and limitation |
|
UPI volume |
Increased in every year shown |
Indicates more UPI transactions; does not by itself measure total spending. |
|
UPI value |
Increased in every year shown |
Indicates higher value processed through UPI; not equivalent to household consumption. |
|
Average ticket size |
Much lower than the first-year estimate; fluctuates over later years |
Consistent with a broader mix of transaction sizes; not direct proof of everyday purchase purposes. |
|
P2M transactions |
No year-wise P2M data supplied in the tables |
Merchant acceptance cannot be quantified from the current tables; add verified NPCI data if this claim is retained. |
|
Cash usage |
No matching annual cash-usage series supplied in the tables |
The coexistence of cash and digital payments needs to be supported by a separate RBI currency or cash-use series. |
The current tables support the conclusion that UPI use expanded substantially. They do not, by themselves, quantify whether cash usage fell. The RBI has discussed the coexistence of digital payment growth and currency demand, including precautionary and store-of-value motives for holding cash. To demonstrate this relationship empirically for 2016-2025, a consistent annual cash indicator—such as currency in circulation, clearly defined and sourced—should be added and analysed alongside UPI data. Currency in circulation is not the same measure as cash used for transactions.
UPI Growth and the Continued Use of Cash
The available UPI figures do not establish a one-to-one relationship between digital payments and cash usage because the supplied tables contain no annual cash series. The appropriate conclusion is therefore limited: UPI grew substantially, while the question of whether and to what extent cash usage changed requires separate evidence. Cash may continue to be held for emergencies, informal transactions or situations where digital payment infrastructure is unavailable. These are plausible explanations discussed in the literature, but they should not be presented as results calculated from Table 1.
Period-wise Interpretation
|
Period |
Broad stage |
Interpretation |
|
2016-2018 |
Introduction and early adoption |
UPI expanded from a small initial base. |
|
2018-2020 |
Rapid expansion |
Transaction volume and value increased substantially. |
|
2020-2021 |
COVID-19 period |
Digital payment growth occurred during wider economic and social changes; not all growth can be attributed to COVID-19 or UPI alone. |
|
2021-2023 |
Large-scale expansion |
UPI volume and value continued to rise sharply. |
|
2023-2025 |
Continued expansion |
UPI reached very high transaction volumes, with growth continuing at a lower percentage rate than in the earliest years. |
Source: Authors’ periodisation based on the annual UPI figures in Table 1. The period labels are interpretive, not independent statistical findings.
The period-wise analysis provides context for interpreting annual growth rates. Early growth rates were very high because the base was small, whereas later years recorded much larger transaction volumes but lower percentage growth. The COVID-19 period should be considered alongside wider economic and social conditions. Any claims about Granger causality or structural breaks in a separate group report should be included only if the underlying dataset, model specification and outputs are available for verification.
Major Findings
- UPI transaction volume rose from 1.78 crore in 2016-17 to 18,587 crore in 2024-25.
- UPI transaction value rose from approximately ₹0.07 lakh crore to ₹261 lakh crore over the same period.
- Year-on-year volume growth was recalculated from the volume column; the corrected rounded rates are 5,042%, 485%, 134%, 78%, 106%, 82%, 57% and 42% from 2017-18 through 2024-25.
- The recalculated average ticket size is approximately ₹3,933 in 2016-17, ₹1,202 in 2017-18, ₹1,639 in 2018-19, ₹1,703 in 2019-20, ₹1,838 in 2020-21, ₹1,831 in 2021-22, ₹1,662 in 2022-23, ₹1,525 in 2023-24 and ₹1,404 in 2024-25.
- The lower ATS in later years, compared with the first-year estimate, is consistent with UPI being used across a broader range of transaction sizes. ATS alone does not establish transaction purpose.
- The supplied tables show the expansion of UPI but do not contain a comparable annual cash-use series or enough evidence to conclude that UPI alone increased total consumer spending. Cash-related conclusions should be supported by a separate, clearly defined RBI series.
Calculation note
Year-on-year volume growth = [(current-year volume ÷ previous-year volume)-1] × 100. ATS = (transaction value in ₹ lakh crore ÷ transaction volume in crore) × 100,000. Since the inputs are rounded, derived results are approximate. The figures and charts in this document use the same suppliedTable1data.
7. Conclusion and Discussion
This study examined how UPI adoption, cash usage and consumer spending indicators relate to one another in India between 2016 and 2025, using aggregate NPCI and RBI data and without assuming that growth in digital payments caused changes in consumer behaviour. It had three main objectives: to assess whether UPI growth, cash usage and spending indicators move together; to examine whether UPI has changed the pattern of everyday payments; and to consider differences in adoption across age, income and location.
UPI growth and payment patterns.
UPI volume increased from 1.78 crore transactions in 2016-17 to 18,587 crore in 2024-25, and transaction value from ₹0.07 lakh crore to ₹261 lakh crore. Average ticket size (ATS) gives us more information than the totals. The ATS of about ₹3,900 in 2016-17 is the pilot year and is not a useful starting point. From about ₹1,200 in 2017-18, ATS rose to a peak of about ₹1,840 in 2020-21 and then declined steadily to about ₹1,400 in 2024-25, around 24% below its peak. This pattern combined with the rapidly rising volume, is consistent with UPI being used increasingly for smaller, routine payments. The adoption literature offers a plausible explanation: Fahad (2022) and Kiran and Vedala (2025) both identify convenience, ease of use, trust and supportive conditions as the key drivers of UPI usage. The aggregate data, however, cannot show that these smaller payments were previously made in cash, so this remains an interpretation and therefore, cannot be concluded as a clear substitution.
UPI and cash.
The evidence shows more of coexistence rather than complete replacement. Panda and Priya (2024) report that cash’s share as a payment medium has declined even though currency in circulation has continued to grow, and they attribute the persistence of cash to precautionary and store-of-value functions. Tagat et al. (2024) find that lower-denomination notes, which are more likely to be used in everyday transactions, have shorter circulation lives than higher-denomination notes, which highlights the pattern where cash serves as both transactional and store of value purposes. The RBI describes this combination as the currency demand paradox. The group’s macroeconomic analysis adds a timing result: higher UPI volumes are associated with slower cash growth two to five months later, while cash growth does not predict UPI volumes. These results show predictive timing, not causation, and they come from the group’s analytical framework and have not been independently reproduced here, so they support the substitution-of-transactional-cash interpretation without confirming it.
UPI and consumer spending.
The study cannot conclude that UPI has increased total consumer spending. Transaction value measures what passes through the payment system, and it includes person-to-person transfers as well as merchant payments. A rise in UPI transactions could reflect a genuine growth in consumption, spending that has moved from cash to digital channels, or a mix of the two. Agarwal et al. (2024) and Dev et al. (2024) suggest that digital payments may encourage higher spending, but the first rests on the specific setting of demonetization and the second on self-reported data from an urban sample, so neither can be generalised to all Indian consumers.
Limitations.
The third aim, differences in adoption by age, income and location, could only be addressed indirectly through existing surveys, since demographic data was not collected as a part of this study. The headline UPI statistics used here do not separate person-to-person from person-to-merchant payments, and the sources differ in definitions and reporting periods. The analysis used here is descriptive and correlational.
Implications.
UPI has changed how Indians pay and how often they make small digital payments, but it has not replaced cash. For policymakers, this suggests that investment in digital payment infrastructure should continue along with support for parts of the economy that still depend on cash, rather than treating one as a substitute for the other. For future research, the clearest next step is transaction-level or household-level data, including the person-to-person and person-to-merchant split available in NPCI’s ecosystem statistics, that can separate real changes in spending from changes in how spending is paid for.
REFERENCES
Agarwal, S., Ghosh, P., Li, J., & Ruan, T. (2024). Digital payments and consumption: Evidence from the 2016 demonetization in India. The Review of Financial Studies, 37(8), 2550-2585.
https://academic.oup.com/rfs/article/37/8/2550/7625073?utm
Awasthy, S., Misra, R., & Dhal, S. (2022). Cash versus digital payment transactions in India: Decoding the currency demand paradox. RBI Occasional Papers, 43(2
https://www.rbi.org.in/Scripts/bs_viewcontent.aspx?Id=4344
Bhuyan, P. (2024). Cash usage indicator for India. RBI Bulletin, October 2024, 255-269. Reserve Bank of India
https://brandequity.economictimes.indiatimes.com/news/research/use-of-cash-still-dominant-but-digital-modes-are-catching-up-quite-fast/114535836
Dev, H., Gupta, R., Dharmavaram, S., & Kumar, D. (2024). From cash to cashless: UPI’s impact on spending behaviour among Indian users and prototyping financially responsible interfaces [Preprint]. arXiv.
https://arxiv.org/abs/2401.09937
Fahad, M. S. (2022). Exploring the determinants of adoption of Unified Payment Interface (UPI) in India: A study based on diffusion of innovation theory. Digital Business, 2(2), Article 100040.
https://doi.org/10.1016/j.digbus.2022.100040
Faraz, N., & Anjum, A. (2025). Spendception: The psychological impact of digital payments on consumer purchase behaviour and impulse buying. Behavioral Sciences, 15(3), 387.
(PDF) Spendception: The Psychological Impact of Digital Payments on Consumer Purchase Behavior and Impulse Buying
Kiran, K. P., & Vedala, N. S. (2025). Assessing Unified Payments Interface (UPI) adoption and usage through the interplay of UTAUT factors. Humanities and Social Sciences Communications, 12, Article 1060.
https://doi.org/10.1057/s41599-025-05313-w
National Payments Corporation of India. (n.d.-a). Unified Payments Interface (UPI): Overview. Retrieved October 25, 2026, from
https://www.npci.org.in/product/upi
National Payments Corporation of India. (n.d.-b). UPI ecosystem statistics [Data set]. Retrieved October 25, 2026, from https://www.npci.org.in/product/ecosystem-statistics/upi
National Payments Corporation of India. (n.d.-c). UPI product statistics [Data set, 2016-17 to 2024-25]. Retrieved October 25, 2026, from
https://www.npci.org.in/product/upi/product-statistics
Panda, S., & Priya, A. (2024). Cash v/s digital payment transaction in India. Frontiers in Health Informatics, 13(8), 2079-2088. https://healthinformaticsjournal.com/index.php/IJMI/article/view/1841/1727
Reserve Bank of India. (n.d.). Payment system indicators [Data set, 2016-17 to 2024-25]. Retrieved October 25, 2026, from https://www.rbi.org.in/Scripts/PSIUserView.aspx
Reserve Bank of India. (2023). Annual report 2022-23.
Annual Report | Official Website of Reserve Bank of India
Reserve Bank of India. (2024). Annual report 2023-24.
Annual Report | Official Website of Reserve Bank of India
Reserve Bank of India. (2025). Annual report 2024-25.
Annual Report | Official Website of Reserve Bank of India
Tagat, A., Özmen, M., & Markowsky, G. (2024). Banknote life in India: A survival analysis approach. Journal of Quantitative Economics, 22(2), 519-545.
https://doi.org/10.1007/s40953-024-00390-1