Authors: Bushra Binte Alam, Rohan Vashist, Yash Gaur, Kedam Madhuri, Anushka Gupta, Ridhima Ganju, Deepika Boora
Abstract
Plastic pollution has become a major environmental concern because of its widespread presence in freshwater and marine ecosystems. Both macro plastics and microplastics are increasingly found in rivers, lakes, coastal regions, and oceans, where they can harm aquatic life and eventually affect human health through the food chain. This review examines recent studies on the sources, distribution, occurrence, and impacts of plastic contamination in aquatic environments. It also discusses commonly used sampling methods and analytical techniques for detecting plastic particles, including FTIR, Raman spectroscopy, Scanning Electron Microscopy (SEM), Pyrolysis–Gas Chromatography–Mass Spectrometry (Py-GC/MS), and hyperspectral imaging. In addition, findings from selected freshwater and marine case studies are reviewed to provide a better understanding of the extent of plastic pollution and its environmental consequences. The review highlights several challenges, such as the absence of standardized sampling protocols, limited long-term monitoring, and the difficulty of identifying very small plastic particles. Addressing these issues will require improved detection methods, better waste management practices, and stronger collaboration among researchers and policymakers. Overall, this review summarizes the current understanding of plastic contamination in aquatic ecosystems and identifies important areas for future research and effective pollution management.
Keywords: Microplastics, Macroplastics, Freshwater Ecosystems, Marine Ecosystems, Plastic Pollution, Detection Techniques, environmental monitoring.
Introduction
Plastic pollution is the accumulation of plastic objects and particles for example plastic bottles, bags and micro beads in the Earth’s environment that adversely affect humans, wildlife and their habitat. Plastics that act as pollutants can be categorized by their size such as micro, or macro debris. Micro plastics and macro plastics are classified by their physical size. Micro plastics are plastic particles smaller than 5 mm like micro beads. Macro plastics are larger plastic items 5 mm and above like bottles, bags etc (Kumar et al., 2025).
Plastics are inexpensive and also durable, which makes them very adaptable for different uses; as a result, manufacturers choose to use plastic over other materials. However, the chemical structure of most plastics renders them resistant to many natural processes of degradation and as a result they are slow to degrade. Together, these two factors allow huge volumes of plastic to enter the environment as mismanaged waste which stays in the ecosystem and travels throughout food webs (Wikipedia contributors, n.d.).
Micro plastics in freshwater ecosystems are an increasingly important environmental issue, with the few available studies which suggest high contamination worldwide. They are found in oceans, rivers, lakes, the atmosphere, beaches, and sediments. They are most often created on land and then are carried by wind and rivers to oceans, where they become part of the global ocean circulation system. Once in the ocean, fish and other marine organisms ingest micro plastics. This can kill those organisms or become part of the food chain for fish and finally humans (Nyadjro et al., 2023).
A comparison of the most prevalent macro plastic items in freshwater versus marine environments has not been conducted, nor has a thorough investigation of macro plastic prevalence in freshwater. There are only a handful of studies examining the typologies of freshwater macro plastic pollution. This confuses public and corporate to address the challenge of reducing these macro pollutants. Given the number of organizations conducting research and collecting data on the subject, the overall lack of accessible information creates large knowledge gaps that prevent priority setting.
Macro plastics: The Visible Threat
Macro plastics are the everyday plastic debris we see in our environment. They primarily harm wildlife through physical interactions. It is seen that every year, millions of tonnes of plastic waste enter the environment, where it stays for decades or even centuries because most plastics do not biodegrade easily. As larger plastic items break down into tiny particles known as micro plastics, they spread through ecosystems and enter the bodies of aquatic organisms, wildlife, and humans.
Micro plastics: The Invisible Accumulators
Because micro plastics are so small, they can be easily ingested by organisms at the bottom of the food chain, allowing toxins to bio accumulate.
Both micro plastics and macro plastics act as sponges for pollutants, absorbing harmful chemicals from the surrounding environment. Floating macro plastics transport invasive species across oceans, while micro plastics can even be transported via atmospheric dust.
The weathering of plastic debris causes its fragmentation into particles that even small marine invertebrates may ingest hence contaminating the food chain. Their small size renders them untraceable to their source and very difficult to remove from ocean environments. In the marine environment, plastic pollution causes entanglement, toxicological effects through ingestion of plastics, suffocation, starvation, and rafting of organisms, provision of new habitats, and introduction of invasive species are significant ecological effects with growing threats to biodiversity and trophic relationships (Bhardwaj et al., 2024).
Plastics released from densely populated coastal regions can travel thousands of kilometres before accumulating in ocean gyres and other convergence zones. Similarly, the Atlas of Ocean Microplastics provides detailed information regarding the spatial distribution of micro plastic concentrations across global oceans. Combined with OECD plastic production, waste generation, and leakage datasets, these resources offer valuable insights into the causes and consequences of plastic contamination in aquatic ecosystems (OECD plastic data).
Marine wildlife such as seabirds, whales, and turtles mistake plastic waste for prey and ingest plastic objects or particles, including micro plastics. This has an impact, ranging from lacerations, infections, reduced ability to swim, internal injuries to death due to blocked stomachs and guts. Plastics make their way into bodies of freshwater and move freshwater through runoff.
For the future of humankind to be safe and healthy, extensive research is crucial for gaining a better understanding of the origin of plastic pollution, ways by which it propagates, and its adverse consequences on the environment and human health. Without ongoing and detailed research, it would be challenging to fully understand the extent of plastic contamination or develop effective solutions to protect ecosystems, water resources, and public health for future generations. The Detection Problem – while contamination is widespread, analyzing and detecting these particles, especially micro plastics, remains highly challenging due to their varying sizes, shapes, and polymer types. Research will help us understand the most affected spheres, improve methods for detecting plastic contaminants, and assess the effectiveness of the prevalent waste management methods. Research also provides the scientific evidence essential for developing strategies to reduce plastic pollution. It also helps governments, researchers, industries, and local communities make decisions and adopt sustainable practices for a better future.
Literature Review
Microplastics and macro plastics enter aquatic environments through a variety of natural and human-induced pathways. Duis and Coors (2016) classified microplastics into two main categories: primary and secondary microplastics. Primary microplastics are intentionally manufactured in small sizes and are commonly used in personal care products, cosmetics, industrial abrasives, and some pharmaceutical applications. In contrast, secondary microplastics are formed when larger plastic items such as bottles, plastic bags, food packaging, fishing nets, and other plastic materials gradually fragment because of ultraviolet radiation, mechanical abrasion, and other weathering processes. These fragmented particles eventually enter rivers, lakes, and marine environments, where they persist for long periods due to the slow degradation of plastic materials.
Most studies indicate that land-based activities are the dominant source of plastic pollution in aquatic ecosystems. According to the United Nations Environment Programme (UNEP, 2021), mismanaged municipal solid waste, open dumping, littering, landfill leakage, untreated wastewater, stormwater runoff, agricultural runoff, and atmospheric deposition are major pathways through which plastics are introduced into freshwater and marine environments. Similarly, the OECD (2022) reported that inadequate waste collection, increasing plastic consumption, and poor waste management practices have significantly increased the leakage of plastics into rivers, lakes, and coastal waters. These findings indicate that human activities are the primary contributors to plastic contamination in water bodies.
The review by Jolaosho et al. (2025) further highlighted that urbanization, industrialisation, domestic wastewater discharge, textile washing, vehicle tyre wear, agricultural activities, and tourism contribute substantially to microplastic pollution. Synthetic textile fibres released during household washing and particles generated from tyre abrasion are increasingly recognised as important sources of secondary microplastics in freshwater systems. Industrial effluents and wastewater treatment plants also release microplastic particles into rivers because conventional treatment processes cannot completely remove these contaminants before water is discharged into the environment. These continuous inputs increase the quantity of microplastics entering aquatic ecosystems.
Lebreton et al. (2017) identified rivers as one of the major pathways transporting plastic waste from land to the oceans. Plastic waste generated in urban and rural areas is carried into rivers through rainfall, surface runoff, stormwater drainage, and poor waste disposal practices. The study also reported that river catchments with high population density and inadequate waste management contribute larger quantities of plastic waste to aquatic environments. During periods of heavy rainfall and flooding, plastics accumulated on land or in river sediments can be remobilised and transported downstream, increasing the movement of both macroplastics and microplastics into estuaries and coastal waters.
Overall, the reviewed literature indicates that most plastic pollution originates from land-based human activities and is transported through rivers, runoff, wastewater discharge, and environmental processes before reaching freshwater and marine ecosystems. The distribution of microplastics and macroplastics is controlled by environmental factors such as water flow, wind, rainfall, particle characteristics, and sediment interactions, resulting in their widespread occurrence across different aquatic environments (Lebreton et al., 2017; Jolaosho et al., 2025).
1. Occurrence and Case Studies
One of the emerging issues related to plastic pollution that have been recorded in various aquatic ecosystems in India is associated with the effect that it causes on the quality of groundwater resources and coastal ecosystems. In recent studies conducted in various aquatic ecosystems in India, it has been noted that macroplastics, mesoplastics, and microplastics are highly prevalent despite the sources, quantity, and the most common polymers varying across the different aquatic ecosystems in question.
As stated by Sarkar et al. (2019), the research on meso- and microplastics in the sediment of the River Ganga shows that there is a problem of plastic pollution in freshwater ecosystems. As a result of their studies, the researchers performed the analysis of the samples of the sediments collected from seven spots of the lower and estuarine sections of the River Ganga.Both types of plastics were found at all studied locations. The plastics, prevailing in number, included polyethylene terephthalate (PET), polyethylene (PE), and polypropylene (PP). A significant correlation between the density of microplastics and some environmental parameters – such as BOD, phosphates, and conductivity of the sediments – has been established, implying that more pollution results in worse water quality.Although the concentration of microplastics in the Ganga River is lower compared to that in other international rivers, the authors pointed to the existing plastic pollution issue and emphasized the necessity of continuous monitoring of the problem. Likewise, Borah et al. (2026) examined the distribution of microplastics in the Loktak Lake, which is one of the most important Ramsar wetlands and the only one with floating islands.Microplastics were found in all sampling points, being more abundant near areas with dense population, fishing points, floating huts, and markets.In the study, fibers and fragments were identified as the two predominant types of microplastics whereas the polymers were polypropylene, polyethylene terephthalate, polyamide and polyvinyl chloride. In the conclusion of their study, the researchers claimed that human beings are an important source of microplastics which increase the chance of the intake of microplastics by freshwater organisms. This conclusion has similarities with the study carried out by Sarkar et al. (2019). Likewise, the research conducted by Vidyasakar et al. (2018) focused on the macro-debris and microplastic pollution in the coastal areas of Rameswaram Coral Island in the Gulf of Mannar region. The sediments collected from 20 coastal areas contain macro-, meso- and microplastics. As per FTIR analysis, the most dominant plastics include polypropylene and polyethylene whereas other types such as polystyrene, nylon and polyvinyl chloride were also found. It has been
revealed that tourism, pilgrimage, settlements and fishing activities are some of the main sources of plastic pollution in this region. Although this study has dealt with the coastal but not with the freshwater ecosystems, it still has similarities with the studies carried out by Sarkar et al. (2019) and Borah et al. (2026).
2. Sampling and Analysis
The world generates 22 million metric tonnes of plastic in aquatic environments, and that figure is expected to climb to roughly 44 Mt per year by 2060 (OECD, 2022). This literature review examines, “Micro and Macro Plastic Contamination Analysis and Detection in Water Bodies,” using four key datasets to obtain an overall view of plastic flow and its impact on the aquatic ecosystems. Each dataset plays a crucial role in examining this problem from different angles. The secondary data obtained from these datasets provide the evidence base needed to understand the movement and origin of mismanaged and littered waste in the global ocean, their distribution, and how plastic waste, production, and leakage have evolved since 1990 and are projected to evolve through 2060 (Atlas of Ocean Microplastics, 2024; Chassignet et al., 2021; Nyadjro et al., 2023; OECD, 2022).
The United Nations Environment Programme (UNEP) dataset is the strongest in geographical coverage and provides evidence of transboundary plastic transport, while the OECD Global Plastics Outlook is utilized because of its policy driven database and long-term projections in plastic production, waste generation, leakage. Although the temporal coverage of Atlas of Ocean Microplastics and the NOAA National Centers for Environmental Information (NCEI) Marine Microplastics differs significantly, they are the strongest databases for their geographic coverage of microplastics across oceans.
The selected datasets represent different methodological approaches. The UNEP Ocean Transport Model and OECD Plastics Database utilize model outputs to simulate particle transport and leakage under different environmental and socioeconomic conditions (Chassignet et al., 2021; OECD, 2022). However, the AOMI and NOAA work together to build real field observations, providing harmonized sampling and monitoring of microplastics in marine environments (Nyadjro et al., 2023; Atlas of Ocean Microplastics, 2024).
3. Detection Techniques for Micro and Macro Plastic Contamination in Water Bodies
Visual and Physical Detection Methods:
For macro-plastics like debris detection with particle size being larger than approximately 1 cm, in this case direct visual inspection remains one of the most practical and widely used methods. Trained observers present on shorelines, riverbanks, or aboard vessels conduct various scientific surveys, classifying different plastics present in the aquatic body based on parameters as type, colour, and estimated category. Standardized survey protocols, such as those used for evaluation by OSPAR and MSFD standard frameworks are called for action. These are used to define survey strip width, sampling intervals, and classifications. While visual inspection is cost-effective and requires no costly and specialized equipment, it is subjected to observer biases. Possible human errors and the inability to detect partially submerged or buried items that can result in multiple errors along ways of sampling and detection. The sample estimation of macro-plastics abundance derived from visuals alone are therefore likely to be significantly lower estimated than true concentrations of the present plastics.
As In riverine environments, stationary sampling nets are being deployed for this aspect in order to intercept floating macro-plastics in river, which are known as Neuston nets, manta trawls, and plankton nets of varying mesh sizes (typically 300–500 μm for microplastics and coarse mesh’s for macro-plastics) based on sample requirements to capture particles for subsequent laboratory testing. A key limitation of this method is that net-based methods sample only the surface or upto a defined depth and are therefore not representing the full distribution of plastics within the water column or sediments.
For particles in the lower microplastics size range (1 μm to a few mm i.e,~5mm), optical microscopy is typically the first step utilised in detection workflows and research methodology as it is one of the most easy step to be replicated and initialise the process with. As after density based separation, filtration, and sample digestion to remove organic matter, retained particles are examined under compound microscopes. Particles are classified based on their shape (fragment, fibre, film, pellet, foam), colour, and size, with accuracy reportedly reaching 67% for particles between 50 and 100 μm and declining further for smaller sizes. Another technique is Fluorescence microscopy, using dyes such as for example Nile Red that selectively stain hydrophobic plastic surfaces, significantly improving detection sensitivity for particles below 100 μm, though interference from natural organic matter and biofouling still remains a huge challenge.
Scanning Electron Microscopy (SEM) provides high-resolution images for description of the surface in terms of morphology and other characteristics of individual particles, revealing surface texture and morphology, degradation features, and giving info about the attached contaminants to the surface. When coupled with high energy X-ray Spectroscopy, SEM can provide elemental composition data that assists in segregating polymer plastics from mineral particles. However, SEM is destructive, slow, and requires extensive sample preparation including coating, this process limits its utility for high-throughput monitoring.
Spectroscopic Identification Techniques:
Beyond Visual Inspection, Fourier Transform Infrared Spectroscopy or FTIR is among the techniques used for chemical identification and fingerprinting of micro-plastics. This technique works on the principle that irradiating a sample with infrared wavelength light and measuring/ understanding the absorption spectrum arising due to molecular bond vibrations helps identify the plastics. Different compounds and their classes (e.g., polyethylene, polypropylene, polystyrene, PET, PVC) exhibit different infrared absorption spectrum and behaviour, using FTIR in polymer identification when compared with reference spectral pattern libraries.
In its standard form as Attenuated Total Reflectance (ATR-FTIR) configuration, the technique requires direct contact between the particle and the crystal prism making the strikes of the infrared light for best identification, making it suitable for particles of size approximately 500 μm.
Micro-FTIR, which couples FTIR technique to an optical microscope, extends detection limits and identification capabilities to particles as small as 10–20 μm.
Most significantly, Focal Plane Array (FPA)-FTIR imaging allows for chemical mapping of the entire filter membrane containing hundreds or thousands of particles, dramatically increasing throughput and enabling automated and easier spectral identification.
Key limitations include difficulty in characterising black or heavily coloured particles that absorb strongly across the infrared spectrum, and the significant cost of FPA detector systems, which require liquid nitrogen cooling.
Raman Spectroscopy is utilised as the principal alternative to FTIR techniques for micro-plastics identification. Unlike FTIR, which works by measuring infrared absorption, Raman spectroscopy detects scattered laser light which means while studying the resulting shift in photon energy information relative to the molecular vibrations. Raman microscopy or spectroscopy technique is able to achieve resolutions down to 1 μm, making it one of the most sensitive spectroscopy techniques for characterising very small microplastic particles and potentially extending detection into the sub-micron range for most efficient plastic identification. A significant recent development done in the field of flow Raman spectroscopy, for continuous detection of the working fluid for plastics is that in this method plastic particles suspended in water pass through a laser focus within a flow cell, enabling real-time detection without filter-based sample preparation. Research published in 2025, (Kissel, A., Nogowski, A., Kienle, A., & Foschum, F. (2025) demonstrated the capacity to acquire Raman spectra of individual polystyrene particles as small as approximately 4 μm in diameter — a detection limit substantially smaller than previously achieved with spontaneous Raman in-flow setups. This approach is augmented by acoustic particles (which means using sound waves for manipulation of particle oscillation) for focusing to concentrate particles into the laser beam and represents a major advance toward the elaboration of the field of continuous, online monitoring of microplastic concentrations in drinking water and environmental samples testing by industry to identify its fitness for use.
Key limitations of Raman spectroscopy include fluorescence interference from coloured particles and organic contaminants, the requirement for long data acquisition times for weak Raman scatterers, and the high cost of Raman spectrometers and laser systems.
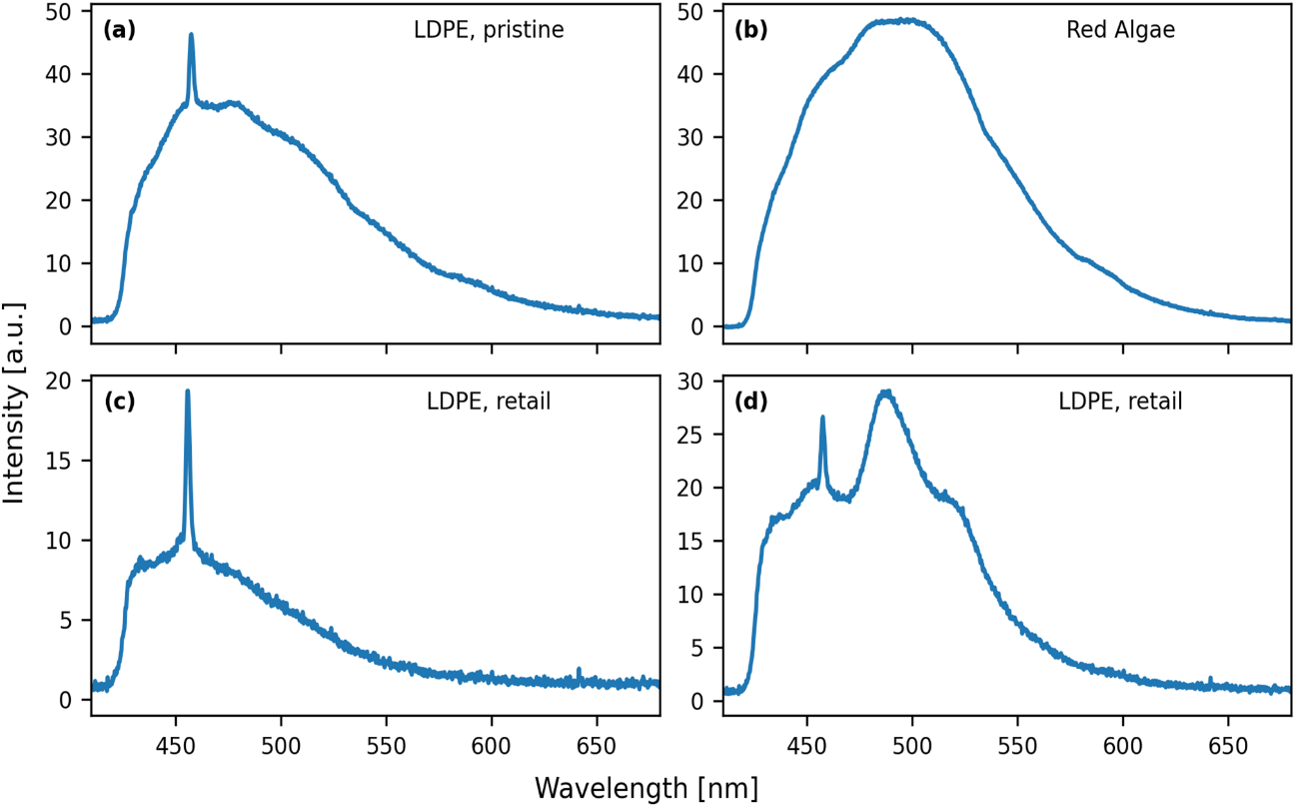
Source: Ornik, J. et al. Could photoluminescence spectroscopy be an alternative technique for the detection of microplastics? First experiments using a 405 nm laser for excitation. Appl. Phys. B 126, 15. https:// doi. org/ 10. 1007/ s00340- 019- 7360-3 (2020).
Photoluminescence (PL) spectroscopy has been recently considered as a lower-cost, simpler alternative to FTIR and Raman for plastic identification. A PL setup consists of a monochromatic visible-light laser source, a spectrophotometer, and collection optics — components that are less expensive and more portable than conventional Raman or FTIR instruments. Research has demonstrated that PL spectra contain more polymer-specific features that allow segregation of the sample among different plastic types and between plastic and non-plastic marine materials. Critically, when PL spectral data are processed using machine learning classifiers — including Support Vector Machines (SVM), Logistic Regression, and Random Forest algorithms — identification accuracies reaching up to 95% have been achieved for the majority of common polymer types.
The best-performing analysis pipeline is now considered to be a combination of PL spectroscopy with a novel and unsupervised dimensional reduction algorithm called Signal Dissection by Correlation Maximization (SDCM), which is proved to be more effective than the conventional Principal Component Analysis (PCA) approach at identifying sample-specific spectral fingerprints. This unsupervised nature of SDCM confirms robustness against variations in instrument calibration and sample heterogeneity (Ability of the system to withstand unexpected variations), which can be treated as a significant practical advantage for global monitoring programmes. This approach is used for limited resource use-case settings due to its lower cost and high potential for widespread deployments.
Pyrolysis-(Gas-Chromatography/Mass-Spectrometry)
Thermal-Extraction-Desorption-(Gas-Chromatography/Mass-Spectrometry), provides info about the composition analysis by thermal degradation of the plastic particles and identifying the final thermal degradation/ pyrolysis product. These methods provide quantitative mass vs temperature data for specific polymers and can simultaneously detect plastic additives and other contaminants. However, they are destructive, they require comparatively large individual particles for analysis, and yield no morphological count information. They are therefore most appropriately used as complementary methods rather than just primary screening tools.
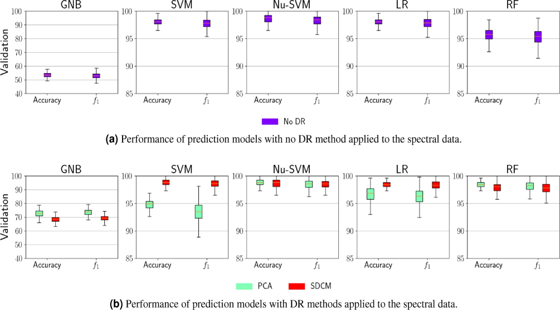
Source: Ornik, J. et al. Could photoluminescence spectroscopy be an alternative technique for the detection of microplastics? First experiments using a 405 nm laser for excitation. Appl. Phys. B 126, 15. .https:// doi. org/ 10. 1007/ s00340- 019- 7360-3 (2020).
Remote Sensing and Imaging-Based Detection:
Hyperspectral Imaging for River and Coastal Monitoring, for detection of large macro-plastics floating in river areas, coastal areas, and ocean bed, for these use-cases remote sensing technologies like hyperspectral imaging which has recently emerged as a transformative tool in this field. The working principle of Hyperspectral cameras is that it captures images across hundreds of spectrum bands within the visible, near-infrared, and shortwave infrared regions of the electromagnetic spectrum. Because plastic polymers exhibit characteristics as reflectance signatures and fingerprints in the near Infrared regions, hyperspectral imagery can in principle be used to segregate floating plastic from water, seaweed, driftwood, sea foam, and other materials. Then comes the concept of Snapshot hyperspectral imagers, which capture the full spatial-spectral data cube in a single acquisition, and are particularly suited for river monitoring applications where target motion presents a significant challenge to pushbroom systems (To capture responses row by row). Research using snapshot Visible-SWIR (660–1700 nm) imaging above simulated river environments demonstrated that neural network classifiers trained on hyperspectral data achieved classification precision of 94% and an Area Under the Curve (AUC) of 0.98 for plastic detection, outperforming both RGB-only approaches and linear classifiers such as logistic regression and linear SVM.
Table 1: Comparative Study of Detection Techniques
| Detection Technique | Advantages | Limitations |
| Visual Inspection (shoreline/vessel surveys, macro-plastics) | • Highly cost-effective; no specialised equipment required.
• Standardised protocols such as OSPAR and MSFD exist. • Practical for large shoreline and riverbank areas. |
• Subject to observer bias and human error.
• Unable to detect submerged or buried items. • May significantly underestimate true plastic abundance. |
| Net-based Sampling (Neuston nets, manta trawls, plankton nets) | • Directly captures particles for laboratory analysis.
• Adjustable mesh size allows sampling of different particle-size ranges. |
• Samples only the upper surface layer or a fixed depth.
• Does not represent the full water column or sediment distribution. |
| Optical Microscopy | • Simple and easily replicable as an initial screening step.
• Classifies particles based on shape, colour and size. |
• Accuracy may be limited, particularly for smaller particles.
• Accuracy decreases with decreasing particle size. • Requires prior filtration and/or digestion of samples. |
| Fluorescence Microscopy (e.g., Nile Red staining) | • Improved sensitivity for particles below 100 μm.
• Selective staining of hydrophobic plastic surfaces. |
• Interference from natural organic matter and biofouling can reduce selectivity. |
| Scanning Electron Microscopy (SEM, with EDX/X-ray) | • High-resolution surface morphology.
• Elemental composition from EDX/X-ray spectroscopy can help distinguish plastics from minerals. |
• Destructive analysis; samples cannot be reused.
• Extensive sample preparation may be required. • Time-consuming and unsuitable for high-throughput monitoring. |
| FTIR (ATR-FTIR, Micro-FTIR, FPA-FTIR) | • Reliable chemical fingerprinting using spectral libraries.
• Micro-FTIR can detect particles down to approximately 10–20 μm. • FPA-FTIR enables automated chemical mapping of filters. |
• ATR-FTIR is generally limited to larger particles (~500 μm and above).
• Black or heavily coloured particles can be difficult to characterise. • FPA detectors are costly and may require liquid-nitrogen cooling. |
| Raman Spectroscopy (including flow Raman) | • Resolution can reach approximately 1 μm.
• Flow Raman enables real-time, filter-free detection for some particles. |
• Fluorescence from coloured or organic material can interfere.
• Weak scatterers may require long acquisition times. • High instrument and laser costs. |
| Photoluminescence (PL) Spectroscopy + Machine Learning | • Potentially lower-cost and more portable than FTIR/Raman.
• Reported identification accuracy can reach approximately 95% with machine-learning models. • SDCM dimensional reduction may improve robustness. |
• Emerging technique with limited field validation.
• Wide-scale deployment remains to be established. |
| Pyrolysis-GC/MS & TED-GC/MS | • Provides quantitative mass-versus-temperature information for polymers.
• Can detect additives and other chemical contaminants. |
• Destructive method; samples cannot be reused.
• Requires suitable sample mass for analysis. • Provides no morphological or particle-count information. |
| Hyperspectral Imaging (river/coastal monitoring) | • Can distinguish plastics from seaweed, driftwood and foam.
• Snapshot imagers can be suitable for moving river targets. • High classification precision has been reported in trials. |
• High computational demand for real-time processing.
• Field performance can be affected by turbidity, lighting and submergence. |
| Satellite Multispectral Detection (e.g., Sentinel-2) | • Cost-effective for large-scale and ocean-scale monitoring.
• Machine-learning classifiers can provide high suspect-pixel classification accuracy. • Synthetic data can help address limited observations. |
• 10–60 m spatial resolution requires plastics to occupy a substantial fraction of a pixel.
• Cloud cover and atmospheric correction introduce uncertainty. • Confusion with sea foam, sea snot and vessels can cause errors. • Not suitable for microplastic-level detection. |
Table 2: Relating Research Gaps to Detection Techniques
| Research Gap | Description | Relation to Techniques Reviewed |
| Insufficient Data from Developing Countries | • Most validated datasets, sensor calibrations and field-trial results originate from well-resourced settings.
• Synthetic data can help compensate for limited in-situ observations but cannot replace region-specific field data. |
Particularly relevant to hyperspectral imaging and satellite-based detection, where training and validation datasets remain geographically limited. |
| Unclear Human Health Impacts | • Most reviewed techniques focus on environmental detection, identification and quantification rather than toxicological effects or human exposure pathways.
• Spectroscopic and imaging methods do not directly connect particle characteristics with dose-response or health outcomes. |
Relevant across microscopy, FTIR, Raman, PL and pyrolysis-GC/MS because detection results are rarely linked directly to human-health risk assessment. |
| Lack of Standardized Sampling and Detection Protocols | • Standardised protocols such as OSPAR and MSFD primarily address macroplastic monitoring.
• Micro/nanoplastic studies vary in mesh size, digestion procedures, particle-size cut-offs and detection criteria, limiting comparability. |
Relevant to net-based sampling, microscopy, FTIR, Raman, PL and pyrolysis-based techniques because methodological variation reduces comparability among studies and regions. |
| Limited Understanding of Nanoplastics/Sub-micron Plastics | • Many techniques have practical detection limits near or above 1 μm.
• Raman may reach approximately 1 μm, flow Raman several μm, and Micro-FTIR approximately 10–20 μm. • Reliable validated approaches for sub-micron and nanoplastic detection remain limited. |
Represents a shared limitation of optical microscopy, FTIR and Raman techniques, which cannot reliably characterise the smallest plastic particles. |
4. Ecological impacts
Plastic contamination has become an environmental concern in aquatic bodies. Rivers and estuaries contain a large amount of plastic waste due to factors like urbanization, industrial activities, domestic wastewater, and fishing practices that cause the distribution and movement of microplastics in aquatic bodies. Micro plastics are plastic smaller than 5 mm whereas Macro plastics are larger plastic are 5 mm or above. After a long duration, large plastic breaks into microplastics which are then easily transported into the water bodies through rainfall, water currents, tidal movement, and human activities. Because of their small size, aquatic species may consume plastic particles and make it easier to travel through the food chain, posing a risk to humans and ecosystems. Several studies reported environmental factors like rainfall, river flow, and how salinity influences the distribution of microplastics.
In the study done by Amrutha et al. (2022) microplastic contamination was in the Sharavathi River, and it was higher during pre-monsoon and reduced after heavy rainfall due to movement of sediments downstream. Similarly, Unnikrishnan et al. (2022) observed that microplastics were present in the Udyavara River Estuary and maximum concentration was at the bottom water layer. The study also obtained those tidal currents, and salinity played an important role in the vertical movement and accumulation of microplastics. Human activities are identified as the source of plastic pollution. Behera et al. (2026) observed that the factors like tourism, household waste and fishing causes macroplastic pollution in the Murud coastline and causes risk to Olive Ridley turtle nesting sites.Similarly, Varsha et al. (2025) found that microplastic contamination in the Ganga River was due to population density, urbanization, and drainage systems. These findings indicate that human activities contribute to the pollution of plastic debris in aquatic environments. Despite very low microplastic contamination, Amrutha et al. (2022) observed risk to the water bodies indicating that plastic debris may accumulate over the time.
In addition to the ecological impacts, plastic debris accumulation also leads to health risk through aquatic animals. Microplastic contamination not only affects water and environment but also leads to ingestion of particles which enter the food chain and affect humans. Accordingly, Ganie et al. (2024) investigated the occurrence and distribution of microplastics in the water, fish, and sediment in Mahanadi River. The researchers collected samples from eight cities located across the river from both upstream and downstream. The researchers concluded that microplastics were found in water, sediment, and fishes. Mostly, microplastics were found in the gut rather than gills indicating ingestion by fishes. The plastics which were found are polyethylene and polypropylene. Higher concentration of microplastics were observed in the downstream area and few sites were identified as risk category V according to the ecological risk assessment. The researchers concluded that effective plastic waste management and pollution control measures are necessary to protect estuarine ecosystems and reduce the risks by microplastic contamination.
In conclusion, these studies demonstrate microplastic and macro plastic contamination in aquatic bodies by various environmental and human activities. Although these studies do not directly observe human effects, they indicate that contaminated fish and other aquatic organisms may act as a source through food consumption. The studies highlight the need for better monitoring and pollution management measures to reduce microplastic pollution.
Methodology
This study was carried out by combining the United Nations Environment Programme (UNEP) data, Atlas of Ocean Microplastic data, NOAA National Centers for Environmental Information (NCEI) Marine Microplastics data and OECD Global Plastics Outlook database to analyze source distribution, transport modeling, accumulation patterns, and future projections of macro and microplastic contamination in aquatic environments.
1. Plastic Usage, Waste Generation, and Environmental Leakage
OECD Global Plastic Outlook was used to analyze historical trends and future projections of macro and microplastic contamination (1990-2060) and to visualize the comparison between three policy scenarios. Graphical representation of recycling, incineration, landfilling, and mismanaged macro and micro plastic waste was performed to show the contribution of management pathways and source distribution of macro and microplastic leakage to aquatic environments across 15 OECD global regions. The OECD Global Plastic Outlook Database conducted a regional aggregation model within its ENV-Linkages framework. The analysis of OECD plastic data is conducted based on this framework to investigate plastic use, waste and
leakage into the aquatic environment. The database is structured around 15 global regions that are grouped into distinct macro regions (Table 1).
The regional aggregation model within ENV-Linkages offers a strong framework for understanding industrial development, consumption demand, and urban expansion over the years, enabling a more in-depth analysis of environmental impacts and policy relevance. The dataset of 15 global regions of the OECD ENV-Linkages model was aggregated into seven macro regions by calculating the total leakage values of their corresponding regions to analyze the geographical distribution of plastic leakage to aquatic environments.
Table 1 Regional aggregation of ENV-Linkages
| Macro regions | ENV-Linkages countries and regions | |
| OECD | OECD America | United States |
| Canada | ||
| Other OECD America | ||
| OECD Europe | European Union countries in OECD | |
| Non-European Union countries in OECD Europe | ||
| OECD Pacific | Australia and New Zealand | |
| OECD Asia | ||
| Non-OECD | Other America | Latin America |
| Eurasia | European Union non-OECD countries | |
| Other non-OECD Eurasia | ||
| Middle East and Africa | Middle East and North Africa | |
| Other Africa | ||
| Other Asia | China (People’s Republic of) | |
| India | ||
| Other Asia | ||
Source: (OECD ENV-Linkages model, 2022)
2. Evaluation of Mismanaged Plastic Waste Using OECD and UNEP Models
OECD regional leakage of mismanaged plastic waste (MPW) to aquatic environments were analyzed from 2010 to 2019. Top 10 MPW emitter countries from the UNEP model to ocean were evaluated between 2010 and 2019. The region-country linkage analysis was examined
to observe whether OECD regions with high aquatic plastic leakage also contained the top 10 ocean plastic emission countries.
3. UNEP Model Predictions with AOMI and NOAA NCEI Real World Measurements
The study was carried out using Atlas of Ocean Microplastics (AOMI) and UNEP marine plastic transport system. The AOMI particle density (particle/Km2) and survey frequency (survey point counts) grid data containing the latitude and longitude of microplastic concentrations across major global oceans were analyzed using ArcMap 8 with the WGS 1984 geographic coordinate system. The particle density map was used to locate high microplastic concentration regions, while the survey frequency map was used to identify the spatial distribution of sampling. The accumulation regions of plastic waste across major ocean gyres of the UNEP study were compared with the AOMI particle density map.
The study also utilizes the UNEP global ocean model to validate the predictions of mismanaged plastic waste (MPW) received on countries’ coastline. To assess the accuracy of the UNEP model, NOAA NCEI Marine Microplastic Database was used. Countries common in both databases (n = 16) were selected. A total of MPW ends up on the beaches of the destination countries was computed. The NOAA NCEI database was used to determine the average standardized nurdle amount. Spearman’s rank correlation analysis was performed to visualize the consistency of both datasets.
Table 2 The interpretation of Spearman’s rank correlation value
| Value | Interpretation |
| 0.00 – 0.199 | Very weak |
| 0.2 – 0.399 | Weak |
| 0.4 – 0.599 | Moderate |
| 0.6 – 0.799 | Strong |
| 0.8 – 1.00 | Very strong |
Source: (Sugiyono, 2010).
RESULTS
1. Plastic Usage, Waste Generation, and Environmental Leakage
1.1. Historical Trends and Future Projections of Macro and Microplastic Contamination (1990-2060).
The OECD global plastic use was 460 million tonnes in 2019 which is expected to increase 1,000 Mt by 2060 (Figure 1). The amount of plastic waste is projected to rise by 661 Mt over the same period. Packaging, textiles, and consumer products are responsible for global plastic waste generation (OECD, 2022). Around 22 Mt of plastic leaked into the environment which is expected to reach 44 Mt by 2060. Although plastics offer numerous benefits, rising demand for plastics has led to an increase in plastic waste accumulation.
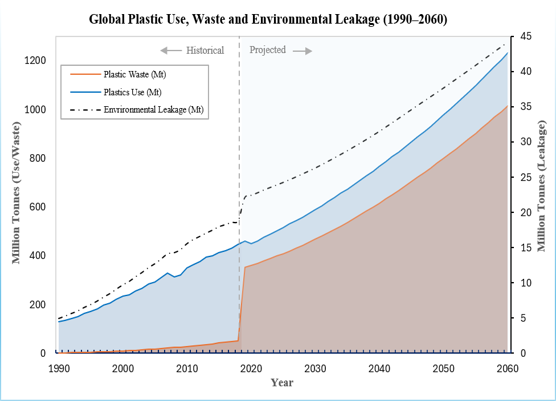
Figure 1. Historical (1990 – 2019) and Projected Patterns (2019 – 2060) of Global Plastic Use, Waste and Environmental Leakage (Plastic Leakage – Estimations from 1990 to 2019, 2024; Plastic Waste – Estimations from 1990 to 2019, 2024; Plastics Use – Estimations from 1990 to 2019, 2024; Projections of Plastic Leakage, 2024; Projections of Plastic Waste, 2024; Projections of Plastics Use, 2024).
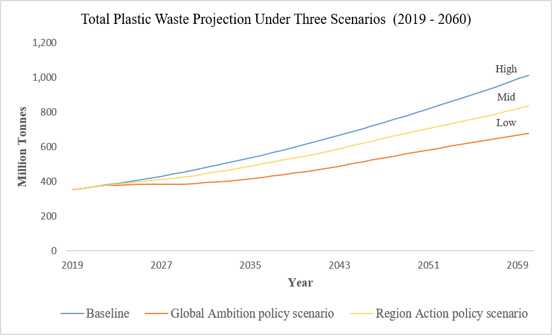
Figure 2. Projections of Plastic Waste Under Baseline, Global Ambition policy and Region Action policy scenario (2019 – 2060). Source: Own analysis based on OECD Projections of Plastic Waste (2024), accessed 26 June 2026.
The projections of plastic waste under baseline, regional action and global ambition policy scenarios provide strong evidence for the future waste management system (Figure 2). Plastic waste increases from 353.3 Mt to 1,014.1 Mt under the baseline scenario from 2019 to 2060. Regional Action Policy Scenario shows a moderate reduction in comparison with the baseline scenario (177.45 Mt) over the same period. Global Ambition Policy Scenario indicates how plastic waste generation varies with the strict enforcement of policy interventions. This reveals total plastic waste declined by 334.6 Mt as compared to the baseline scenario.
1.2. Sources of Macro and Micro Plastic Contamination
The Global Plastic Outlook presents plastic waste management under baseline scenarios from 2019 to 2060. In 2019, total global plastic waste was 353.29 Mt, of which only 9.3% was ultimately recycled, 19.05 % was incinerated, and 22.4 % was either littered or inadequately disposed (Figure 3). Around 49.2 % went to landfills which remains the dominant pathway for plastic waste management. Global plastic waste amounted to 1014.14 Mt in 2060. Of this, 17.3 % plastic waste and residues would be recycled, 17.6 % would be incinerated, and 49.9 % would be disposed of in landfills. Mismanaged waste contributes 15 % share in 2060.
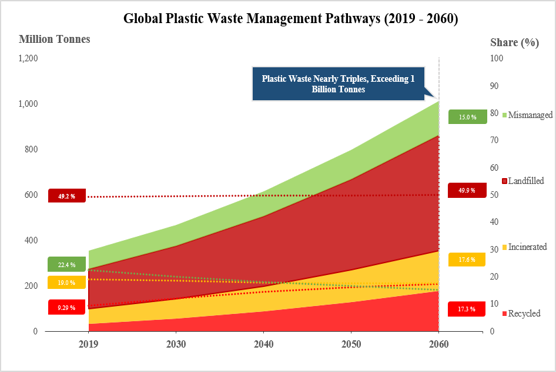
Figure 3. Projection of Global Plastic Waste under the Baseline Scenario (2019 – 2060). Source: OECD Projections of Plastic Waste (2024) accessed 26 June 2026.
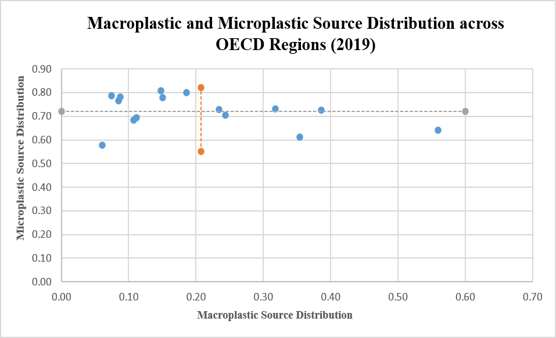
Figure 4. Regional Comparison of Macro plastic and Microplastic Source Distribution (2019). Source: Prepared by the author using (OECD, 2022).
Regional distribution of plastic leakage was measured using a number of different macro and microplastic sources (Figure 4). Higher values indicate that leakage comes from a variety of sources, while lower values indicate a few main sources cause leakage. The average value of both macro and microplastic source distribution divided the OECD 15 regions into four categories. Plastic waste from United States (0.39, 0.73), European Union countries in OECD (0.32, 0.73) and Non-European Union countries in OECD Europe (0.23, 0.73) originates from diverse macroplastic sources, such as littering, marine activities, and mismanaged waste. Among the microplastic sources, tyre abrasion, wastewater sludge, microplastic dust, primary pellets, and road markings were responsible. A larger share of microplastic sources contributes to Other OECD America (0.15, 0.81), Latin America (0.08, 0.77) and European Union non-OECD countries (0.19, 0.80), Other non-OECD Eurasia (0.07, 0.79), Middle East and North Africa (0.09, 0.78) and China (0.15, 0.78), whereas only mismanaged waste out of all macroplastic sources dominates these regions. All macroplastic sources dominate in Australia and New Zealand (0.35, 0.61) and OECD Asia (0.56, 0.64), whereas microplastic contributions are few in these regions. Plastic leakage from Other Africa (0.06, 0.58), India (0.11, 0.69), Other Asia (0.11, 0.68) indicates that only mismanaged waste of macroplastic and microplastic dust, tyre abrasion and wastewater sludge of microplastics are dominant sources. A balance of macro and microplastic sources observed in Canada (0.24, 0.70).
1.3. Geographical Distribution of Plastic Leakage to Aquatic Environment
The regional picture of plastic leakage by comparing 1990 with 2019 is equally noteworthy (Figure 5). Other Asia, particularly China, India and other Asian economies, are the primary contributors, indicating the biggest growth of leakage among all the regions (7.74 Mt). Annual leakage in the Middle East and Africa revealed a substantial increase, from 0.83 Mt to 4.66 Mt. Similarly, a notable rise is observed in Other America, OECD America and Eurasia. However, over the study period, a decline of roughly 0.16 Mt in OECD Europe while OECD Pacific, including Australia and New Zealand, Japan and Korea maintained the lowest leakage level during the same period.
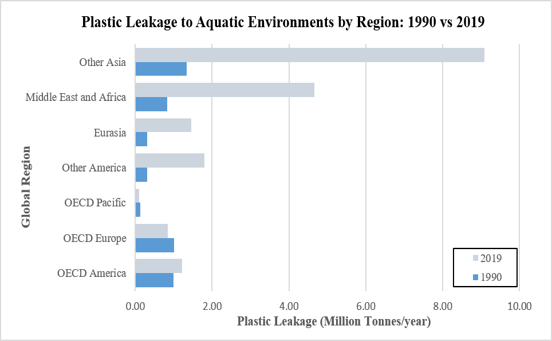
Figure 5 Plastic Leakage to Aquatic Environments by Macro Regions, comparing 1990 with 2019. Source: Own analysis based on OECD Plastic Leakage – Estimations from 1990 to 2019 (2024), accessed 26 June 2026
2. Evaluation of Mismanaged Plastic Waste Using OECD and UNEP Models
China (25%), Sub-Saharan Africa (16%), and Other Non-OECD Asia (13%) generate a larger share of the MPW to aquatic environments (Figure 6).
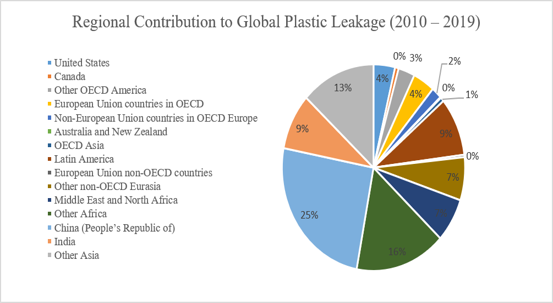
Figure 6. OECD Regional Contribution of Plastic Leakage to aquatic environment (2010-2019). Source: Own analysis, Plastic Leakage – Estimations from, 1990 to 2019 (2024)
A consistent picture is noticed with UNEP dataset which reveals that the top 6 contributors of MPW waste leakage to ocean were, China (3.19 Mt), the Philippines (2.64 Mt), India (1.52 Mt), Brazil (0.94 Mt), Indonesia (0.93 Mt), Vietnam (0.66 Mt). Rank 7 to 10 countries include Malaysia (0.55 Mt), Turkey (0.52 Mt), Nigeria (0.50Mt) and Bangladesh (0.45 Mt) (Figure 7). When we combine insights from UNEP and OECD data, we observe that five highest MPW contributors of the UNEP model belong to the Other Non-OECD Asia region which also exhibit a larger share of the MPW to aquatic environments.
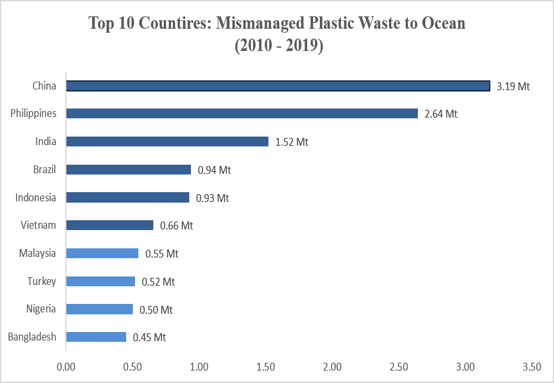
Figure 7. The MPW Originating from Top 10 Countries into the ocean for the 2010−2019 period. Source: (Chassignet et al., 2021)
3. UNEP Model Predictions with NOAA NCEI and AOMI Real World Measurements
The findings of the AOMI particle densities ranged from 0-243,000 particles/km² to 5,011,235-9,786,400 particles/km² reveal that North Atlantic Ocean (2,091,000-5,011,235 particles/km²) and Indian Ocean (5,011,235-9,786,400 particles/km²) had high concentration of plastic, while moderate plastic contamination is noticed in North Pacific Ocean and Mediterranean Sea. Lowest contaminations were observed in the South Atlantic Ocean and South Pacific Ocean. The remaining oceans were dominated by lower particle density classes (0-243,000 and 243,000-824,526 particles/km²) (Figure 8).
Figure 8. AOMI Particle Density Map. Source: (Atlas of Ocean Microplastics, 2024); Prepared by the author using ArcMap 10.8
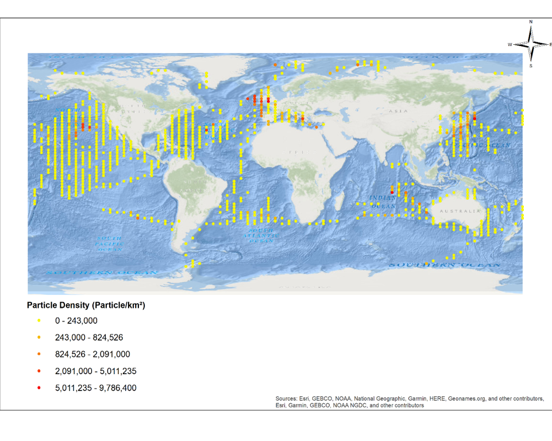
Figure 9. AOMI Survey Frequency Map. Source: (Atlas of Ocean Microplastics, 2024); Prepared by the author using ArcMap 10.8
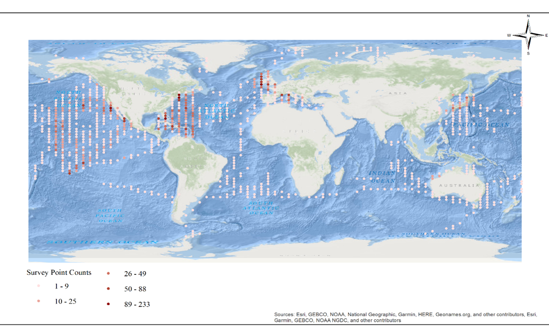
AOMI Survey Frequency Map ranged from 1-9 to 89-233 survey points shows that sampling numbers were high in the North Pacific and North Atlantic (89-233 and 50-88 survey points), whereas lower sampling numbers were observed in much of the South Atlantic, South Pacific, and Southern Ocean (1-9 and 10-25 survey points) (Figure 9).
Among the common countries of UNEP and NOAA model, a total of MPW received by Brazil coastline in UNEP model had the highest rank, while Taiwan and the United States had the highest rank in NOAA dataset based on average standardized nurdle amounts (Figure 10).
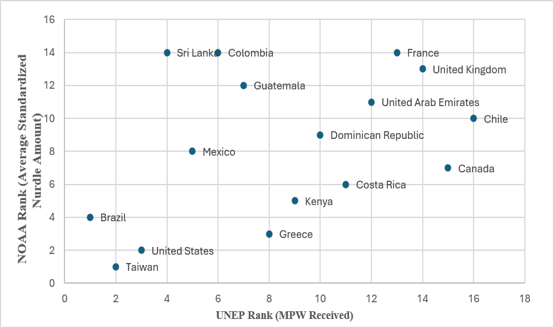
Figure 10. Comparison of ranks of common countries based on total MPW received by destination countries and average standardized nurdle amounts. Source: (Chassignet et al., 2021; Nyadjro et al., n.d.)
Table 1 Spearman’s rank correlation analysis between UNEP ocean model and NOAA NCEI model
| Parameter | Value |
| Number of Common Countries (n) | 16 |
| Spearman’s correlation coefficient (ρ) | 0.411 |
| p- value | 0.115 |
| Significant level | 0.05 |
| Interpretation | Moderate positive, not statistically significant |
The correlation coefficient from Spearman’s rank analysis reveals ρ = 0.411 with a p-value of 0.115 which indicates a moderate positive correlation between and was not statistically significant at the 95% confidence level. Sri Lanka and Colombia had the larger variation between the two models.
Discussion
The analysis of sources, transport modeling, accumulation patterns, and future projections of macro and microplastic contamination in aquatic environments indicates that global plastic pollution will continue to increase unless major interventions are taken. This finding is consistent with the research of Tai et al. (2026) who also observed marine plastic leakage will continue to exceed by 2060 under a Business-as-Usual (BAU) scenario, whereas aggressive intervention strategies could reduce plastic leakage by up to 90%. OECD data reveals that rising plastic consumption is expected to generate huge amounts of waste, which ultimately enter aquatic ecosystems. These observations are in line with the research of Jambec (2015), who noticed that continuous growth of plastic production has resulted in 8 million tonnes entering the oceans annually, leading to the degradation of aquatic habitats. NOAA NCEI documents regions with high plastic contamination likely to raise marine microplastic concentrations. This widespread contamination is largely driven by land-based sources, as Andrady (2011) reported that approximately 80% of plastics found in marine litter originate from terrestrial sources. These findings suggest that plastic pollution is increasing globally and requires coordinated action.
UNEP Global Ocean Model findings suggest that only a small number of countries, such as China, Indonesia, Philippines and Tanzania produce the majority of ocean plastic transported by complex ocean currents and travel far distances from those regions that originate the waste. Linking UNEP and OECD datasets further revealed that China, India, Philippines and Indonesia were consistently at the top of the list indicating waste management of these countries could not cope with the rapid growth of plastic consumption. Jambec (2015) observed a similar scenario, who identified China (8.82 Mt), Indonesia (3.22 Mt), and Philippines (1.88 Mt) as the top ranked MPW waste emitters to the ocean. Global plastic use, waste and environmental leakage projections will maintain an upward trend unless the whole world engages diplomatically with source nations. This finding is consistent with recent studies, which argue that the transboundary nature of marine litter requires multilateral cooperation among countries to effectively mitigate plastic pollution across entire plastic life cycle, including strengthening waste management infrastructure, reducing virgin plastic production, and implementing a global plastic agreement (Barrowclough & Birkbeck, 2022). The baseline scenario indicates that even with the enhancement of recycling technologies, a large share of plastic waste continues to go to landfills, incinerated, or be released into the environment. The Regional Action Policy scenario alone is insufficient to achieve a more sustainable and circular plastic economy. Among all the policies, the Global Ambition Policy is the most promising scenario for controlling future waste generation. The 2060 OECD projections could be different if stronger Global Ambition Policies are implemented. However, the OECD data should be regarded as a minimum baseline, not as a broader context. The findings on the geographical distribution of plastic leakage to aquatic environments are driven by population growth, economic development, and still-maturing waste management systems. The data underscore that developing regions with inadequate waste management infrastructure go through maximum rates of environmental plastic leakage. Therefore, reducing plastic leakage requires effective waste management and policy interventions in major source countries.
The UNEP Model Predictions with AOMI Real World Measurements indicates that the major accumulation zones include the North Atlantic and Indian Ocean for floating plastic debris. However, the finding of the UNEP study further states that the major plastic concentration found in North Pacific, South Pacific, North Atlantic, South Atlantic, and Indian Ocean (Chassignet et al., 2021). These findings are consistent with Yu & Singh (2023), who noted marine microplastic concentrations are spatially heterogeneous, with major hotspot regions occurring in the North Atlantic and North Pacific. Similarly, Law et al. (2010) reported that the highest concentrations of floating plastic debris were observed in the North Atlantic gyre. Kaiser (2010) reported that Charles Moore’s discovery of large amount of floating plastic debris in the North Pacific gyre in 1997 has received widespread media attention and the area became widely known as the “Great Pacific Garbage Patch”. AOMI particle density map across oceans reveals that the particle density of microplastic concentrations was comparatively lower in the South Atlantic and South Pacific Oceans. But fewer survey points were noticed in the South Atlantic, South Pacific, and Southern Ocean. The UNEP Ocean Transport Model is based on model simulations, whereas the AOMI database utilizes real field observations of plastic pollution in marine environments. Though there are variations in their methodological approaches, the major plastic accumulation regions of the UNEP model were also reflected in the AOMI observations. Countries such as Taiwan, the United States, and Brazil ranked highly in both UNEP and NOAA models indicating these countries experience high levels of mismanaged plastic waste accumulation. However, Sri Lanka and Colombia differ significantly in ranking, suggesting that plastic particles released into the coastal waters are transported due to various environmental conditions. This result justifies the UNEP global ocean model findings which demonstrate that plastic can travel vast distances by ocean circulation systems, wind-driven transport and wave action and accumulated in the major ocean gyres, such as North Pacific Gyre, South Pacific Gyre, North Atlantic Gyre, South Atlantic Gyre, and Indian Ocean Gyre (Chassignet et al. 2021). These observations are consistent with studies showing plastic debris travels across coastal waters, where it accumulates in subtropical gyres, convergence zones, and even remote islands (Lavers & Bond, 2017). These observations demonstrate that monitoring and mitigation efforts should also focus on accumulation zones where plastics are likely to concentrate over time.
Research published in Science Advances suggests that plastic leakage to aquatic ecosystems may be four to nine times higher than OECD figures. NOAA NCEI also cannot be compared to different studies due to methodological differences. Similar limitations have been highlighted by Wilkinson et al. (2016), who reported inconsistent sampling and analytical methods, non-uniform measurement units hinder direct comparisons between the NOAA NCEI data with other global microplastic datasets. AOMI database is a new model that is still accumulating global coverage. AOMI is specifically designed to address data harmonization as there is absence of a single global standard for microplastic sampling and analysis. These limitations highlight the need for standardized sampling and monitoring methods.
The findings of this study suggest that future monitoring strategies should begin with initial mapping of plastic pollution in areas identified by the OECD, UNEP, AOMI, and NOAA NCEI datasets to evaluate future changes in plastic contamination. After establishing baseline mapping, monitoring should follow harmonized sampling methods for particle number, size, shape, polymer type, detection limits to compare findings across different regions, leading to more effective pollution management. The comparison of macro and microplastic sources across regions reveals region-specific mitigation strategies for plastic leakage into the aquatic environment. Future monitoring approaches should integrate quality assurance procedures, advances in analytical techniques, and long-term assessments to track plastic pollution over extended periods. Such monitoring requires increased collaboration, and greater support for data sharing to mitigate plastic pollution globally, including the implementation of the UN Global Plastics Treaty.
Despite significant limitations, four datasets are most powerful when used together to provide a real analytical view of the plastic leakage, transport pathways, accumulation patterns, future projections, policy advancements, and mitigation strategies for global plastic contamination.
Conclusion
Plastic pollution has become a growing environmental concern due to its widespread presence in freshwater and marine ecosystems. This review highlights that both macroplastics and microplastics are continuously entering aquatic environments through multiple sources, including mismanaged waste, industrial activities, and urban runoff. The findings also show that advances in analytical techniques such as FTIR, Raman spectroscopy, SEM, and hyperspectral imaging have significantly improved the detection and characterization of plastic particles, although challenges remain in identifying smaller particles and achieving standardized monitoring.
The analysis further indicates that plastic contamination is unevenly distributed across different regions, with developing countries often facing greater environmental risks because of inadequate waste management and increasing plastic consumption. Existing global datasets and monitoring efforts provide valuable insights, but differences in sampling methods and reporting make comparisons difficult.
Addressing plastic pollution requires a combination of improved waste management, consistent monitoring protocols, stronger environmental policies, and greater public awareness. Future research should focus on long-term monitoring, better detection of nanoplastics, and the development of cost-effective analytical methods that can be adopted across different regions. By combining scientific research with effective policy implementation and public participation, it is possible to reduce plastic pollution and better protect freshwater and marine ecosystems for future generations.
Credit authorship contribution statement
Bushra Binte Alam: Writing – Sampling & Analysis, Methodology, Results and Discussions, Rohan Vashist: Writing – Detection Techniques, Yash Gaur: Writing – Abstract, Conclusion, References and Editing, Kedam Madhuri: Writing – Sources & Distribution, Anushka Gupta: Writing – Introduction, Ridhima Ganju: Writing – Ecological & Human Health Impacts, Deepika Boora: Writing – Occurrence & Case Studies.
References
- Amrutha, K., Shajikumar, S., Warrier, A. K., Sebastian, J. G., Sali, Y. A., Chandran, T., Sivadas, S., Naik, R., Amrish, V. N., Kumar, A., & Unnikrishnan, V. (2023). Assessment of pollution and risks associated with microplastics in the riverine sediments of the Western Ghats: A heritage site in southern India. Environmental Science and Pollution Research, 30(12), 32301–32319. https://doi.org/10.1007/s11356-022-24437-z
- Andrady, A. L. (2011). Microplastics in the marine environment. Marine Pollution Bulletin, 62(8), 1596–1605. https://doi.org/10.1016/j.marpolbul.2011.05.030
- Araujo, C. F., Nolasco, M. M., Ribeiro, A. M. P., & Ribeiro-Claro, P. J. A. (2021). Raman spectroscopy for the analysis of microplastics in aquatic systems. Polymers, 13(23), Article 4165. https://doi.org/10.3390/polym13234165
- Atlas of Ocean Microplastics. (2024). Atlas of Ocean Microplastics (AOMI). Ministry of the Environment, Japan. https://aomi.env.go.jp/
- Barrowclough, D., & Birkbeck, C. D. (2022). Transforming the Global Plastics Economy: The Role of Economic Policies in the Global Governance of Plastic Pollution. Social Sciences, 11(1), 26. https://doi.org/10.3390/socsci11010026
- Biermann, L., Daneshgar, S., Gittings, J. A., & Mata, A. (2020). Finding plastic patches in coastal waters using optical satellite data. Scientific Reports, 10(1), Article 5364. https://doi.org/10.1038/s41598-020-62298-z
- Borah, P., Kshiar, N., Nath, A. J., Dutta Chowdhury, S., & Reang, D. (2026). First evidence of microplastic contamination in surface waters of Loktak Lake, a Ramsar site in the Eastern Himalayas. Scientific Reports. Advance online publication. https://doi.org/10.1038/s41598-026-54098-8
- Chassignet, E. P., Xu, X., & Zavala-Romero, O. (2021). Tracking marine litter with a global ocean model: Where does it go? Where does it come from? Frontiers in Marine Science, 8, Article 667591. https://doi.org/10.3389/fmars.2021.667591
- Duis, , & Coors, A. (2016). Microplastics in the aquatic and terrestrial environment: Sources (with a specific focus on personal care products), fate and effects. Environmental Sciences Europe, 28(1), Article 2. https://doi.org/10.1186/s12302-015-0069-y
- Ganie, Z. A., Mandal, A., Arya, L., Talib, M., & Darbha, G. K. (2024). Assessment and accumulation of microplastics in the Indian riverine systems: Risk assessment and implications of translocation across the water-to-fish continuum. Aquatic Toxicology, 272, Article 106944. https://doi.org/10.1016/j.aquatox.2024.106944
- Harmonized monitoring and data compilation of marine plastic (2019). Ministry of the Environment, Government of Japan. https://www.env.go.jp/page_00929.html
- Isobe, , Azuma, T., Cordova, M. R., Cózar, A., Galgani, F., Hagita, R., Kanhai, L. D. K., Imai, K., Iwasaki, S., Kako, S., Kozlovskii, N., Lusher, A. L., Mason, S. A., Michida, Y., Mituhasi, T., Morii, Y., Mukai, T., Popova, A., Shimizu, K., … Zhang, W. (2021). A multilevel dataset of microplastic abundance in the world’s upper ocean and the Laurentian Great Lakes. Microplastics and Nanoplastics, 1(1), Article 16. https://doi.org/10.1186/s43591-021-00013-z
- Jambec, J. (2015, February 13). Plastic waste inputs from land into the ocean | Science in the Classroom. https://doi.org/10.1126/science.1260352
- Jolaosho, T. L., Rasaq, M. F., Omotoye, E. V., Araomo, O. V., Adekoya, O. S., Abolaji, O. Y., & Hungbo, J. J. (2025). Microplastics in freshwater and marine ecosystems: Occurrence, characterization, sources, distribution dynamics, fate, transport processes, potential mitigation strategies, and policy interventions. Ecotoxicology and Environmental Safety. Advance online publication. https://doi.org/10.1016/j.ecoenv.2025.118036
- Kaiser, J. (2010). The Dirt on Ocean Garbage Patches. Science, 328(5985), 1506–1506. https://doi.org/10.1126/science.328.5985.1506
- Koutnik, V. S., Leonard, J., Alkidim, S., DePrima, F. J., Ravi, S., Hoek, E. M. V., & Mohanty, S. K. (2021). Distribution of microplastics in soil and freshwater environments: Global analysis and framework for transport modeling. Environmental Pollution, 274, Article 116552. https://doi.org/10.1016/j.envpol.2021.116552
- Lavers, J. L., & Bond, A. L. (2017). Exceptional and rapid accumulation of anthropogenic debris on one of the world’s most remote and pristine islands. Proceedings of the National Academy of Sciences, 114(23), 6052–6055. https://doi.org/10.1073/pnas.1619818114
- Law, K. L., Morét-Ferguson, S., Maximenko, N. A., Proskurowski, G., Peacock, E. E., Hafner, J., & Reddy, C. M. (2010). Plastic Accumulation in the North Atlantic Subtropical Gyre. Science, 329(5996), 1185–1188. https://doi.org/10.1126/science.1192321
- Lebreton, L., van der Zwet, J., Damsteeg, J. W., Slat, B., Andrady, A., & Reisser, J. (2017). River plastic emissions to the world’s oceans. Nature Communications, 8, Article 15611. https://doi.org/10.1038/ncomms15611
- Michida, Y., Chavanich, S., Cundell, J., Gaill, F., Galgani, F., Hagmann, P., Lusher, A., & Yoon, J. H. (2019). Guidelines for harmonizing ocean surface microplastic monitoring methods (Version 1.1). Ministry of the Environment, Japan. https://www.env.go.jp/en/water/marine_litter/guidelines/guidelines.pdf
- Nyadjro, E. S., Webster, J. A. B., Boyer, T. P., Cebrian, J., Collazo, L., Kaltenberger, G., Larsen, K., Lau, Y. H., Mickle, P., Toft, , & Wang, Z. (2023). The NOAA NCEI marine microplastics database. Scientific Data, 10(1), Article 726. https://doi.org/10.1038/s41597-023-02632-y
- Nyadjro, E. S., Webster, J. A. B., Boyer, T. P., Cebrian, L., Kaltenberger, G., Larsen, K., Lau, Y. , Mickle, P., Toft, T., & Wang, Z. (n.d.). The NOAA NCEI global marine microplastics data collection [Dataset]. NOAA National Centers for Environmental Information. https://doi.org/10.25921/d1bs-3m40
- Organisation for Economic Co-operation and Development. (2022). Global plastics outlook: Economic drivers, environmental impacts and policy options. OECD Publishing. https://doi.org/10.1787/de747aef-en
- Organisation for Economic Co-operation and Development. (2024). Plastic leakage—Estimations from 1990 to 2019 [Dataset]. https://www.oecd.org/
- Organisation for Economic Co-operation and (2024). Plastic waste—Estimations from 1990 to 2019 [Dataset]. https://www.oecd.org/
- Organisation for Economic Co-operation and (2024). Plastics use—Estimations from 1990 to 2019 [Dataset]. https://www.oecd.org/
- Organisation for Economic Co-operation and Development. (2024). Projections of plastic waste [Dataset]. https://www.oecd.org/
- Organisation for Economic Co-operation and Development. (2024). Projections of plastics use [Dataset]. OECD Data Explorer. https://www.oecd.org/
- Rocha-Santos, T. A. P., & Duarte, A. C. (2015). A critical review of the analytical methods for the characterization, identification, and quantification of microplastics in the environment. Trends in Analytical Chemistry, 65, 47–53.https://doi.org/10.1016/j.trac.2014.10.011
- Sarkar, D. J., Das Sarkar, S., Das, B. K., Manna, R. , Behera, B. K., & Samanta, S. (2019). Spatial distribution of meso- and microplastics in the sediments of River Ganga at eastern India. Science of the Total Environment, 694, Article 133712. https://doi.org/10.1016/j.scitotenv.2019.133712
- Shankar, S., Purti, N., Sivasankar, R., Kaviarasan, T., Satyakeerthy, T. R., & Jacob, (2023). Macro-litter pollution on the remote beaches of Rutland Island, Andaman and Nicobar Islands, India: Implications for transboundary marine litter management in the Indian Ocean Rim countries. Environmental Science and Pollution Research, 30(43), 97834–97849. https://doi.org/10.1007/s11356-023-28024-8
- Sruthy, S., Navaneeth, A., Naga Kumar, K. V., Jesni, K. C., Binish, M. B., Mahesh Mohan, Surendran, U., Harikumar, P. S., & Samuel, M. P. (2024). Microplastic contamination in open well water of Kozhikode City, Kerala, India: Distribution, sources, ecological risk, and citizen perception (Preprint). SSRN. https://ssrn.com/abstract=5079003
- Tai, L., Lu, K., Zhu, L., Zahoor, A., Zhang, Y., Abdoulaye, B., Reichelt-Brushett, A., Ma, W., & Thompson, D. (2026). Global Dynamics and Future Pathways of Marine Macroplastic Pollution: Bibliometric and Scenario-Based Analysis. Water, 18(14), 1716. https://doi.org/10.3390/w18141716
- United Nations Environment Programme. (2021). From pollution to solution: A global assessment of marine litter and plastic pollution. https://wedocs.unep.org/handle/20.500.11822/36963
- Unnikrishnan, V., Valsan, G., Amrutha, K., Sebastian, J. G., Rangel-Buitrago, N., Khaleel, R., Chandran, T., Reshma, S. R., & Warrier, A. K. (2023). A baseline study of microplastic pollution in a southern Indian Marine Pollution Bulletin, 186, Article 114468. https://doi.org/10.1016/j.marpolbul.2022.114468
- Varsha, Dass, A., Ranjan, R., & Singh, S. K. (2025). Sources and factors influencing microplastic concentration during monsoon season in the Ganga River, Bihar, India. Discover Environment, 3(1), Article https://doi.org/10.1007/s44274-025-00383-8
- Vidyasakar, A., Neelavannan, K., Krishnakumar, S., Prabaharan, G., Priyanka, T. S. A., Magesh, N. S., Godson, P. S., & Srinivasalu, S. (2018). Macrodebris and microplastic distribution in the beaches of Rameswaram Coral Island, Gulf of Mannar, southeast coast of India: A first report. Marine Pollution Bulletin, 137, 610–616. https://doi.org/10.1016/j.marpolbul.2018.11.007
- Wilkinson, M. D., Dumontier, M., Aalbersberg, Ij. J., Appleton, G., Axton, M., Baak, A., Blomberg, N., Boiten, J.-W., da Silva Santos, L. B., Bourne, P. E., Bouwman, J., Brookes, A. J., Clark, T., Crosas, M., Dillo, I., Dumon, O., Edmunds, S., Evelo, C. T., Finkers, R., … Mons, B. (2016). The FAIR Guiding Principles for scientific data management and stewardship. Scientific Data, 3(1), 160018. https://doi.org/10.1038/sdata.2016.18
- Yu, R.-S., & Singh, S. (2023). Microplastic Pollution: Threats and Impacts on Global Marine Ecosystems. Sustainability, 15(17), 13252.https://www.mdpi.com/2071-1050/15/17/13252