Authors:
Yugesh R, Geetika Chugh, Ashli Venkilat Kannanpolian, Divya Goyal, Jil Patel, Leela S, Nisha Sikarwar, Pavithraa T, and Sarthak Singh
Abstract
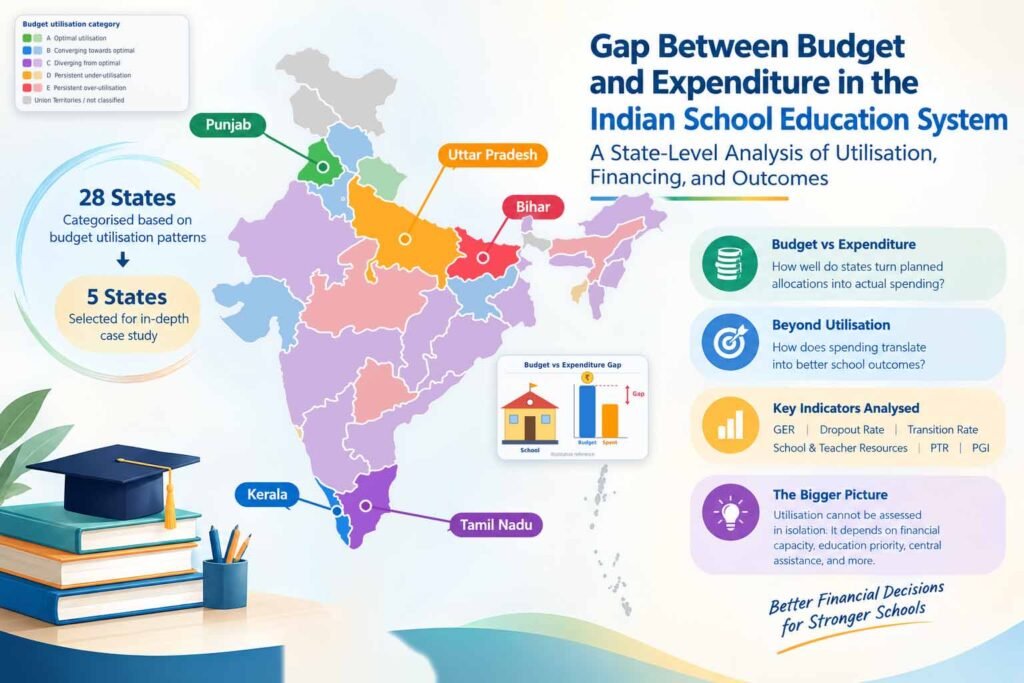
This study examines the gap between budget estimates and actual expenditure in Indian school education at the elementary and secondary levels. It investigates how well states convert planned allocations for education into actual spending and how utilisation patterns vary across states during the financial years 2022–23 to 2024–25. This study is important because existing research has largely focused on education expenditure and educational outcomes from different perspectives. However, recent state-level evidence linking budgeted and actual expenditure remains limited. This study therefore moves beyond allocation to link budget utilisation and its broader implications. The study uses secondary data from official state budget documents, Comptroller and Auditor General of India (CAG) Finance Accounts, and other government sources such as Finance Commission reports, Performance Grading Index (PGI), and Unified District Information System for Education plus (UDISE +) reports, along with primary data collected through a semi-structured interview. Twenty-eight states are classified into five categories of budget utilisation: optimal utilisation, converging towards optimal utilisation, diverging from optimal utilisation, persistent under-utilisation, and persistent over-utilisation. One state from each category, Punjab, Kerala, Tamil Nadu, Uttar Pradesh, and Bihar, respectively, is then studied comparatively as a case. The analysis reveals inter-state variations. Optimal or converging towards optimal utilisation was associated with relatively favourable outcomes in Punjab and Kerala, whereas persistent over-utilisation in Bihar and persistent under-utilisation in Uttar Pradesh did not correspond with strong educational performance. Tamil Nadu further demonstrated that diverging from optimal utilisation does not necessarily imply weaker outcomes across all indicators. Therefore, it is understood that utilisation cannot be assessed independently from financial capacity, education priority, central assistance, and educational outcomes. This study brings to light the importance of efficient budget execution and fiscal management for improving the effectiveness of public spending on school education. Spending the entire budget does not automatically mean better schools. These different patterns between the selected states that show utilisation alone do not explain differences in educational outcomes. This study compares budget utilisation with selected educational indicators, such as GER, secondary dropout rate, transition rate, school and teacher resources, PTR, and PGI indicators. The comparison was used to identify different patterns across states. However, it does not establish a causal relationship between budget utilisation and educational outcomes, as local conditions and several other factors may influence these outcomes.
Keywords:
School Education, State Budget, Budget Utilisation, Budget Estimates, Actual Expenditure, Education Financing, Educational Outcomes, Performance Grading Index (PGI)
1. Introduction
Public spending on school education reflects the resources that governments plan to provide and support educational services. However, the amount provided in the budget may not always be the same as the amount actually spent during the financial year, and this difference can vary considerably across the states. Looking at the gap between the budgeted amount and actual expenditure therefore provides an important basis for understanding how school education budgets are implemented. Looking only at the amount allocated may not provide a complete picture, as the extent to which the planned resources are actually utilised also needs to be considered.
In India, School education is financed through state expenditure as well as Central assistance. At the same time, states differ in their financial capacity, spending priorities, resource availability, and dependence on central transfers. Their ability to implement education programmes can also vary, which may affect the extent to which budgeted resources are converted into actual expenditure. This study examines school education expenditure for elementary and secondary education over the three financial years 2022–23, 2023–24, and 2024–25. The analysis considers Budget Estimates (BE) as the amount initially planned and Actual Expenditure (AE) as the expenditure recorded during implementation. It focuses on revenue expenditure under the relevant elementary and secondary education heads and covers the post-COVID recovery period.
In this study, the Budget–Expenditure Gap is examined through budget utilisation, as comparing the absolute difference between BE and AE across states may not provide a common basis because the size of state budgets varies considerably. The Budget Utilisation Rate therefore provides a comparable way of looking at how closely actual expenditure follows the budget estimate, while the three-year utilisation trend is used to classify states according to their expenditure patterns. The study then examines state financial capacity, education priority and Central assistance as factors associated with differences in utilisation, while educational outcomes and the Performance Grading Index (PGI) are considered to understand the broader performance of the states included in the analysis. The primary concern addressed in this study is the difference between the amount budgeted for school education and the amount actually spent. This difference varies across states and can also change over time. A state may remain close to its budget estimate, move towards better utilisation, experience a continuous expenditure shortfall, or repeatedly spend more than its budget estimate. Therefore, looking at only one financial year may not fully capture the broader pattern of budget utilisation.
However, utilisation trends can also change within the same state across financial years, and these changes may be associated with differences in budget components, fund flows, and the release of Central assistance. Therefore, understanding the Budget–Expenditure Gap requires not only comparing states but also examining how utilisation changes over time within a state and what factors may be associated with these changes.
Previous research has examined public expenditure on education, inter-state disparities, Centre–State financing, fund utilization, and educational outcomes from different perspectives. However, there remains limited recent and systematic evidence comparing Budget Estimates and Actual Expenditure in school education across Indian states over a common period, particularly when differences in utilisation are examined alongside the financial and educational conditions of states.
This study addresses this gap by comparing BE, AE, Budget–Expenditure Gap, and Budget Utilisation Rates across the three financial years. Based on their utilisation patterns, states are classified into categories such as optimal utilisation, converging towards optimal utilisation, diverging from optimal utilisation, persistent under-utilisation, and persistent over-utilisation. The study further examines these patterns alongside state financial capacity, education priority, Central assistance, and selected educational resources and outcomes.
This study is significant because it looks beyond the amount allocated to school education and focuses on how effectively the allocated resources are actually utilised. Understanding these differences is important for identifying gaps in budget planning, fund utilisation, and implementation across states. The study also brings together financial capacity, education priority, Central assistance, and educational indicators, which can help provide a broader understanding of the factors associated with differences in budget utilisation. This can be useful for policymakers and administrators to improve the planning, implementation, and monitoring of school education expenditure.
This study aims to examine the gap between what is budgeted for school education and what states actually spend, with a focus on elementary and secondary education. It compares Budget Estimates and Actual Expenditure for 2022–23, 2023–24, and 2024–25 to examine variations in utilisation across states. It also aims to identify different patterns of budget utilisation and compare selected states on the basis of their financial capacity, education priority, Central assistance, and educational indicators. Where comparable data are available, indicators such as Gross Enrolment Ratio, dropout rate, pupil–teacher ratio, and transition rate are also considered to examine the broader context associated with differences in utilisation.
The main contribution of the study is that it does not focus only on how much states allocate for school education. It goes further by examining the movement from Budget Estimates to Actual Expenditure and identifying differences in utilisation across states over a common and recent period. These differences are then studied alongside financial capacity, education priority, Central assistance, and selected educational indicators. In this way, the study looks not only at how much states spend on education, but also at how much of what they budget is actually converted into expenditure and what these differences indicate about the implementation of school education financing at the state level.
The paper is organised into sections covering the literature review, research methodology, data analysis and interpretation, findings, discussion, and conclusion. The literature review presents the existing research and identifies the research gap, while the methodology explains the data sources, variables, and analytical approach used in this study. The sections that follow present and discuss the findings from the state-level analysis before concluding with the major observations and implications of this study.
2. Literature Review
Public expenditure is a central instrument for expanding access to education, improving educational infrastructure, and supporting better educational outcomes. However, the effectiveness of public financing cannot be assessed only by examining the amount allocated to education. The difference between the budgeted allocation and actual expenditure provides an important indication of how effectively allocated resources are utilized across states. A persistent or substantial gap may indicate challenges in translating planned financial commitments into actual spending on education programmes, making it important to examine the factors associated with differences in budget utilization. The way resources are distributed across states, released through different financing mechanisms, actually utilized, and converted into educational inputs and outcomes is equally important. In India, this issue is particularly relevant because school education is financed through a combination of state expenditure, central transfers, and centrally sponsored schemes, resulting in considerable variations in educational spending across states. Existing research has examined these issues from different perspectives, including inter-state differences in expenditure, per-student resource availability, budgetary allocation, fund utilization, Centre–State financing, and the relationship between expenditure and educational outcomes. The literature can be divided into four interconnected themes: (i) inter-state disparities in school education expenditure, (ii) the transition from budget allocation to actual utilization, (iii) Centre-State financing and institutional factors influencing resource utilization, and (iv) expenditure efficiency and educational outcomes.
2.1. Public Expenditure and Inter-state Disparities in School Education
A considerable body of research shows that public expenditure on education varies significantly across Indian states, both in absolute terms and in relation to state economic capacity. Guleria et al. (2025) use Union Budget and Ministry of Education data to examine the composition of public education expenditure. They find that elementary and secondary education account for significant shares of overall education spending, while many major states continue to spend less than the national average relative to GSDP. Their analysis provides a recent overview of the distribution of education expenditure but remains largely descriptive and does not examine the extent to which allocated resources are subsequently utilized. Singh (2019) similarly compares trends in public expenditure with particular attention to school education and examines indicators such as expenditure relative to GDP/GSDP, per-child expenditure, and per-student expenditure. His analysis also distinguishes elementary and secondary education, providing a useful basis for comparing the financial priority given to different levels of schooling.
The existence of inter-state disparities becomes clearer when expenditure is adjusted for the student population. Dongre et al. (2014) estimated public expenditure per student in elementary education across major states and demonstrated substantial differences in the resources available per government school students. Their methodology also shows that state budget figures require careful compilation because expenditures may be distributed across different departments and centrally sponsored schemes. Patil et al. (2022) revealed continuous inter-state variations in per-capita education expenditure, with smaller states generally spending more and many major states spending less. Mehta et al. (2025) broadened this perspective by examining inter-state disparities in education spending using indicators such as the coefficient of variation, Gini coefficient, and Lorenz curve.
Collectively, these studies show that the level and distribution of education spending vary greatly between states. Thus, differences in expenditure levels need to be distinguished from differences in budget utilization, as a higher allocation does not necessarily imply more effective execution of the education budget.
2.2. Budget Allocation to Actual Expenditure and Fund Utilization
The literature on education financing increasingly indicates that budget allocation, fund release, and actual utilization represent different stages of the financing process.
This distinction is particularly important for understanding whether a large education budget translates into resources that are actually available for implementation. Singh (2019) provides an important starting point by comparing Budget Estimates with Actual Expenditure in school education. The study demonstrates that actual expenditure can diverge from initial budget estimates and therefore suggests that the size of the allocation alone is insufficient to assess government spending. However, its BE- Actual comparison is primarily located at the central level and does not provide a systematic recent state-level analysis of the expenditure gap.
A more direct examination of the financing process is provided by Khanna (2021) in her analysis of Samagra Siksha. Using eight states for 2018-19 and 2019-20, the study compares proposed, approved, released, and utilised funds and finds considerable differences in utilisation across states and between years. It also identifies delayed fund disbursement, coordination problems, and under-allocation as possible contributors to under-utilisation. Although the institutional context differs, evidence from other countries also helps explain the distinction between budget allocation, fund release, and actual utilisation. Hassan et al. (2025) similarly distinguish between allocated and released budgets in their study of secondary schools in Nigeria. Their analysis finds that released funding is more consistently associated with student performance than allocation alone, reinforcing the importance of examining the resources that actually become available for implementation.
Indian financing literature also provides evidence that the movement of funds can be constrained by institutional arrangements. Mehrotra (2012) discusses the financing requirements of elementary education and documents the differences between allocated and released SSA resources in educationally backward states. De and Endow (2008) examine the mechanism of resource sharing, allocation, and utilisation between the centre and states and emphasise the changing role of centrally sponsored schemes.
Together, these studies suggest that the relevant unit of analysis is not merely the education budget but the entire process through which an allocation becomes actual expenditure. Yet, recent systematic evidence comparing this process across Indian states remains limited. This provides a direct foundation for examining the Budget Estimates-Actual Expenditure gap and utilisation rate in school education.
2.3. Centre–State Financing and Factors Associated with Differences in Budget Utilization
Differences in education expenditure and utilisation cannot be interpreted independently of India’s federal financing structure. Because school education involves both state and central financing, the availability and timing of central transfers can influence the resources that states can deploy to schools. Bose et al. (2020) examined this relationship using aggregate time-series and state-level panel models covering 28 states. Their analysis finds that central grants under Sarva Shiksha Abhiyan and the thirteenth finance commission generally complemented rather than displaced state spending on elementary education, although the effect varied across groups of states. Therefore, this study demonstrates that inter-state differences in education financing are partly connected to differences in fiscal capacity and dependence on central transfers.
This financing relationship is also evident in De and Endow (2008), who examine the division of education finance between the Centre and states and the role of centrally sponsored schemes in transferring resources to states. Their analysis shows that the centre became increasingly important in financing education even though States remained major contributors to education expenditure. Khanna (2021) adds an implementation perspective by showing that approved resources may not necessarily translate into funds released and utilised at the state level. The study’s comparison of proposed, approved, and released and utilised amounts highlights the importance of administrative coordination and fund-flow mechanism in determining actual utilization.
The issue of fiscal capacity is also relevant to the distribution of educational resources. Mehrotra (2012) emphasizes the financing responsibilities of the central and state governments in meeting the requirements of elementary education and highlights the fiscal pressures faced by states in implementing national education commitments.
Dongre et al. (2014) similarly pointed out that poorer states’ lower expenditure can be related to their smaller resource base and larger school-age populations, while centrally sponsored schemes were intended to partly address these constraints.
Overall, the literature indicates that utilisation differences may reflect not only state-level spending priorities but also fiscal capacity, central transfer, and administrative fund-flow mechanisms. However, these aspects have often been researched individually from a direct state level Budget – Actual Expenditure framework. Examining utilisation alongside the financing environment can therefore provide a more complete explanation of inter-state differences.
2.4. Education Expenditure, Efficiency and Educational Outcomes
The final strand of the literature considers whether higher public expenditure necessarily produces better educational outcomes. This question is important because a state with a high utilization rate cannot automatically be considered more effective if the resources spent do not improve educational access, retention, infrastructure, or learning. Iyer (2009) examines public expenditure and educational outcomes across 115 districts in Uttar Pradesh, Andhra Pradesh, and Karnataka using regression and fixed-effects approaches. The results show that expenditure per student does not have a uniform effect on enrolment, transition rates, or examination performance. Some positive relationships emerge in particular states, suggesting that the effectiveness of expenditure depends on local characteristics rather than following a uniform national pattern.
Dongre et al. (2014) obtained similar results in their study. Although they discovered a strong relationship between per-student public expenditure and learning levels, they cautioned that simply increasing expenditure may not improve learning because public funds may be spent inefficiently in some cases. Hassan et al. (2025) provided new data from secondary schools in Nigeria. Their OLS findings indicate that released funding correlates with greater pass rates. However, their stochastic frontier analysis reveals major inefficiencies in the conversion of revenue into educational performance.
The Indian evidence also suggests that financial inputs need to be considered alongside the allocation and distribution of resources. De and Endow (2008) find that increased expenditure in less-developed states was associated with improvements in access, while retention and learning outcomes remained weak. Jhingran and Sankar (2009) similarly show that disadvantaged districts received proportionately greater resources under elementary education programmes, which contributed to improvements in access, infrastructure, and teacher availability, while also identifying a disconnect between actual investment needs and annual allocations.
Thus, educational outcomes provide an additional dimension for interpreting the differences in budget utilization. However, the primary focus remains on understanding the extent and factors associated with inter-state differences in budget execution.
2.5. Literature Summary
Across the four themes, the literature establishes a consistent but multidimensional picture of education financing in India. First, there are substantial differences across states in the level and distribution of public expenditure on education. Studies using aggregate, per-capita, and per-student measures indicate that states do not have equal financial resources available for school education. Second, the literature shows that budget allocation, fund release, and actual utilization are distinct stages.
Evidence from India and the international context indicates that resources may be reduced, delayed, or incompletely utilized between the initial allocation and final expenditure. Third, Centre–State financing arrangements and differences in fiscal capacity can influence the resources available to states and their ability to implement education programmes. Finally, the evidence does not support the simplistic assumption that increased spending always results in greater educational performance. Instead, it appears that the effectiveness of expenditure is determined by how resources are allocated and employed, as well as the institutional framework in which they are implemented.
2.6. Research Gap
Despite these contributions, existing research fails to adequately address a crucial empirical topic. Much of the Indian literature has focused on the amount of education spending, inter-state disparities, per-student spending, Centre-State transfers, or expenditure-outcome relationships, whereas studies that look at fund utilization are frequently limited to specific schemes, states, older periods, or stages of the financing process. Khanna (2021)’s analysis, for example, gives useful information on requested, approved, released, and utilized funds, although it only covers a few states and the early years of Samagra Shiksha. Similarly, Singh’s (2019) Budget Expenditure-Actual comparison is a good assessment methodology, but it does not include a recent, systematic state-level comparison of school-education budget execution.
2.7. Contribution
The current study seeks to broaden the literature by investigating the Budget-Expenditure Gap in Indian School Education, with an emphasis on elementary and secondary education. Using comparable secondary data from recent fiscal years, the study will compare budget estimates, actual expenditure, the expenditure gap, and budget-utilization rates per state. States can then be compared to determine which have relatively high and low utilization rates, followed by a study of the financial, administrative, and educational contexts of selected states. Where comparable data are available, the study will investigate whether disparities in budget use are related to indicators such as enrolment, dropout rate, teachers, and school infrastructure. The contribution is thus not simply comparing how much states spend, but how much of the resources they budget are actually transformed into expenditure and what this may imply for the effectiveness of school-education financing.
2.8. Literature Review Framework
2.8.1. Thematic Structure
|
Theme |
Papers / Authors |
Main Evidence |
What the Theme Shows |
|
1. Public Education Expenditure and Inter-state Differences |
Singh (2019); Dongre et al. (2014); Guleria et al. (2025); Patil et al. (2022); Mehta et al. (2025) |
Studies show substantial differences across Indian states in total, per capita, and per-student education expenditure. Singh also distinguishes between elementary and secondary expenditure, while Dongre et al. show that expenditure needs to be carefully constructed using multiple sources. |
Education financing is highly unequal across states, but expenditure levels alone do not tell us whether the allocated resources are actually utilized. |
|
2. Budget Allocation, Fund Release and Expenditure Utilization |
Singh (2019); Khanna (2021); Hassan et al. (2025); Mehrotra (2012); De & Endow (2008) |
Singh compares Budget Estimates with Actual Expenditure. Khanna examines proposed, approved, released and utilized funds under Samagra Shiksha. Hassan distinguishes allocated and released funding and links released resources with outcomes. Mehrotra and De & Endow discuss fund release, allocation and utilization issues. |
Budget allocation, fund release, and actual expenditure are different stages; a higher allocation does not necessarily mean higher utilization. This is the closest theme to our research gap. |
|
3. Centre –State Financing and Factors Affecting Utilization |
Bose et al. (2020); Khanna (2021); De & Endow (2008); Mehrotra (2012); Dongre et al. (2014) |
Central grants, state fiscal capacity, financing arrangements, and administrative/fund-flow mechanisms influence education financing. Bose et al. find that central grants generally complement state education spending. Khanna highlights the differences between approved, released, and utilized funds. |
Differences in utilization may reflect not only state spending priorities but also fiscal capacity, central transfers, fund-release mechanisms, and administrative implementation. |
|
4. Education Expenditure, Efficiency and Educational Outcomes |
Iyer (2009); Hassan et al. (2025); Dongre et al. (2014); De & Endow (2008); Jhingran & Sankar (2009) |
Evidence shows that higher expenditures do not automatically produce better outcomes. Iyer finds mixed expenditure–outcome relationships; Hassan finds a positive role of released funding but also substantial inefficiency; and Dongre et al. find an association between expenditure per student and learning but caution about efficiency. |
The effectiveness of education spending depends not only on the amount spent but also on how efficiently resources are utilized and converted into educational outcomes. |
2.8.2. Research Gap
|
Research Gap Question |
Explanation |
|
What is already known? |
Existing studies have established substantial inter-state differences in educational expenditure. They also show that budget allocation, fund release, and actual utilization are distinct stages of educational financing. Research further indicates that Centre–State financing, fiscal capacity, and implementation mechanisms can affect education spending, while higher expenditure does not automatically guarantee better educational outcomes. |
|
What is still debated / unclear? |
The reasons for the change in budget utilisation trends within the same state across financial years and the possible reasons for central-state fund transfer issues are not sufficiently explained. |
|
What is missing? |
A recent, systematic state-level comparison of Budget Estimates and Actual Expenditure in Indian school education, particularly covering elementary and secondary education over a common period, along with an examination of the financial, fiscal, and administrative factors associated with differences in utilization. |
|
How will our study address this? |
This study categorises states based on three years’ utilisation trends and uses resource person insights to identify possible reasons behind these trends and areas requiring further component-level examination, including the reason for central- state fund transfer issues. |
3. Research Methodology
3.1. Research Design
This study used a mixed-methods and comparative case study research strategy. The quantitative component was the main focus of the study and examined the difference between Budget Estimates (BE) and Actual Expenditure (AE) for school education in Indian States across three financial years: 2022-23, 2023-24, and 2024-25.
Based on budget utilisation trends, states were classified as optimal utilisation, converging towards optimal utilisation, diverging from optimal utilisation, persistent under-utilisation, and persistent over-utilisation. Selected states from various categories were then compared using state financial capacity, educational priority, central assistance, and educational outcomes. In addition, Pearson’s correlation coefficient was used to examine the linear association between budget utilisation and selected educational outcome indicators among the five states.
For this analysis, the 2024-25 budget utilisation rate was compared with selected educational outcomes for 2024-25. Correlation analysis was used to only identify the direction and strength of association and was not interpreted as evidence of causality.
A semi-structured interview with a relevant resource person provided additional information about inter-state variations in utilisation trends, fiscal capacity, centre-state relations, and educational outcomes.
3.2. The Nature of Research
The study was empirical, comparative, and mixed-method in nature. Its primary analysis was quantitative and was based on secondary data, such as budget estimates and actual expenditures. The comparison component examined differences in expenditure patterns and selected variables among the shortlisted states.
The quantitative component also included a Pearson correlation analysis to examine the association between budget utilisation and selected educational outcome indicators. The qualitative component complemented the quantitative analysis by providing a resource person perspective on issues that were not fully clarified by the numerical data alone.
3.3. Sample and Its Technique
The universe of the study comprised Indian states. The analysis used available and comparable secondary data on Budget Estimates and Actual Expenditure for the selected three financial years. States were assessed on the basis of the gap between the budget estimate and actual expenditure as a research phenomenon, utilisation as an operationalisation factor, classified based on utilisation trends, and risk factors examined by volatility.
States representing different expenditure patterns were then shortlisted for detailed comparison. Five states were selected as case studies, representing different budget utilisation patterns identified through the classification. These states were examined comparatively in terms of financial capacity, educational priority, central assistance, and educational outcomes. For the correlation analysis, the budget utilisation and educational outcomes variables for these five states were taken for 2024–25.
The resource person participant for the semi-structured interview was purposively selected based on relevant experience in state finance, education policy, centre-state relations, and educational outcomes.
3.4. Data Collection Tool
The study primarily used secondary data from publicly available official sources; Budget Estimate data were collected from the State Budget Demand for Grants and relevant education department budget documents, where applicable. Actual Expenditure data were obtained from CAG State Finance Accounts and cross-checked with relevant available state budget documents. Educational outcome indicators were drawn from UDISE+ and PGI, while fiscal indicators were collected from Finance Commission reports, Sansad documents, and other relevant official sources.
Excel was used for data compilation and analysis, and tables and charts were prepared using Excel. The compiled data were also used to calculate the Pearson correlation coefficient for the five shortlisted states using Excel and to organize the resulting correlation analysis.
3.5. Variables Used
The quantitative analysis focused on revenue expenditures for Major Head 2202: Sub-major heads 2202-01 (Elementary Education) and 2202-02 (Secondary Education). The primary factors were budget estimates and actual expenditures. The following indicators were computed:
- Budget Gap = Budget Estimate – Actual Expenditure
- Budget Utilisation Rate = (Actual Expenditure / Budget Estimate) *100
- Trend: changes in utilisation across the three financial years.
- Volatility: extent of fluctuation in utilisation during the study period.
For comparative analysis, Gross Enrolment Ratio, Dropout Rate, Pupil–Teacher Ratio, Transition Rate, Central Assistance, Impact of Debt to GSDP of the states, and Horizontal Devolution were considered, subject to data availability. The qualitative analysis focused on inter-state variations in school budget utilisation and trends, fiscal capacity, centre-state relations, and educational outcomes.
Pearson’s correlation coefficient (r) was calculated to examine the direction and strength of the linear association between budget utilisation and selected educational outcome indicators. The utilisation variable was represented by FY 2024-25. The educational outcome variables considered for the correlation analysis included the PGI Score, PGI Learning Outcomes, Secondary Gross Enrolment Ratio (GER), Secondary Dropout Rate, and Transition Rate for 2024-25.
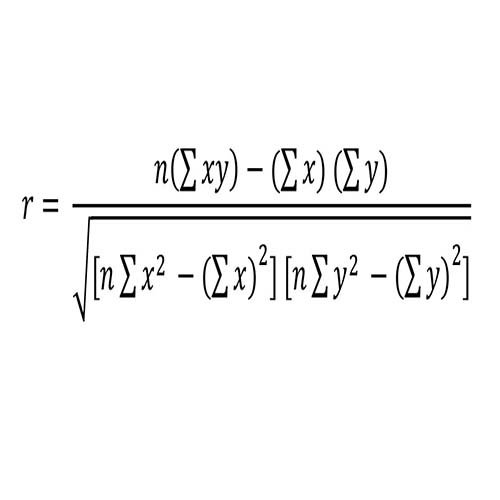
Where:
r = Pearson correlation coefficient
n = number of observations
x = budget utilisation rate
y = educational outcome indicator
∑ xy= sum of the products of corresponding x and y values
∑ x2 = sum of squared x values
∑ y2 = sum of squared y values
The value of r ranges from -1 to +1, where the sign indicates the direction of the linear association and the absolute value indicates its strength. Since the number of observations (n = 5) is small, the correlation results are treated as exploratory and are not used to establish causal relationships between budget utilisation and educational outcomes.
3.6. Analytical-framework
This study analyzes budget utilisation along with state financial capacity, education priority, central assistance, and selected educational outcomes. Budget utilisation is measured by comparing budget estimates and actual expenditures. State financial capacity is examined through selected fiscal indicators, and education priority is examined through the share of education expenditure in the state budget.
Central assistance is considered to understand the role of Union government funding in state education financing. Educational outcomes are examined using indicators such as Gross Enrolment Ratio (GER), dropout rate, transition rate, school and teacher resources, Pupil–Teacher Ratio (PTR), and PGI indicators.
This analysis evaluates financial and educational indicators across a selection of states to identify trends that impact educational outcomes. It does not establish a cause-and-effect relationship between budget allocation and educational outcomes, as many other factors could impact both the use of funds and the resulting outcomes.
3.7. Ethical Considerations
This study relied on publicly available financial, budgetary, and educational data. All sources were properly cited and used only for academic purposes. The resource person interview was conducted with the participant’s consent, and confidentiality was maintained as required.
4. Data Analysis and Interpretation
4.1. State – Level Budget – Utilisation Patterns
Across India’s 28 states, school education utilisation shows wide heterogeneity. The three-year trends (FY 2022–23 to 2024–25) in budget gaps and utilisation reveal diverse and mixed patterns across states. During FY 2022–23, several states recorded expenditure above their budget estimates, reflecting substantial variation in budget utilisation during the post-pandemic period. In the subsequent years, some states moved towards optimal utilisation, while others continued to experience persistent under-utilisation, over-utilisation, or declining expenditure performance. According to the resource person, differences between Budget Estimates and Actual Expenditure may also arise when Central assistance expected for specific schemes is not released as anticipated. The resource person further noted that the exact reasons may differ across budget components and therefore require a component-wise examination (refer Appendix B). Table 1 presents the state-wise gap between budget estimates and actual expenditure, along with utilisation trends over the three-year period. Figure 1 illustrates the classification of states based on their utilisation patterns.
The Optimal Utilisation‖ category includes Punjab and Uttarakhand, which maintained expenditure relatively close to their budget estimates over the study period. Punjab recorded utilisation of approximately 102% in FY 2022–23, followed by a decline in FY 2023–24 and a recovery to around 97% in FY 2024–25. Uttarakhand maintained relatively stable utilisation, recording approximately 94% and 98% in the first two years and reaching 100.79% in FY 2024–25. The resource person explained that states such as Punjab and Uttarakhand have historically given importance to education and have relatively strong social and educational conditions (refer Appendix B).
The —Converging towards optimal utilisation‖ states like Kerala and Jharkhand were moving from under-utilisation (<90%) to optimal utilisation (>95%). Gujarat and Himachal Pradesh were moving from over-utilisation (>110%) to optimal-utilisation (>95%). Haryana maintained moderate utilisation, then declined and subsequently recovered (92%, 84%, 94%). Most of the states fall within the —Diverging from Optimal Utilisation‖ category. The States like Andhra Pradesh and Sikkim are consistently declining from >95% but not <90%. Nagaland moved from optimal utilisation (96%–99%) to over utilisation (>105%).
Table 1:
State Budget Utilisation patterns, and Volatility
|
No. |
State |
Utilization % |
Overall Trend |
Category |
Volatility (Umax-Umin) |
||
|
2022-23 |
2023-24 |
2024-25 |
|||||
|
1 |
Andhra Pradesh |
97.45 |
94.65 |
92.20 |
Consistent Decline |
C |
5.24 |
|
2 |
Arunachal Pradesh |
118.82 |
99.72 |
88.28 |
Improved then Decline |
C |
30.53 |
|
3 |
Assam |
100.29 |
110.40 |
114.24 |
Consistent Over-utilization |
E |
13.95 |
|
4 |
Bihar |
109.61 |
103.24 |
108.60 |
Consistent Over-utilization |
E |
6.37 |
|
5 |
Chhattisgarh |
92.58 |
102.04 |
89.82 |
Decline |
C |
12.22 |
|
6 |
Goa |
85.18 |
83.14 |
83.32 |
Consistent Under-utilization |
D |
2.03 |
|
7 |
Gujarat |
116.97 |
104.28 |
96.50 |
Strong Improvement |
B |
20.47 |
|
8 |
Haryana |
92.23 |
84.38 |
94.04 |
Declined Then Recovered |
B |
9.66 |
|
9 |
Himachal Pradesh |
113.27 |
100.12 |
97.61 |
Strong Improvement |
B |
15.66 |
|
10 |
Jharkhand |
89.93 |
85.10 |
97.95 |
Strong Improvement |
B |
12.85 |
|
11 |
Karnataka |
101.16 |
90.75 |
82.21 |
Consistent Decline |
C |
18.95 |
|
12 |
Kerala |
88.26 |
92.84 |
99.24 |
Strong Improvement |
B |
10.98 |
|
13 |
Madhya Pradesh |
110.43 |
115.39 |
118.00 |
Consistent Over-utilization |
E |
7.57 |
|
14 |
Maharashtra |
NA |
106.04 |
93.34 |
Decline |
C |
12.69 |
|
15 |
Manipur |
115.17 |
NA |
77.35 |
Strong Decline |
C |
37.82 |
|
16 |
Meghalaya |
133.79 |
114.75 |
88.93 |
Improved then Decline |
C |
44.86 |
|
17 |
Mizoram |
95.55 |
93.79 |
82.21 |
Strong Decline |
C |
13.34 |
|
18 |
Nagaland |
98.65 |
96.63 |
105.63 |
Consistent Decline |
C |
8.99 |
|
19 |
Odisha |
99.01 |
97.46 |
88.84 |
Strong Decline |
C |
10.17 |
|
20 |
Punjab |
102.22 |
90.53 |
97.21 |
Good utilization |
A |
11.69 |
|
21 |
Rajasthan |
92.11 |
87.72 |
86.16 |
Strong Decline |
C |
5.95 |
|
22 |
Sikkim |
96.18 |
93.68 |
92.80 |
Consistent Decline |
C |
3.38 |
|
23 |
Tamil Nadu |
104.06 |
97.22 |
86.56 |
Strong Decline |
C |
17.49 |
|
24 |
Telangana |
121.88 |
118.18 |
122.23 |
Consistent Over-utilization |
E |
4.05 |
|
25 |
Tripura |
62.06 |
71.25 |
76.48 |
Consistent Under-utilization |
D |
14.42 |
|
26 |
Uttar Pradesh |
83.32 |
78.67 |
81.61 |
Consistent Under-utilization |
D |
4.65 |
|
27 |
Uttarakhand |
93.70 |
98.30 |
100.79 |
Good utilization |
A |
7.09 |
|
28 |
West Bengal |
113.65 |
103.34 |
90.89 |
Improved then Decline |
C |
22.75 |
Note. Authors’ calculations based on Budget Estimates and Actual Expenditure compiled from State Budget documents and CAG State Finance Accounts, Volume II. Supporting data are presented in Appendix A, Tables A1-A3. See the data sources in Appendix C.
Karnataka, Odisha, Mizoram, and Tamil Nadu moved from optimal-utilisation (>95%) to under utilisation (<90%). Arunachal Pradesh, Manipur, and Meghalaya moved from extreme over utilisation (>115%) to under utilisation (<90%). West Bengal moved from extreme over utilisation (>113%) to nearly 90%.
The —Persistent Under-utilisation‖ category includes Goa and Uttar Pradesh, which remained below the optimal utilisation range throughout the study period, with utilisation ranging from approximately 78% to 86%. Tripura recorded even lower utilisation, ranging from approximately 62% to 77%, indicating persistent extreme under-utilisation.
Bihar recorded over-utilization ranging from approximately 103% to 110% during the study period. Assam and Madhya Pradesh recorded higher levels of over-utilisation, ranging from approximately 110% to 120%, whereas Telangana showed the highest level, ranging from approximately 118% to 123%.
Figure 1
Classification of States Based on Budget Utilisation Trends
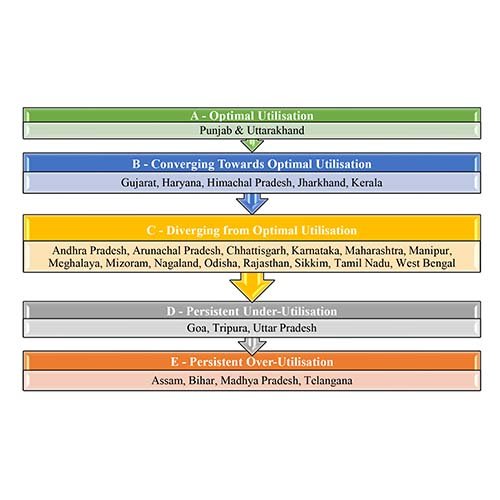
Note. Authors’ classification based on three-year utilisation trends. The data are presented in Table 1.
One representative state from each category—Punjab, Kerala, Tamil Nadu, Uttar Pradesh, and Bihar—was selected for further comparative analysis (Figure 2). These five states were selected to represent each category through a category-based case selection.
Figure 2
Case-study States Trend
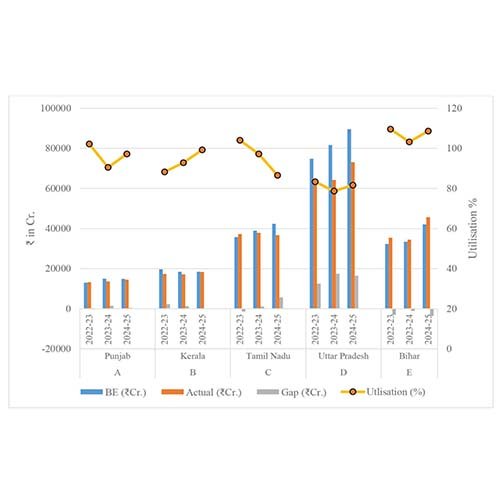
Note. Authors’ calculations based on Budget Estimates and Actual Expenditure compiled from State Budget documents and CAG State Finance Accounts, Volume II. Supporting data are presented in Appendix A, Tables A1-A3. See the data sources in Appendix C.
4.2. State Financial Capacity and Educational Priority
The financial positions of the five selected states differ across the indicators considered. Tamil Nadu had the lowest debt-to-GSDP ratio at 30.3%, whereas Punjab recorded the highest ratio at 46.6%, showing a relatively higher debt burden. As the resource person pointed out, a high debt-to-GSDP ratio alone does not indicate poor performance. The utilisation of borrowed resources and the state’s broader economic and borrowing capacity also need to be considered (refer Appendix B). A similar difference was observed in the fiscal deficit, which was highest in Punjab at 4.81% and lowest in Uttar Pradesh at 2.06%. Uttar Pradesh also received the largest share of horizontal devolution (17.939%), followed by Bihar (10.058%), while the remaining states received comparatively smaller shares. When these indicators are viewed together with budget utilisation, the pattern suggests that the financial position of a state is shaped by more than one factor. Debt levels, fiscal deficits, access to devolved resources, and the ability to utilize available funds together provide a broader picture of state financial capacity (refer Figure 3).
Figure 3
State Financial Capacity
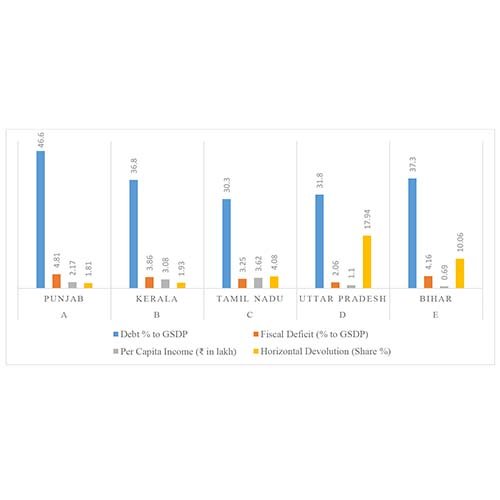
Note. Authors’ compilation and calculations based on Sansad documents, MoSPI sources, 15th Finance Commission reports, and CAG State Finance Accounts, Volume I. Supporting data are presented in Appendix A, Table A4. See the corresponding sources in the reference list for details.
Educational priorities also differed among the five selected states. Bihar allocated a relatively higher share of its total state expenditure to school education (18.12%), followed by Uttar Pradesh (12.51%), while Tamil Nadu’s compiled estimate was 8.55%. The resource person explained that the states in Categories A, B, and C had made substantial progress in school education over time and were now able to devote relatively lower shares of their overall state expenditure to school education. In contrast, Uttar Pradesh and Bihar are still addressing broader developmental and educational requirements, with larger and school-going populations creating a greater demand for public resources. In terms of total expenditure, Uttar Pradesh spent the largest amount on school education, which is also linked to the size of its student population. However, higher overall expenditure does not necessarily translate into higher spending per student. Tamil Nadu recorded the highest per-student expenditure among the states for which comparable figures were available, at approximately ₹56,682.90. This was followed by Punjab at ₹50,867.54, Kerala at ₹41,824.15, Uttar Pradesh at ₹37,686.65, and Bihar at ₹26,437.10. Therefore, the comparison shows that education priority can be viewed not only through the total amount spent, but also through the share of state expenditure devoted to education and the resources available per student (Figure 4).
Figure 4
Education Priority
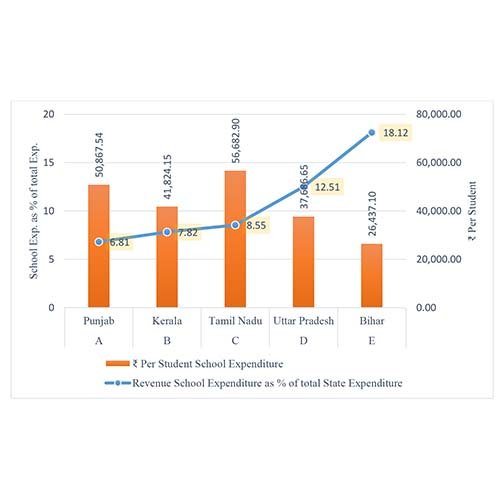
Note. Authors’ calculations based on CAG State Finance Accounts, Volumes I and II, and UDISE+ 2024-25. Supporting data are presented in Appendix A, Table A5. See the data sources in the reference list and Appendix C.
4.3. Central Assistance
The analysis of Central Assistance under three schemes for school education shows significant variations in scheme implementation across states.
Under Samagra Shiksha for FY 2024–25, the amount of central assistance released varied considerably across the selected states. Uttar Pradesh received the highest amount of ₹6,264.79 crore, followed by Bihar at ₹4,217.81 crore, and Punjab at ₹678.13 crore. The available data recorded no central release for Tamil Nadu and Kerala during the considered period.
Under the PM Poshan scheme for FY 2024-25, Uttar Pradesh received ₹1,224.64 crore, Bihar received ₹1,225.66 crore, Tamil Nadu received ₹442.58 crore, Kerala received ₹240.67 crore, and Punjab received ₹164.07 crore. UP and Bihar are the highest beneficiaries of the scheme. Tamil Nadu receives the highest per-beneficiary amount compared to UP and Bihar. Kerala’s pattern of central assistance reflects scheme-specific differences. The issue was not related to PM POSHAN. Rather, it was associated with the implementation of PM SHRI and its linkage with the broader NEP 2020 framework. According to the Union Minister, Kerala had agreed to sign the PM SHRI MoU but did not proceed with the scheme because of internal differences within the ruling alliance. The availability of central assistance under different schemes should therefore be interpreted separately rather than treated as a uniform pattern of funding (The Hindu Bureau, 2025).
Under the PM SHRI scheme, differences were also observed in the timing of state participation. Punjab and Uttar Pradesh joined the scheme earlier, followed by Bihar in March 2024. Kerala joined later, while Tamil Nadu had not joined the scheme during the period considered for the analysis. The resource person further explained that education falls under the Concurrent List, which creates a shared role for the Centre and the states in education policy and financing (refer Appendix B). Differences may therefore arise when states have different spending priorities or reservations regarding conditions attached to centrally supported schemes.
Overall, the comparison indicates that the amount of central assistance received differs across states and schemes. These differences need to be interpreted alongside the scale of the school system, scheme participation, timing of fund releases, and the utilisation of available resources (refer Figure 5).
Figure 5
Central Assistance
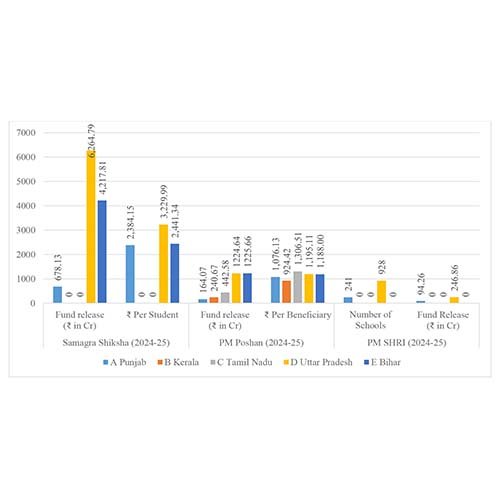
Note. Authors’ compilation and calculations based on Sansad documents, UDISE+ 2024-25, official PM Poshan documents, PIB, and official PM SHRI sources. Supporting data are presented in Appendix A, Table A6. See the corresponding sources in the reference list.
4.4. Educational Outcomes, Resources and the PGI
In terms of Gross Enrollment Ratio (GER), Kerala, among the five states, has the highest Secondary GER (98.7), followed by Tamil Nadu (95.5), Punjab (92.6), Uttar Pradesh (64.3), and Bihar (51.1). This comparison shows a broad association between relatively stronger utilisation patterns and higher GER across the selected states. However, such a clear picture does not emerge in the dropout rate parameter. In 2024–25, the secondary-level dropout rates were relatively close across the selected states, ranging from 4.8% in Kerala to 8.5% in Tamil Nadu. Punjab recorded a rate of 6.2%, Uttar Pradesh 7.0%, and Bihar 6.9% (refer Figure 6). The resource person noted that higher enrolment does not necessarily prevent secondary-level dropout, as some students may move towards vocational courses or employment, particularly in economically weaker households (refer Appendix B).
Figure 6
Education Access and Participation
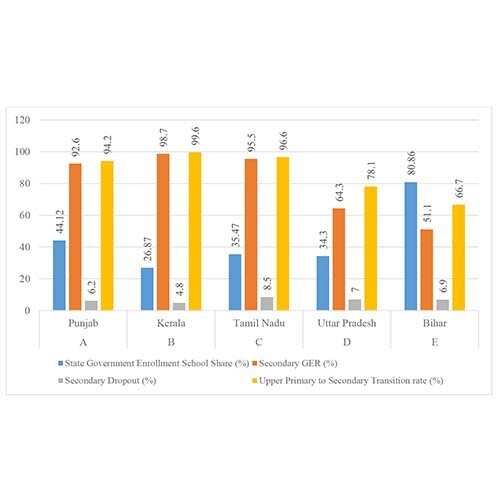
Note. Authors’ compilation based on UDISE+ 2024-25. Supporting data are presented in Appendix A, Tables A7 and A8. See the corresponding source in the reference list.
Another important indicator is the share of government schools in the states. In a low utilization state, such as Uttar Pradesh, the share is merely (52.28%), whereas that in Bihar is 80.90%, which could be one of the reasons for over-utilization.
The analysis also indicates that differences in pupil-teacher ratios (PTR) are not caused by the share of government schools but by staffing intensity among management categories. Bihar has the highest concentration of state government schools with relatively low staffing. In UP, government and state-run schools have similar staffing levels. However, government-aided schools play a small role in this regard.
On the other hand, Punjab compensates for its relatively low level of teacher staffing in government schools through increased staffing in the private sector. In Kerala, even though it has the smallest proportion of state government schools (30.16%), government and aided schools have almost similar staffing intensity. While Bihar and UP have issues with structural understaffing at the school level, Kerala’s lower (21) indicates that its publicly supported schools have greater staffing capacity (refer Figure 7).
Tamil Nadu has a larger number of state government schools; however, these schools have low staffing intensity compared to private schools. As the resource person pointed out, repeated expenditure above the budget estimate cannot be interpreted from the utilisation rate alone. Changes in individual budget components, including expenditure related to teacher recruitment and retirement, may also affect the final expenditure level (refer Appendix B).
Figure 7
School Resources and Teaching Capacity
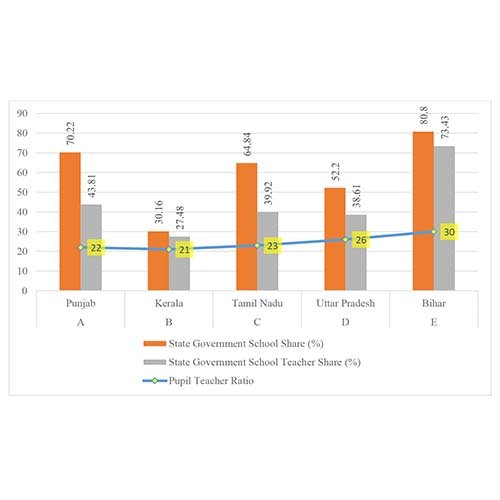
Note. Authors’ compilation based on UDISE+ 2024-25. Supporting data are presented in Appendix A, Tables A9 and A10. See the corresponding source in the reference list.
Additionally, a broad association can be observed between education expenditure utilisation and PGI score across some of the selected states; however, the relationship is neither uniform nor deterministic. For example, Punjab has shown optimal utilisation of revenue allocated for education, which is translated into its high score of 709, whereas Uttar Pradesh, even after showing a persistent-under utilisation, has a score of 569. However, Bihar remains an exception where, even with over utilisation year on year in education, the state has not translated the same into outcomes, as seen from the low PGI score of 507 (lowest of all five). This suggests that the amount of expenditure alone may be insufficient to improve educational outcomes; the efficiency, composition, and effectiveness of expenditure may also matter.
If we focus on the breakdown of the PGI score, we notice that for learning outcomes, while budget utilisation and impact on learning outcomes are related for Punjab and Kerala, for Tamil Nadu, the learning outcomes have been poor even with sufficient utilisation of resources. Interestingly, Uttar Pradesh and Bihar record higher learning outcome scores than Tamil Nadu despite persistently lower and over utilisation of the education budget. This suggests that factors beyond expenditure affect learning outcomes.
Figure 8
PGI Index Scores
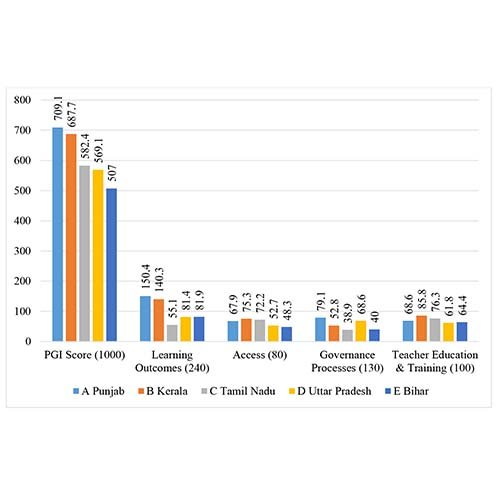
Note. Authors’ compilation based on PGI 2.0 2024-25. Supporting data are presented in Appendix A, Table A11. See the corresponding sources in the reference list.
The governance process indicates a weaker correspondence with overall PGI performance than might be expected. Punjab records the highest governance score among the selected states, while Tamil Nadu records the lowest, even though UP shows lower utilisation of budget. Teacher education and training is where Punjab has shown a gap in outcome, with a lower score than both Kerala and Tamil Nadu. The relatively stronger teacher training performance of Kerala is consistent with its comparatively strong learning outcomes, although the five-state comparison alone cannot establish a causal relationship between teacher training and learning outcomes (refer Figure 8).
The resource person noted that teacher capability is not fully captured by a single indicator. Therefore, indicators such as pupil–teacher ratio and teacher training should be considered alongside the individual components of the PGI when interpreting differences in educational outcomes (refer Appendix B).
The comparison shows differences between budget utilisation and educational outcomes across the selected states. Punjab and Kerala recorded relatively optimal and converging towards optimal utilisation along with high GER and transition rates. However, this pattern was not uniform. Bihar recorded over-utilisation but had lower GER and transition rates, whereas Tamil Nadu recorded diverging from optimal utilisation but relatively high values for these indicators. This suggests that utilisation alone cannot explain the differences in the educational outcomes.
4.5. Pearson Correlation Analysis: Budget Utilisation and Educational Outcomes
The analysis so far has compared budget utilization with individual educational indicators across the five selected states. To examine whether these variables move together in a measurable linear pattern, Pearson’s correlation coefficient (r) was calculated between the 2024–25 budget utilisation rate and each selected educational outcome.
The budget utilization rate for FY 2024–25 was treated as the explanatory variable, while the PGI Score, Secondary GER, Secondary Dropout Rate, Transition Rate, and PGI Learning Outcomes were treated as outcome variables (refer Table 2). As the analysis contains only five state-level observations, the correlations are exploratory and not evidence of causation or generalizable estimates for all the Indian states.
Table 2
Variables used for Pearson Correlation Analysis
|
State |
Utilisation (%) |
PGI Score |
Secondary GER (%) |
Secondary Dropout (%) |
Transition Rate (%) |
PGI Learning Outcomes |
|
Punjab |
97.21 |
709.1 |
92.6 |
6.2 |
94.2 |
150.4 |
|
Kerala |
99.24 |
687.7 |
98.7 |
4.8 |
99.6 |
140.3 |
|
Tamil Nadu |
86.56 |
582.4 |
95.5 |
8.5 |
96.6 |
55.1 |
|
Uttar Pradesh |
81.61 |
569.1 |
64.3 |
7 |
78.1 |
81.4 |
|
Bihar |
108.6 |
507 |
51.1 |
6.9 |
66.7 |
81.9 |
Note. Authors’ Utilisation calculations based on Budget Estimates and Actual Expenditure compiled from State Budget documents and CAG State Finance Accounts, Volume II. Educational outcomes compilation based on UDISE+ 2024-25.
Table 3
Results of Pearson Correlation Analysis, r and p-value
|
Indicator |
Pearson’s r |
p-value |
Interpretation |
|
PGI Score |
-0.019 (approx. -0.02) |
0.976 |
Negligible negative linear association |
|
Secondary GER (%) |
-0.225 |
0.716 |
Weak negative linear association |
|
Secondary Dropout (%) |
-0.447 (approx. -0.45) |
0.451 |
Moderate negative linear association |
|
Transition Rate (%) |
-0.280 |
0.649 |
Weak negative linear association |
|
PGI Learning Outcomes |
+0.377 (approx. 0.38) |
0.531 |
Moderate positive linear association |
Note. Authors’ calculations based on FY 2024–25 budget utilisation and the corresponding educational outcome data for the five selected states. The p-values are two-sided and reported for descriptive statistical inference.
The results show different directions and magnitudes of association across the indicators. The correlation between utilisation and the overall PGI Score is almost zero (r = −0.019), indicating nearly no linear association in this five-state sample. Secondary GER also showed a weak negative association (r = −0.225), while the transition rate showed a similarly weak negative association (r = −0.280). The strongest negative correlation in absolute terms is observed for the Secondary Dropout Rate (r = −0.447). Because a lower dropout rate represents a better educational outcome, the negative sign is directionally consistent with the possibility of an inverse relationship indicating that higher budget utilization is associated with lower dropout. However, this should be treated only as an exploratory association and not as evidence that higher utilisation reduces dropout.
PGI Learning Outcomes show a moderate positive correlation with budget utilisation (r = +0.377). This suggests that within the five selected states, higher utilisation trends are associated with higher learning-outcome scores. Simultaneously, the overall PGI Score has almost no correlation with utilisation. This difference indicates that utilisation may not be uniformly associated with all dimensions of educational performance (refer Table 3). Furthermore, none of the reported correlations were statistically significant at the conventional 5% level, as all p-values were substantially above 0.05. Therefore, the sample did not provide sufficient statistical evidence to reject the null hypothesis of a zero linear correlation for any of the indicators. However, this result should not be interpreted as proof that no relationship exists; rather, it should be kept in mind that the very small sample limits the statistical power of the test and makes the estimated correlations sensitive to the individual states.
Overall, the correlation analysis complements the descriptive comparison. It indicates that budget utilisation and educational outcomes do not show a single, uniform relationship across the selected states. The findings are consistent with the broader argument of the paper that expenditure utilisation needs to be considered alongside factors such as fiscal capacity, education priority, central assistance, resource availability, and the efficiency and composition of expenditure.
The limitations are, Pearson’s correlation measures the strength and direction of a linear association between two quantitative variables. This study did not establish causality. In the present study, the analysis is cross-sectional and is based on only five states’ observations for FY 2024–25. Consequently, the results should be presented as exploratory rather than causal or nationally representative estimates. The p-values should also be interpreted cautiously because statistical inference with n = 5 has a very low power.
4.6. Trend and Risk-Factors
The utilisation trends reveal important differences in stability and risk across the selected states. Punjab showed noticeable fluctuations during the three-year period, with utilisation declining in 2023–24 before recovering in 2024–25. Despite this movement, the state managed to return to a near-optimal level of utilisation. Therefore, the main challenge for Punjab is to maintain this level of budget management in the future.
Kerala showed a positive trend, moving from relatively low utilisation to the optimal range. This improvement indicates a favourable direction for budget utilisation. The key requirement for the state is to maintain the progress achieved over the study period.
In contrast, Tamil Nadu showed a downward movement in utilisation. The declining trend indicates the need to improve budget utilisation and move back towards a more stable range.
Uttar Pradesh displayed relatively low volatility; however, this stability was accompanied by a lack of improvement. Its utilisation remained persistently low over the study period. Therefore, maintaining the existing pattern would not represent progress, and greater improvement in budget utilisation is required.
Bihar showed a fluctuating pattern, moving closer to the optimal range before returning to over-utilisation. The recurring movement above the budgeted level indicates the need to reduce over-utilisation and achieve a more stable pattern.
Among the other states, Gujarat showed an improvement from over-utilisation towards the optimal range. However, West Bengal, experienced a sudden decline towards approximately 90% utilisation. Arunachal Pradesh, Manipur, and Meghalaya showed the sharpest movements, shifting from extremely high utilisation to very low utilisation. These wide fluctuations indicate a greater need for improved fiscal management and more stable budget implementation.
4.7. Category versus Outcomes
The five selected states represent distinct budget utilisation patterns observed over the three-year study period. Punjab, Kerala, Tamil Nadu, Uttar Pradesh, and Bihar were selected to represent the optimal utilisation, converging towards optimal utilisation, diverging from optimal utilisation, persistent under-utilisation, and persistent over-utilisation categories, respectively. The classification was based on the study’s utilization trends framework and provides a basis for comparing budget utilisation with fiscal conditions, educational resources, and outcomes. These five states were selected to represent each category through a category-based case selection strategy rather than an assumption.
Punjab, representing the optimal utilisation category, recorded utilisation rates of 102.22%, 90.53%, and 97.21% during 2022–23 to 2024–25. Despite a high debt-to-GSDP ratio of 46.6%, it maintained relatively stable expenditure, favourable pupil–teacher ratios, and the strongest PGI position among the selected states. The resource person also described Punjab as a state with a historically strong position in education, which provides the context for its relatively favourable educational indicators.
Kerala represented the converging towards the optimal utilisation category, reflecting an improvement in its utilisation pattern over the study period. Despite fiscal pressure, including a debt-to-GSDP ratio of 36.8%, the state maintained favourable educational indicators. Its case shows that improving budget utilisation can occur even under relatively constrained fiscal conditions.
Tamil Nadu, representing the diverging from optimal utilisation category, recorded a utilisation rate of 85.56% in 2024–25. However, it continued to show favourable enrolment indicators and a pupil–teacher ratio of 1:23. This indicates that lower utilisation in a particular period does not necessarily correspond with weaker performance across all educational indicators. The resource person further pointed out that Tamil Nadu’s lower utilisation pattern needs to be viewed alongside the non-release of central assistance under Samagra Shiksha during the period, which was linked to differences over the conditions associated with centrally supported education schemes. The resource person also noted that higher expenditure per student does not by itself ensure stronger learning outcomes, as teacher capability and the use of educational resources may also influence learning performance.
Uttar Pradesh represented the persistent under-utilisation category, with a utilisation rate of 81.61%. Despite receiving the highest horizontal devolution among the selected states, its secondary GER was 64.3%, and its PGI score was 569.1. This suggests that the availability of financial resources alone does not ensure higher utilisation or better educational outcomes.
Bihar represented the persistent over-utilisation category. Despite expenditure exceeding the budget estimate and a government school share of around 80%, its PGI performance remained comparatively weak. Its pupil–teacher ratio of approximately 30 was also above the national average of 26, indicating continuing resource and educational challenges. The resource person suggested that Bihar’s priority should be to improve the efficiency of educational expenditure so that better educational performance can be achieved without relying only on higher levels of spending.
Overall, the comparison shows that budget utilisation cannot be assessed independently from fiscal capacity, resource availability, and educational outcomes. Optimal or Converging towards optimal utilisation was associated with relatively favourable outcomes in Punjab and Kerala, whereas over-utilisation in Bihar and persistent low utilisation in Uttar Pradesh did not correspond with stronger educational performance. Tamil Nadu further demonstrates that Diverging from optimal utilisation does not necessarily imply weaker outcomes across all indicators.
5. Findings
State utilisation patterns are highly heterogeneous, with some states showing optimal or improving utilisation while others experience persistent under-utilisation, over-utilisation or declining trends. The pattern can also change within the same state across financial years, showing that the Budget–Expenditure Gap should be understood through trends rather than a single-year figure. The Budget–Expenditure Gap cannot be fully explained through the overall utilisation rate alone. A closer examination of expenditure components, staffing changes, fund flows, and Central assistance is required, as these factors can contribute to differences between Budget Estimates and Actual Expenditure and help explain the final utilisation pattern across states. Financial capacity alone does not determine budget utilisation. A high Debt-to-GSDP ratio does not automatically indicate weak financial capacity, as borrowing can support development when resources are used effectively. Therefore, debt, fiscal position, devolved resources and the state’s ability to utilise available funds need to be considered together when assessing financial capacity.
Central assistance varies significantly across states and schemes and can influence the Budget–Expenditure Gap. Differences in fund release, scheme participation, and implementation affect how available resources are converted into actual expenditure. Therefore, Central assistance needs to be examined alongside state-level priorities, implementation conditions, and overall utilisation patterns rather than treated as a uniform source of funding. Over-utilisation does not automatically produce better educational outcomes, while under-utilisation does not automatically result in poor outcomes. Bihar’s 108.6% utilisation was not reflected in stronger educational performance, whereas Tamil Nadu, despite 86.56% utilisation, continued to show relatively strong educational indicators. This suggests that the quality and use of expenditure also matter. Optimal or Converging towards optimal utilisation appears more favourable than extreme utilisation. Punjab, Uttarakhand, and Kerala showed comparatively stronger utilisation patterns and educational performance, while persistent under-utilisation in Uttar Pradesh and over-utilisation in Bihar did not correspond with stronger overall outcomes. This suggests that maintaining a stable utilisation pattern may be more important than simply increasing expenditure.
Administrative capacity and the quality of spending are important for effective education financing. Delays in scheme approvals, irregular fund releases, and differences within budget components can affect expenditure execution. The interview also highlights the need for better planning, financial management, and administrative capacity so that available resources can be utilised effectively and translated into better educational outcomes. Educational outcomes are influenced by factors beyond budget utilisation alone. The analysis and interview point towards teacher capability, classroom implementation, and wider socio-economic conditions as important factors shaping outcomes.
This suggests that expenditure levels and utilisation should be considered alongside the broader institutional and social conditions that influence educational performance across states. Consequently, the processes of financial planning, administrative capacity, and fund flow might impact how budgets are utilised. Nonetheless, this study did not assess their direct impact on educational outcomes. The capabilities of teachers, socioeconomic conditions, and various state-level factors might also influence educational outcomes and performance. Thus, these elements serve as potential explanations rather than definitive causes.
6. Discussion
This study highlights that the gap between budget allocation and actual expenditure remains an important challenge in the Indian school education system. While government spending on education has increased over time, higher budgetary allocation does not always result in proportionate or effective utilisation of funds.
The overall findings suggest that the school education budget utilization capacity varies considerably both spatially (inter-state) and temporally (across the three studied financial years). The analysis indicates that allocation alone cannot determine the effectiveness of public spending. The extent to which allocated resources are translated into actual expenditure and how these utilisation patterns are associated with educational resources and outcomes are also important. Thus, this study establishes a broader relationship between fiscal allocation → actual expenditure → utilisation gap → education outcomes.
The findings complement the existing literature on public expenditure, fiscal capacity, and educational outcomes. The results of this study align with those of Singh (2019), who demonstrated the gap between actual spending and allocation. The consistently poor utilization by Uttar Pradesh reinforced the findings of Khanna (2021), who proposed, approved, released, and utilized amounts as distinct stages and warranted individual assessment. Additionally, the findings of Iyer (2009) that expenditure per student does not have a uniform effect on enrolment or examination performance are also reflected in the findings of this study.
In the case of Tamil Nadu, despite high expenditure per student, the learning outcomes remain low in the PGI framework. Furthermore, the relatively poor educational outcomes of Bihar despite persistent over-utilization are in line with what De and Endow (2008) found with respect to sluggish learning outcomes even with increased expenditures in less developed states.
Furthermore, insights from the semi-structured interview with the resource person are congruent with the findings. He remarked that a high Debt to GSDP ratio does not necessarily mean a deteriorating state, as seen in the case of Punjab (high Debt to GSDP ratio but strong and stable utilization pattern).
Previous studies have examined different aspects of education financing and expenditure; however, these dimensions are often studied separately. This present study attempts to address this gap by connecting financial allocation with actual expenditure and educational outcomes through a comparative framework within a specified time frame of three financial years covering the post-COVID recovery phase. This provides a more integrated understanding of how public resources are translated into educational development and where gaps may emerge during implementation.
Therefore, this study identified distinct patterns between budget utilisation and certain educational outcomes. However, it did not confirm a causal link between them.
7. Limitations of the Study
This study covers only three financial years, from 2022–23 to 2024–25, representing the post-COVID recovery period. The analysis is constrained to revenue expenditure under 2202-01 (Elementary Education) and 2202-02 (Secondary Education); it does not include capital expenditure under Major Head 4202. This study only focused on 28 states in India and did not include the Union Territories. This study does not examine the components of the sub-major heads in the budget documents.
Some data gaps were encountered during data collection. This study faced limitations due to differences in the availability, classification, and reporting of actual expenditures across states. CAG state finance accounts were used as the primary source for actual expenditure and cross-checked with state budget documents. For Goa and West Bengal, expenditure was calculated from State Budget documents because comparable CAG data were unavailable; Chhattisgarh data were obtained from the State Budget owing to component-wise inconsistencies. Budget data were unavailable for Maharashtra (2022–23) and Manipur (2023–24). These restrictions may have an impact on data comparability among states.
Despite these limitations, this study is important because it shifts attention from merely examining how much is allocated to understanding how effectively allocated resources are utilised. It highlights the need for stronger monitoring, implementation capacity, and accountability in public education spending.
Pearson’s correlation captures linear association but does not account for other factors that may influence educational outcomes, such as socioeconomic conditions, demographic characteristics, teacher availability, infrastructure, and the composition and efficiency of expenditure. Accordingly, the results are interpreted as exploratory associations rather than causal effects.
8. Future Scope
Future research can extend this study by collecting primary data, including interviews with government officials, teachers, school administrators, and other stakeholders. District-level and school-level comparisons can provide deeper insights into where and why expenditure gaps occur.
Longer time-series analysis can also help examine the relationship between allocation, expenditure, and educational outcomes over time. Further research can investigate state-specific administrative and institutional factors behind under-utilisation and help develop targeted policy recommendations for improving the efficiency and effectiveness of public spending on school education.
9. Conclusion
This study examined the gap between budgetary allocation and actual expenditure in the Indian school education system, with particular emphasis on the relationship between fiscal capacity, education prioritization, central assistance, and educational outcomes. The findings indicate that bridging the budget–expenditure gap requires a shift from an allocation-centric approach to an outcome-oriented approach. Governments should strengthen expenditure monitoring, improve financial planning, enhance institutional capacity at the state and local levels, and strengthen the link between expenditure planning and educational outcomes.
Overall, the study concludes that increasing public expenditure on school education remains necessary, but the effectiveness of expenditure is as important as the amount allocated. A meaningful improvement in India’s school education system requires not only adequate financial resources but also efficient utilisation, stronger governance, better coordination between different levels of government, and a sustained focus on outcomes.
Addressing these dimensions together can reduce inter-state disparities and ensure that public investment in education produces inclusive, equitable, and sustainable improvements. The budget–expenditure gap, therefore, should be viewed as an opportunity to strengthen the efficiency and accountability of India’s education financing system rather than simply as a difference between two financial figures.
This study indicates that budget utilisation differs among states and does not consistently align with educational outcomes. Consequently, budget utilisation should be evaluated alongside other financial, administrative, and socioeconomic factors. Further investigation using long-term data and statistical methods is necessary to explore these relationships more thoroughly.
Acknowledgements
We extend our sincere thanks to the International Institute of SDGs and Public Policy Research (IISPPR) for providing the opportunity to undertake this study. We are particularly grateful to Dr. M. Vijayabaskar, Former Member of the State Planning Commission, Tamil Nadu, for his valuable insights during a semi-structured interview, which significantly enhanced our research.
References
Bose, S., Bera, M., & Ghosh, P. (2020). Centre-State spending on elementary education: Is it complementary or substitutionary? (NIPFP Working Paper No. 320). National Institute of Public Finance and Policy. https://www.nipfp.org.in/media/documents/WP_320_2020.pdf
Comptroller and Auditor General of India. (2026). Finance accounts, Government of Punjab, 2024-25 (Vol.I). https://cag.gov.in/uploads/state_accounts_report/account-report-Finance-Accounts-Vol-I-2024-25-069b7e8a11653b5-25892762.pdf
Comptroller and Auditor General of India. (2026). Finance accounts, Government of Kerala, 2024-25 (Vol.I). https://cag.gov.in/uploads/state_accounts_report/account-report-Finace-Accounts-Vol-I-2024-25-0699d360b32af96-97221491.pdf
Comptroller and Auditor General of India. (2026). Finance accounts, Government of Tamil Nadu, 2024-25 (Vol.I). https://cag.gov.in/uploads/state_accounts_report/account-report-Finance-Accounts-VOL-I-2024-25-069985766ce7b13-16162327.pdf
Comptroller and Auditor General of India. (2026). Finance accounts, Government of Uttar Pradesh, 2024-25 (Vol.I). https://cag.gov.in/uploads/state_accounts_report/account-report-Finance-Accounts-Vol-I-2024-25-English-06964e82777f6d2-05539712.pdf
Comptroller and Auditor General of India. (2026). Finance accounts, Government of Bihar, 2024-25 (Vol.I). https://cag.gov.in/uploads/state_accounts_report/account-report-Account-Volume-I-ENGLISH-2024-25-BIHAR-31-01-2026-069a011be9935a9-80886549.pdf
Data Sources. Budget Estimates and Actual Expenditure data were compiled from State Budget Documents and the Comptroller and Auditor General of India (CAG) Finance Accounts, Volume II. The complete list of documents used for data extraction is provided in Appendix C.
De, A., & Endow, T. (2008). Public expenditure on education in India: Recent trends and outcomes (RECOUP Working Paper No. 18). Research Consortium on Educational Outcomes and Poverty. https://nbn-resolving.org/urn:nbn:de:0168-ssoar-69258
Department of School Education and Literacy, Ministry of Education, Government of India. (2025). UDISE+ Report 2024-25 Existing Structure: Report on Unified District Information System for Education Plus UDISE+ 2024-25. https://dashboard.udiseplus.gov.in/report2026/static/media/UDISE+2024_25_Booklet_existing.1 18ba29d4773e6372f72.pdf
Department of School Education and Literacy, Ministry of Education, Government of India. (2026). Performance Grading Index 2.0 for States/UTs, 2024-25. https://spgi.udiseplus.gov.in/
Department of School Education and Literacy, Ministry of Education, Government of India. (n.d.). GIS Mapping of PM SHRI Schools. PM SHRI Schools. https://pmshri.education.gov.in/
Department of School Education and Literacy, Ministry of Education, Government of India. (2023, July 21). PM SHRI – Meeting of the Project Approval Board (PAB) held on 18th July, 2023. https://www.dsel-education.gov.in/static/uploads/2025/10/ef8b0ff3dc7e7bb5dc69e8d300c559e4.pdf
Department of School Education and Literacy, Ministry of Education, Government of India. (n.d.). Recurring Central Assistance Released for FY: 2024-25. PM POSHAN. https://pmposhan.education.gov.in/Release%20of%20Central%20Assistance%202024-2025.html
Department of School Education and Literacy, Ministry of Education, Government of India. (2025, April 29). Minutes of the Meeting of Programme Approval Board (PAB) for State of Punjab. PM POSHAN 2025-26. https://pmposhan.education.gov.in/Files/PAB/PAB-2025-26/Minutes-PAB-2025-26/Punjab_PAB%20Minutes.pdf
Department of School Education and Literacy, Ministry of Education, Government of India. (2025, Kerala). Minutes of the Meeting of Programme Approval Board (PAB) for State of Kerala. PM POSHAN 2025-26. https://pmposhan.education.gov.in/Files/PAB/PAB-2025-26/Minutes-PAB-2025-26/Kerala_Minutes_FY-2025-26.pdf
Department of School Education and Literacy, Ministry of Education, Government of India. (2025, April 29). Minutes of the Meeting of Programme Approval Board (PAB) for State of Tamil Nadu. PM POSHAN 2025-26. https://pmposhan.education.gov.in/Files/PAB/PAB-2025-26/Minutes-PAB-2025-26/TamilNadu.pdf
Department of School Education and Literacy, Ministry of Education, Government of India. (2025, April 29). Minutes of the Meeting of Programme Approval Board (PAB) for State of Uttar Pradesh. PM POSHAN 2025-26. https://pmposhan.education.gov.in/Files/PAB/PAB-2025-26/Minutes-PAB-2025-26/UP.pdf
Department of School Education and Literacy, Ministry of Education, Government of India. (2025, April 29). Minutes of the Meeting of Programme Approval Board (PAB) for State of Bihar. PM POSHAN 2025-26. https://pmposhan.education.gov.in/Files/PAB/PAB-2025-26/Minutes-PAB-2025-26/Bihar%20Minutes.pdf
Dongre, A. A., Kapur, A., & Tewary, V. (2014). How much does India spend per student on elementary education? Accountability Initiative, Centre for Policy Research. https://papers.ssrn.com/sol3/papers.cfm?abstract_id=2515048
Finance Commission of India. (2020). Finance Commission in Covid Times Report for 2021-26: Volume I – Main Report. https://fincomindia.nic.in/asset/doc/commission-reports/XVFC%20VOL%20I%20Main%20Report.pdf
Guleria, N., Mittal, R. K., Isha, T., & Goutam, S. (2025). Public expenditure on education in India: Trends and implications. International Journal of Engineering Technologies and Management Research, 12(6), 32–50. https://doi.org/10.29121/ijetmr.v12.i6.2025.1625
Hassan, E., Groot, W., & Volante, L. (2025). The relationship between education funding and student performance in Unity Schools in Nigeria. Education Sciences, 15(1), 86. https://doi.org/10.3390/educsci15010086
Iyer, T. (2009). Is public expenditure on primary education effective? Evidence from districts across India [Honors thesis, Duke University]. https://dukespace.lib.duke.edu/server/api/core/bitstreams/15364b62-0bf7-47e1-9876-e3632538c753/content
Jhingran, D., & Sankar, D. (2009). Addressing educational disparity: Using district level education development indices for equitable resource allocations in India (Policy Research Working Paper No. 4955). The World Bank. https://doi.org/10.1596/1813-9450-4955
Khanna, P. (2021). Financing education under Samagra Shiksha Abhiyan: An initial analysis in selected states of India. Journal of Business Thought, 12, 63–73. https://doi.org/10.18311/jbt/2021/28884
Mehrotra, S. (2012). The cost and financing of the right to education in India: Can we fill the financing gap?. International Journal of Educational Development, 32(1), 65-71. https://doi.org/10.1016/j.ijedudev.2011.02.001
Mehta, A., Narang, D., Gupta, S., Sethi, B., & Kaushal, V. (2025). Trends in public expenditure on education in India: An inter-state analysis. International Journal of Arts & Education Research, 14(4), 67–78. https://ijaer.org/admin/uploads/paper/file1/l5YFBoaeWkJkBBv%2BTlXckQ%3D%3D1.pdf?utm
Ministry of Statistics and Programme Implementation, Government of India. (n.d.). State Domestic Product and other aggregates 2011-12 series. https://www.mospi.gov.in/product/more/6-Data
Patil, A. G., Hanagodimath, S. V., & Prabhakar, J. S. C. (2022). Public expenditure on the education sector in India. Antrocom Online Journal of Anthropology, 18(2a), 151–157. https://antrocom.net/archives/2022/volume-18-number-2/public-expenditure-on-the-education-sector-in-india/
Press Information Bureau. (2026, July 29). Implementation of PM SHRI Scheme. Ministry of Education. https://www.pib.gov.in/PressReleaseDetail.aspx?PRID=2291330®=3&lang=1
Sansad. (2025, August 12). Public debt of the States and Union Government (Rajya Sabha Unstarred question No-2635). https://www.sansad.in/getFile/annex/268/AU2635_fQvbz2.pdf?source=pqars&utm
Sansad. (2025, December 15). Fund Released for Samagra Shiksha Abhiyan (Lok Sabha Unstarred question No-2375). https://www.sansad.in/getFile/loksabhaquestions/annex/186/AU2375_lwpLQf.pdf?source=pqals
Singh, U. (2019). A comparative study of the trends of public expenditure on education in India with special reference to school education. Journal of Economic & Social Development, 15(1), 111–128 https://www.academia.edu/99921818/A_COMPARATIVE_STUDY_OF_THE_TRENDS_OF_PUBLIC_EXPENDITURE_ON_EDUCATION_IN_INDIA_WITH_SPECIAL_REFERENCE_TO_SCHOOL_EDUCATION?source=swp_share
The Hindu Bureau. (2025, December 03). Ready to release Samagra Shiksha funds to Kerala subject to NEP implementation: Union Minister. The Hindu. https://www.thehindu.com/news/national/kerala/ready-to-release-funds-to-kerala-subject-to-nep-implementation-union-minister/article70354692.ece