Authors :
Aryan Dakhare, Gaandharvi Kulthia, Karuna Devi, Reethikaa.G, Rimi Deb, Saurabh Kharabe, Subho Mondal, Utkarsh Kedia, Yashita Jain.
ABSTRACT
The National Education Policy (NEP) 2020 positions Artificial Intelligence (AI) and smart school digital infrastructure as central pillars of India’s education reform. Little is known about how public expenditure has supported this vision across states, since the implementation of NEP 2020’s digital goals depends on financial commitment from both Union and state governments, and existing literature has examined policy, technology, and infrastructure disparities largely in isolation from budgetary data, leaving it unclear whether states with higher funding actually possess better digital infrastructure. This study examines budget allocation for AI and smart-school infrastructure after NEP 2020 using a quantitative, descriptive-comparative research design, drawing on secondary data from Union and state budget documents, Demand for Grants, Economic Survey reports, Samagra Shiksha records, and UDISE+ data to trace funding trends, compare allocations across seven states Uttar Pradesh, Tamil Nadu, West Bengal, Delhi, Assam, Haryana, and Maharashtra and assess the relationship between expenditure and functional infrastructure. The findings indicate that while overall education budgets have generally increased, digital and AI-related allocations remain uneven in scale, inconsistently classified, and often not separately visible in budget documents, meaning that higher overall education spending does not reliably correspond to higher digital allocation. When AI/digital allocations are separated into comparability tiers and set against UDISE+ 2024-25 functional-infrastructure data, a positive association emerges between narrowly defined, identifiable AI/ICT spending and the share of schools with functional computers (Spearman’s ρ = +0.68 to +0.79 depending on specification, n = 7), though the small sample means this association is indicative rather than statistically conclusive. This study contributes a comparative, funding-focused perspective largely absent from existing NEP 2020 research and highlights the need for standardized budget reporting to enable meaningful cross-state comparisons and accountability
Chapter 1 – INTRODUCTION
The National Education Policy (NEP) 2020 is one of the major changes in India’s education system after independence. It came into existence to replace the 34-year old education system of 1986, aiming to change the way students learn, teachers teach, and schools manage.
“The National Education Policy is going to give a new direction to 21st century India.”
– Narendra Modi, Conclave on School Education in 21st Century, September 2020
One important part of the policy is the use of artificial intelligence (AI), digital tools, and smart school infrastructure. NEP 2020 sees technology as a way to modernise education and improve learning. However, making plans for digital education is not enough. Proper funding is also needed to make these plans work in schools. Therefore, it is important to understand how funding for AI and smart school infrastructure has changed after NEP 2020.
This issue is important because NEP 2020 covers a very large education system with millions of students, teachers, and schools across India. The implementation of digital education depends on financial support from both the Union and state governments. Because of this, the availability of smart classrooms, digital devices, and AI-based tools can be different from one state to another. Government funding is therefore important for understanding whether the digital goals of NEP 2020 are supported in practice.
There is growing discussion about AI and technology in education, but it is not always clear how this is reflected in government spending. Before the 2025-26 financial year, the Union education budget did not have a specific allocation for AI in education. Different states have also introduced digital education programmes, smart classrooms, and technology-based initiatives in different ways. In some cases, spending is shown separately, while in others it is included under broader education, ICT, or school development programmes. This makes the actual level of funding difficult to understand. Therefore, funding trends after NEP 2020 need to be examined to see whether financial support has increased.
Another important issue is the difference in funding between states. Indian states differ in their economic conditions, education performance, and level of digital infrastructure. Funding for digital education can also vary across states. Therefore, looking only at national-level spending cannot give the complete picture. A comparison of selected higher- and lower-performing states can help us understand these differences. This study focuses on seven states: Uttar Pradesh, Tamil Nadu, West Bengal, Delhi, Assam, Haryana, and Maharashtra. This comparison can show how funding patterns differ.
The existing research on AI and smart school infrastructure mainly focuses on policy, technology, and implementation, but it does not properly connect funding with infrastructure. Among the nine policy-focused papers, seven papers state that they did not examine budgets or state-wise spending. Patel’s (2026) study examines the budget only at the national level, while Pritam and Shaikh’s (2024) study provides state-wise infrastructure data but does not examine the money spent on it. Therefore, existing studies look at funding and infrastructure separately. It is still unclear whether states with higher funding have better AI and smart school infrastructure. This study addresses this gap by comparing funding across selected states and examining its relationship with infrastructure implementation.
The study seeks to highlight the funding-education development paradox, where increased financial investment does not necessarily result in better educational development in the absence of quality, effective administration, proper implementation, and efficient utilisation of resources. This issue is particularly important for achieving Viksit Bharat 2047, as India’s ambition to become a developed country depends significantly on the quality of its education system and human capital. Compared with leading countries, India continues to face gaps in educational quality, digital infrastructure, technological skills, and learning outcomes. Therefore, the study examines whether India’s growing investment in AI and smart education is actually narrowing these gaps or whether weaknesses in implementation and governance continue to limit educational development.
Chapter 2 – REVIEW OF LITERATURE
2.1 Overview
Since the National Education Policy (NEP) 2020 was introduced, artificial intelligence and “smart”digital infrastructure have been positioned as central tools for modernising Indian school education, from personalised learning and automated assessment to teacher training and administrative efficiency. What is far less clear, and far less studied, how much of this actually costs the government to deliver, and whether states are funding it in comparable ways. This gap matters because policy ambition and financial commitment do not automatically move together. A state can adopt every recommendation in the policy document and still fail to allocate the money needed to act on it, or it can spend generously and still see poor results if that money is not well managed.
The present study shows that AI in school education is no longer discussed only as a way to improve teaching. It is increasingly understood as a systems issue involving infrastructure, public finance, teacher preparedness, governance, data protection and institutional capacity. Karan and Angadi (2023), for example, identify AI applications in personalised learning, assessment, learning analytics, virtual facilitation and school administration, while stressing that curriculum reform must be accompanied by reliable electricity, connectivity, hardware, software, trained teachers, funding and institutional readiness.The purpose of this review is to bring together the existing research on AI in Indian school education under NEP 2020 and examine what it does, and does not, tell us about budget allocation and expenditure.
The review is organised around four themes: The purpose is not simply to catalogue studies but to identify how the literature has developed, where the evidence is strongest, where it is limited, and how the proposed comparative study contributes to the existing body of knowledge.
Theme 1: Policy and Legal Framework for AI and Smart School Infrastructure under NEP 2020
Kumar (2021) presents NEP 2020 as a comprehensive reform requiring sustained public funding, administrative coordination and monitoring. Karan and Angadi (2023) show that AI applications in school education include personalised learning, assessment, learning analytics and school administration, but effective adoption requires electricity, connectivity, hardware, software, trained teachers, funding and institutional readiness. Thus, policy commitment alone is insufficient.
Digital platforms such as DIKSHA, SWAYAM and NETF are aimed to expand access, multilingual content and teacher training, yet Meena (2025) identifies operational gaps in their implementation. Malviya (2025) similarly highlights rural connectivity, device and language-content deficits. The literature also raises data privacy, ethics, equity and teacher-preparedness concerns (Saranya, n.d.; Moharana, 2025). Chethan et al. (2026) propose an equity-oriented AI public-finance framework based on need, infrastructure, teachers and digital vulnerability. Overall, the policy literature establishes strong national intent but provides limited evidence on how these priorities are translated into state-level budgets.
Theme 2: Budget Allocation and Expenditure Patterns across Indian States
Kundu (2018) provides important pre-NEP data by analysing school-education budgets in six states. The study shows that greater fiscal resources do not automatically result in better school education or infrastructure. It also distinguishes budget allocation and actual expenditure, highlighting the importance of fund utilisation. Infrastructure spending varies considerably between states.
Chethan et al. (2026) argue that education budgets often follow historical rather than need-based patterns. Goswami and Biswas (2025) similarly report that direct public investment in AI education in India remains limited. A key measurement problem is that AI and smart-school expenditure may be distributed across ICT, digital education, smart classrooms, teacher training, Samagra Shiksha and other schemes rather than appearing under one budget head. Therefore, post-NEP analysis must systematically identify relevant components and distinguish budget estimates, revised estimates and actual expenditure. This remains a major research gap.
Theme 3: Implementation of AI and Smart School Infrastructure across States
UDISE+ based research shows substantial inter-state and management differences in technological infrastructure. Pritam and Shaikh (2024) show variation in computer availability, functional computers and digital teaching devices, with government schools generally disadvantaged compared with private schools. The study also stresses that equipment must be functional and usable, not merely installed.
Verma (2025) reports weak computer and functional computer availability in government schools in Uttar Pradesh and links disparities to state contributions, financial flows, infrastructure and trained staff. Maharashtra studies provide complementary evidence: Deshmukh and Wagh (2026) identify low digital competency, shared-device dependence and limited teacher training in rural areas, while Shaikh and Bora (2025) find strong relationships between infrastructure, AI-platform adoption and teacher digital competency.
Teacher readiness is repeatedly identified as a critical factor (Tripathi et al., 2025; Nishali & Malini, 2025). Studies from West Bengal also show that institutional and bureaucratic cultures influence technology adoption (Datta & Mete, 2024; Shankar et al., 2024). Thus, implementation depends not only on expenditure but also on infrastructure functionality, teacher capacity, institutional readiness and actual usage.
Theme 4: Challenges, Outcomes and Best Practices
The most common challenges identified are the digital divide, unreliable connectivity and electricity, device shortages, low teacher digital literacy, insufficient training, limited regional-language content, data privacy, ethical risks and weak institutional capacity (Karan & Angadi, 2023; Moharana, 2025). The literature suggests that successful implementation requires more than hardware procurement. Infrastructure needs to be combined with teacher training, appropriate content, connectivity and institutional support.
Shaikh and Bora (2025) link infrastructure quality, teacher digital competency and local-language content with AI adoption and engagement. Goswami and Biswas (2025) identify useful international practices including equity oriented funding, institutionalised teacher training, rural connectivity expansion and stronger technology provider accountability. Chethan et al. (2026) similarly advocate need based and equity weighted financing. Overall, expenditure should be assessed through financial inputs, infrastructure functionality, implementation and educational/equity outcomes rather than allocation alone.
2.2 Research Synthesis
Across the reviewed literature, the state-wise picture is uneven. Pritam and Shaikh (2024) find infrastructure “significantly high” (≥80%) in Gujarat, Kerala, Haryana, Punjab, Jharkhand, Chhattisgarh, Maharashtra, and Sikkim, while Uttar Pradesh sits at just “8.1%” and West Bengal at “18.4%” computer availability. Kundu’s (2018) A six-state budget study shows Tamil Nadu allocating the highest infrastructure share at “10% in Tamil Nadu” against “just 1% in Uttar Pradesh” with Bihar and Chhattisgarh’s infrastructure spending rising while Uttar Pradesh’s and West Bengal’s declined. Datta and Mete (2024) report a clear urban-rural split within West Bengal’s own government schools, though “no significant difference between urban and rural private schools.” In Tamil Nadu, Nishali and Malini (2025) find that institutional type “significantly” affects AI-tool accessibility in Chennai (p = 0.000841). Maharashtra appears twice: Shaikh and Bora (2025) tie “73.2% of adoption variance” to infrastructure quality, while Deshmukh and Wagh (2026) find only “28.4%” of rural learners meet basic digital-competency thresholds. These state-level findings confirm real regional variation but rarely connect it back to actual public expenditure at the national level, the gaps this nationwide study aims to close.
2.3 Research Gap
Prior research focuses on functioning of technology in private schools and colleges, while overlooking the condition of real-world government schools. Nevertheless, previous literature highlights a distinct gap between the government policy claims and actual execution disparities-political ideology, bureaucratic culture, institutional resistance are the key factors hindering the utilization of computers in school. However, existing studies exhibit critical empirical, methodological, and financial limitations when assessing actual classroom integration. Methodologically, current studies rely heavily on secondary policy reviews and descriptive macro reports, resulting in a lack of quantitative K 12 research on post-AI implementation outcome regarding teacher and student readiness, as well as adoption across rural and urban areas. Furthermore, prior literature fails to cover upstream public finance dynamics such as state and district level budget allocations records and procurement processes for digital school infrastructure with ground-level functional hardware availability across diverse public school environments remains largely unexamined.
To address these critical empirical, financial, and contextual gaps, this study provides an original empirical investigation into post-NEP 2020 digital education and smart school execution. The originality of this research lies in its focus on the budgetary and public finance gap, which is previously unexplored in existing literature on digital education. By examining the frail connection between state and district level of budget allocation and group level expenditure, this paper assess the real policy outcome of NEP 2020 by comparing directly with the high level policy intent against actual classroom implementation- a critical comparison made necessary by the void of primary or secondary field data on functional hardware and AI adoption in public schools. Furthermore, as AI tools and smart school infrastructure are rapidly growing in the Indian education system, this study establishes a vital empirical baseline for future researchers tracking digital integration over time. Finally, this paper creates a precise formula for tracking school technology budgets so that future researchers can easily analyze how much money is being spent and make comparisons between different Indian states.
2.4 Research Question
1. How has public expenditure on AI-integrated and smart-school digital infrastructure changed across Indian states since the implementation of NEP 2020?
2. What is the relationship between state-wise public expenditure on digital/AI infrastructure and its actual availability and functional use in schools across India?
3. What administrative, institutional, and policy-level factors explain the differences among Indian states in translating budget allocation into functional AI/digital infrastructure?
That is, to examine how public expenditure and budget allocation for AI and smart-school digital infrastructure have changed across Indian states since NEP 2020, and to assess how these funding patterns relate to the infrastructure disparities documented in existing research nationwide.
2.5 Research Objective
1. To trace and compare trends in budget allocation for digital/smart-school infrastructure across Indian states before and after NEP 2020.
2. To assess whether higher public expenditure on digital/AI infrastructure in a state corresponds to higher functional availability of that infrastructure in schools, using UDISE+ and related state-level data.
3. To identify the administrative and institutional factors that explain why increased budget allocation has not translated into functional digital/AI infrastructure uniformly across Indian states.
Chapter 3 – METHODOLOGY
3.1 Research Design
This study uses a descriptive-comparative design covering government policies, education activities, AI/ smart schools spending under NEP 2020, at country and seven selected states level. The correlational element (Section 4.5) tests Spearman’s rank correlation to test whether a state’s digital/AI budget priority links to UDISE+ 2024-25 infrastructure data. indicators for the same state. With only seven purposively chosen states, this correlation is exploratory, not proof of cause and effect; it is reported with its p-value and a leave one state out robustness check. Budget figures continue to come from successive government reports rather than a probability sample, so year-over-year budget comparisons remain descriptive rather than inferential.
3.2 Nature of Research
It is mainly quantitative using multi year education budget figures and UDISE+ 2024-25 school facility counts.. A small qualitative aspect classifies how states word digital schemes differently. Data points are:
- ICT lab/ digital or smart classrooms
- Digital board/ connectivity support
- AI-based learning or assessment tool
- tech based upgradation
Figures are shown against total education spending or each other.
3.3 Sample and Sampling Technique
The study covers central and state education budgets and AI projects launched after NEP 2020. Purposive sampling selected seven states: Uttar Pradesh, Maharashtra, Tamil Nadu, Delhi, West Bengal, Assam, and Haryana, chosen for variation in budget size, digital-readiness reporting, scheme timelines, and data quality. States were compared against Union plans, then each other.
3.4 Data Collection Tool
Data has been collected using a secondary data extraction sheet and a specially constructed Excel based workbook for the study. The secondary data has been gathered from:
- Union government budgets
- State budgets
- Demand for Grants
- Annual Survey of India’s Digital Enterprise, (ASIDE), Survey of the Government of India, Ministry of Finance
- Report of economic survey for different years
- UDISE+ reports
- Samagra Shiksha report data
- Guidelines/scheme details (available).
Each entry in the spreadsheet contained a name for the government year, scheme name, type of budget estimate(s), outlay, comparability tier (see 3.5) and sources. Information from this study is reflected in tables, percentages (alongside the absolute number) and in graphs.
3.5 Variables Used
Governments or states themselves are taken as the variable for comparison. For comparisons between governments (states), year and category of scheme are noted explicitly alongside each figure rather than assumed to be aligned since (as Section 4.3 discusses) the states in this sample don’t report on the same budget year. The types of Dependent Variables are:
- Total government outlay (for education)
- Budget allocated on education
- Education priority ratio (amount allocated on education divided by total governmental expenditure) x 100
- Budget for digitally focused/ AI education schemes, classified into three comparability tiers:
- Tier A: AI-specific schemes (e.g., a state AI Mission, a dedicated AI budget line)
- Tier B: ICT-lab or smart-classroom-specific allocations that are digital but not AI-specific
- Tier C: broad digital, modernisation, or cross-sectoral proxy figures that cannot be cleanly separated into AI or ICT-only spending
- Digital priority ratio (allocated for digital/ smart schools divided by the total allocated for school education x 100), reported both for Tier A+B (identifiable, comparable spending only) and for Tier A+B+C (the broadest available figure, flagged as not directly comparable across states)
- Outlay released/utilised
- Infrastructure benchmark
- Share of schools with a functional computer for pedagogical purposes (UDISE+ 2024-25)
- Share of schools with internet facility (UDISE+ 2024-25)
It is important to mention that looking at the budget figure doesn’t define the priority that the governments place at a level of school and in comparison with the country or with respect to other important issues or financial commitments, for that only comparison should be looked at from a ratio point of view. Ratios at any given time are an indicator of how the governments prioritize compared to one another even if the magnitude of the state’s finances differ.
3.6 Ethical Considerations
The study uses only public secondary data and has no individual participants. It follows proper citation, retains labels such as BE, RE and Actual Expenditure, and states limitations concerning cross-sector AI schemes and wider infrastructure spending.
3.7 Limitations
A number of factors define what this study can and cannot do:
- Some states do not have a separate category for AI education initiatives, making definitions inconsistent.
- Some figures cover broader technology or school infrastructure, making digital/AI spending difficult to identify separately.
- Budget allocation does not show actual spending; Actual Expenditure provides a clearer measure.
- Release figures represent fund transfers, not actual school-level use.
- State budget years range from 2022–23 to 2026–27 and are not aligned. Therefore, comparisons use the most recent year available for each state rather than a common-year snapshot. UDISE+ 2024–25 provides a common year for infrastructure data, but funding data remain multi-year.
- With only seven states, the Spearman correlation has limited statistical power. It cannot establish causation or be generalised beyond the sample.
- Comparable pre-NEP state-level digital/AI budget data were unavailable for most states. Therefore, Objective 1 relies mainly on the Union-level time series, with state trends limited to available years, mostly from 2022–23 onward.
Chapter 4 – DATA ANALYSIS AND INTERPRETATION
4.1 Introduction to Data Analysis
This chapter presents and interprets the budgetary evidence on AI and digital infrastructure in education following the implementation of NEP 2020. The analysis is organised at five levels: the Union level to examine changes in education and AI-related allocations over time (4.2); the state level to compare budgetary priorities, AI/digital allocations using an explicit comparability tier for each figure (4.3); implementation gaps and central fund flow (4.4); a direct test of the relationship between digital/AI budget priority and UDISE+ 2024-25 functional-infrastructure indicators (4.5); and a synthesis of the administrative and institutional factors that the literature associates with the patterns observed (4.6).
4.2 National Allocation vs Priority (2020-21 to 2026-27)
The data shows that Union education spending rose every year in absolute terms, from ₹99,311.52 crore in 2020-21 to ₹1,39,289.48 crore in 2026-27 (Press Information Bureau, 2026; PRS Legislative Research, 2026b). However, education’s share of the total Union Budget moved in the opposite direction for most of the period, falling from 3.26% to a low of 2.49% in 2024-25 before recovering only slightly to 2.60% by 2026-27. A distinct AI-in-education budget line appears only from 2025-26 onward, comprising a Centre of Excellence (CoE) in AI for Education and, in separate budget heads, the IndiaAI Mission and the Atal Tinkering Labs scheme (CERAI, 2025).
|
Year |
Union Education Budget (₹ cr) |
Education Share of Total Union Budget |
AI-in-Education Allocation (₹ cr) |
|
2020-21 |
99,311.52 |
3.26% |
No separate line item |
|
2021-22 |
93,224.31 |
2.68% |
No separate line item |
|
2022-23 |
approx. 1,04,278 |
approx. 2.64% |
No separate line item |
|
2023-24 |
approx. 1,12,899 |
2.51% |
No separate line item |
|
2024-25 |
approx. 1,20,000 |
approx. 2.49% |
No separate line item |
|
2025-26 |
1,28,650 |
2.54% |
500 (CoE in AI) + 2,000 (IndiaAI Mission) |
|
2026-27 |
1,39,289.48 |
2.60% |
500 (CoE in AI) + 3,200 (Atal Tinkering Labs) |
Table 1: Union education budget, education share of total budget, and AI-in-education allocation, 2020-21 to 2026-27.
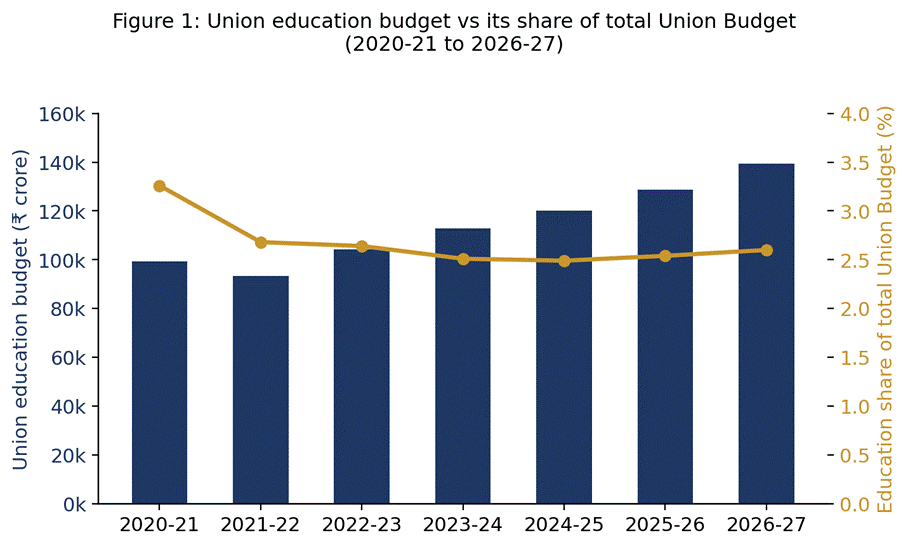
Figure 1: Union education budget (bars) against education’s share of the total Union Budget (line), 2020-21 to 2026-27.
This shows that nominal budget growth did not translate into a stronger relative position for education within the Union Budget, and that AI-specific financing is a very recent addition. NEP 2020 envisages AI-enabled tools and technology infrastructure as part of school education, yet the dedicated Centre of Excellence in AI for Education is worth at most ₹500 crore, about 0.36% of the ₹1,39,289.48 crore education budget in 2026-27, so policy intent and actual financial commitment do not match at the national level.
Implementation also lags allocation. On a same-year comparison, Samagra Shiksha, the main channel for ICT infrastructure had a Budget Estimate of ₹37,453 crore in 2023-24 against actual expenditure of ₹32,830 crore, a shortfall of 12.3% (Education for All in India, 2025). For 2025-26, the revised estimate of ₹38,000 crore against a Budget Estimate of ₹41,250 crore represents a smaller shortfall of about 7.9%, and PRS Legislative Research (2026b) separately reports that around 86% of Samagra Shiksha’s allocation is utilised in an average year nationally, suggesting the utilisation gap, while real, has been narrowing rather than widening at the national level.
4.3 State-Wise Allocation and Utilisation (2022-23 to 2026-27)
The data shows considerable differences among the seven states in how AI and digital-infrastructure allocations are recorded and reported year to year. Table 2 separates every state’s digital/AI allocation into three explicit tiers: Tier A covers AI-specific schemes; Tier B covers ICT-lab or smart-classroom allocations that are digital but not AI-specific; and Tier C covers broad digital, modernisation, or proxy figures that cannot be cleanly separated from wider infrastructure spending. Each state’s figures also carry their own budget year, since the seven states do not report on a common year.
|
State |
Total Budget (₹ cr) |
Education Budget (₹ cr) |
Education Share |
AI / Digital Allocation (₹ cr) |
Utilisation / Release Evidence |
|
Maharashtra |
approx. 7,20,000 (2025-26) |
approx. 1,10,880 (2025-26) |
15.4% |
144.4 (2025-26, Samagra Shiksha PAB) |
10.9% utilised, 2022-23 (₹0.235 cr of ₹2.16 cr) |
|
Haryana |
2,23,658 (2026-27) |
approx. 28,181 (2026-27) |
12.6% |
474 (2026-27, Haryana AI Mission) |
Scheme approved March 2026; spend not yet available |
|
Delhi |
1,03,700 (2026-27) |
19,326 (2026-27) |
19% |
160 (2026-27: 150 smart classrooms + 10 AI) |
0.07% utilised 2021-22; 6.7% utilised 2022-23 (earlier scheme) |
|
Tamil Nadu |
approx. 4,39,000 (2025-26) |
46,767 (2025-26) |
approx. 10.6% |
13.93 (2025-26, TN AI Mission) + 1,896.42 SSA |
SSA release fell 88.3% (2023-24) to 4.6% (2025-26) |
|
Uttar Pradesh |
approx. 8,51,000 (2026-27) |
1,08,154 (2026-27) |
12.8% |
225* (2026-27, UP AI Mission; excluded from education spend) |
No comparable AI-specific expenditure figure reported |
|
West Bengal |
4,39,000 (2026-27, BE) |
44,948 (2026-27) |
approx. 10.2% |
2,349.78 (2025-26, broad digital/modernisation commitment; not yet confirmed for 2026-27) |
Zero PM POSHAN central release since 2023-24 |
|
Assam |
2,85,084 (2026-27) |
18,870 (2026-27, school-specific) |
approx. 6.6% |
No separate line item; proxy: school capital outlay 1,713 (classrooms, labs, digital combined) |
No AI-specific budget head in any year of the record |
Table 2: State-wise total budget, education budget, education share, and AI/digital allocation.
Reading Table 2 by tier rather than as a single blended figure gives a clearer picture. Tier A (AI-specific) allocations are comparable across states: Haryana ₹474 crore, Uttar Pradesh ₹225 crore, Tamil Nadu ₹13.93 crore, and Delhi ₹10 crore. Haryana and Uttar Pradesh therefore have the largest AI-specific allocations in absolute terms, although these remain small relative to their overall education budgets, with Digital Priority Ratios of 1.68% and 0.21%, respectively. Tier C figures require separate interpretation: West Bengal’s ₹2,349.78 crore and Assam’s ₹1,713 crore are the largest absolute figures in the table, but they represent broad digital/modernisation or general capital-outlay proxies rather than AI-specific or ICT-specific allocations and are therefore not directly comparable with Tier A or Tier B. The earlier claim that West Bengal “records the single largest identifiable digital allocation” consequently over-read a Tier C proxy as directly comparable to Tier A figures. The table also contains a year difference: most states are measured using 2026-27 allocations, while Maharashtra and Tamil Nadu use 2025-26 figures because those are the latest comparable AI/digital allocation figures available for these states in the sources used. This difference should be considered when comparing absolute allocations across states. Overall, once the tiers and reference years are kept separate, the table does not show a state with both a large Tier A allocation and a large education budget: Maharashtra and Uttar Pradesh have large education budgets but relatively modest Tier A/B allocations, while states with more visible Tier A commitments, particularly Haryana and to a lesser extent Delhi, have smaller education budgets overall.
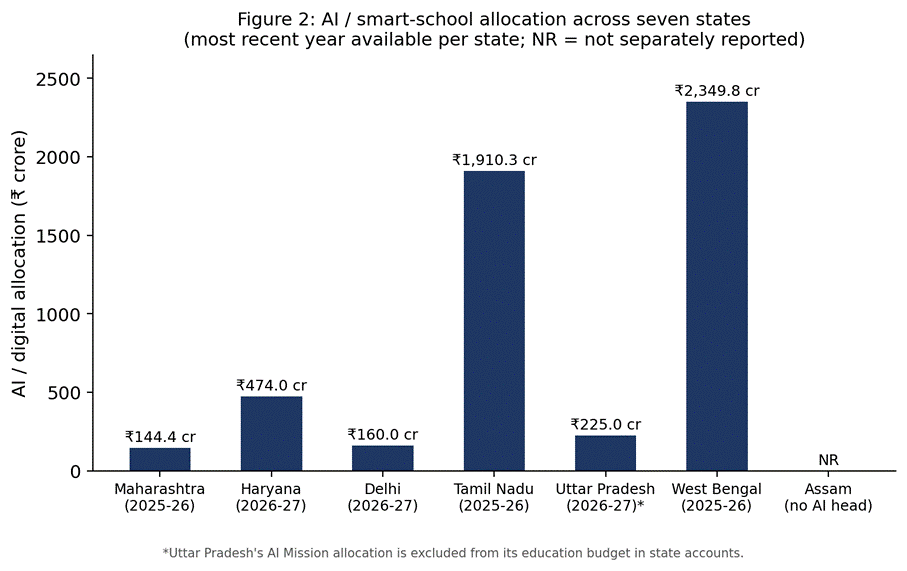
Figure 2: AI / smart-school allocation across the seven states (NR = not separately reported).
FIGURE 2 NOTE: Maharashtra and Tamil Nadu show 2025-26 because a distinct AI/digital figure for 2026-27 could not be traced in the available secondary sources, although both states have since published their overall 2026-27 budgets. Thus, the year labels reflect the latest identifiable AI/digital figure available for each state and should not be read as a common-year comparison.
Figure 2 uses the most recent year available per state, rather than a common reference year. Five of the seven states- Haryana, Delhi, Uttar Pradesh, West Bengal and Assam show 2026-27 figures because their most recent budget documents, as covered in available secondary sources, separately identify an AI or digital-specific line item for that year. Maharashtra and Tamil Nadu also have the smallest Tier A+B Digital Priority Ratios in the sample (0.13% and 0.03%, respectively), meaning the older year-label coincides with relatively low digital priority. The figure also shows that a larger overall or education budget does not automatically translate into a larger AI allocation. Uttar Pradesh has the largest total state expenditure among the seven at approximately ₹8,51,000 crore in 2026-27, yet its ₹225 crore AI Mission is under 0.03% of total expenditure and is excluded from education spending altogether, Maharashtra shows a similar mismatch. West Bengal records the largest identifiable digital allocation, although this is a broader digital/modernisation proxy rather than a directly comparable AI-specific figure. Delhi combines the highest education-budget priority (19%) with a clear utilisation gap, spending only 0.07% and later 6.7% of earlier digital-classroom allocations. Overall, Figure 2 reflects the same gap between NEP 2020’s emphasis on AI-enabled infrastructure and the level and visibility of actual financial commitment.
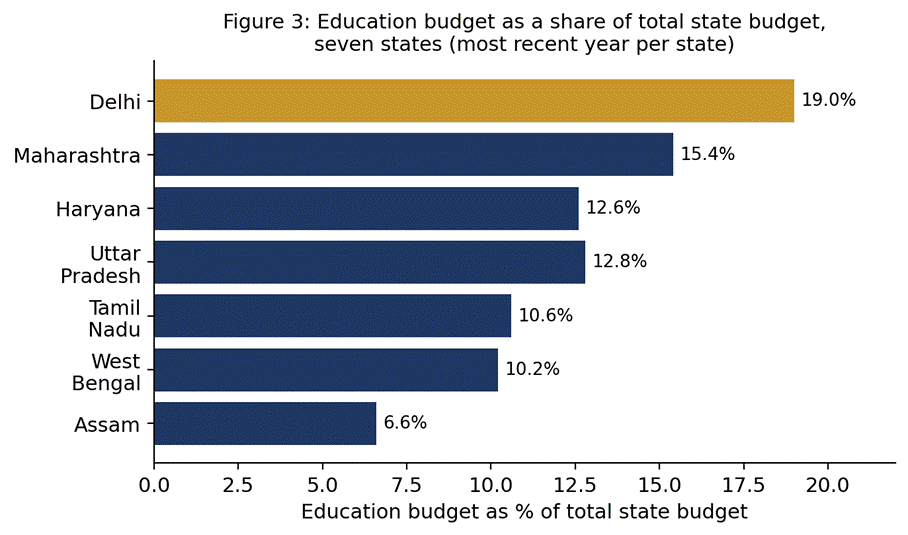
Figure 3: Education budget as a share of total state budget, seven states (most recent year per state). Compiled from Table 2.
4.4 Implementation Gaps and Central Fund Flow
Where both allocation and spend or release figures are available, they diverge sharply. Tamil Nadu’s central Samagra Shiksha release rate fell from 88.3% in 2023-24 to 4.6% in 2025-26 (Careers360, 2026c), and West Bengal has received zero central PM POSHAN funds since 2023-24, evidence of money not reaching states from the Centre. Delhi and Maharashtra, by contrast, show low utilisation of funds states themselves controlled. Low utilisation therefore cannot always be read as a state-level failure; allocation, release and expenditure are three separate stages.
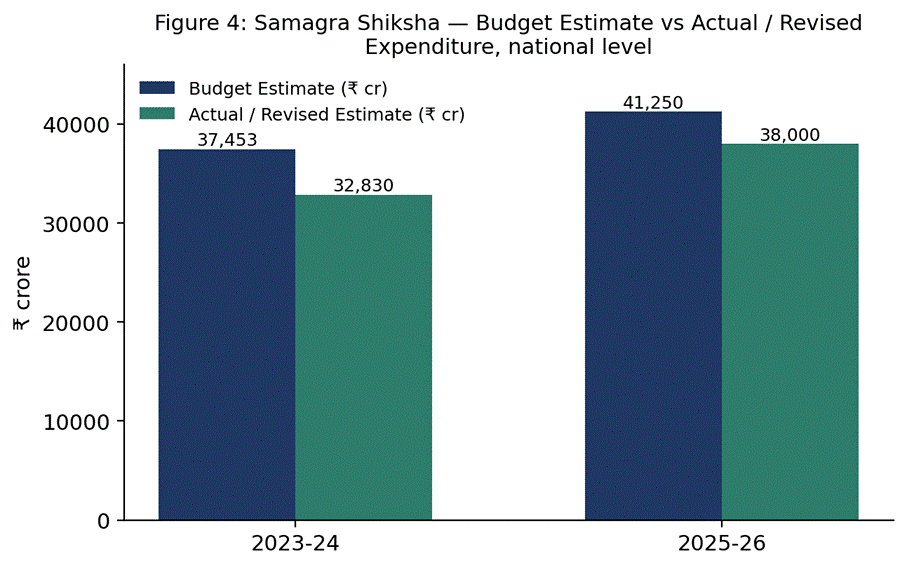
Figure 4: Samagra Shiksha — Budget Estimate vs Actual / Revised expenditure, national level. Source: Education for All in India (2025).
4.5 Relationship Between Expenditure and Functional Infrastructure
The gap is directly tied by pairing each state’s Digital Priority Ratio (Tier A+B, the only tier that is genuinely comparable across states) against UDISE+ 2024-25 functional-infrastructure indicators for the same seven states, drawn from a single Ministry of Education release.
Table 3: UDISE+ 2024-25 school infrastructure indicators, seven states.
|
State |
Total Schools (UDISE+ 2024-25) |
With Computer Facility (%) |
With Functional Computer (%) |
With Internet Facility (%) |
|
Uttar Pradesh |
2,62,358 |
60.1% |
51.3% |
45.9% |
|
Maharashtra |
1,08,250 |
82.5% |
76.7% |
72.1% |
|
Tamil Nadu |
57,935 |
92.6% |
91.6% |
84.9% |
|
Haryana |
23,494 |
97.3% |
95.6% |
78.9% |
|
West Bengal |
93,715 |
25.1% |
24.2% |
18.6% |
|
Delhi |
5,556 |
99.9% |
99.9% |
100.0% |
|
Assam |
55,283 |
78.7% |
66.7% |
87.2% |
A Spearman rank correlation between the Digital Priority Ratio (Tier A+B) and the share of schools with a functional computer gives ρ = +0.68 (p = 0.09, n = 7): a positive association in the expected direction, but not statistically significant at conventional thresholds given the very small sample. Using rupees of Tier A+B allocation per school instead of the ratio sharpens this to ρ = +0.79 (p = 0.03, n = 7). A leave-one-state-out check shows this second correlation stays positive and moderately strong across every possible exclusion (ρ ranging from +0.67 to +0.93), so it is not driven by a single outlier state, although with n = 7 removing any one state still changes the estimate substantially in absolute terms. Against internet-facility rates, the same ratios show weaker and less consistent associations (ρ between +0.18 and +0.64 depending on specification, none reaching conventional significance).
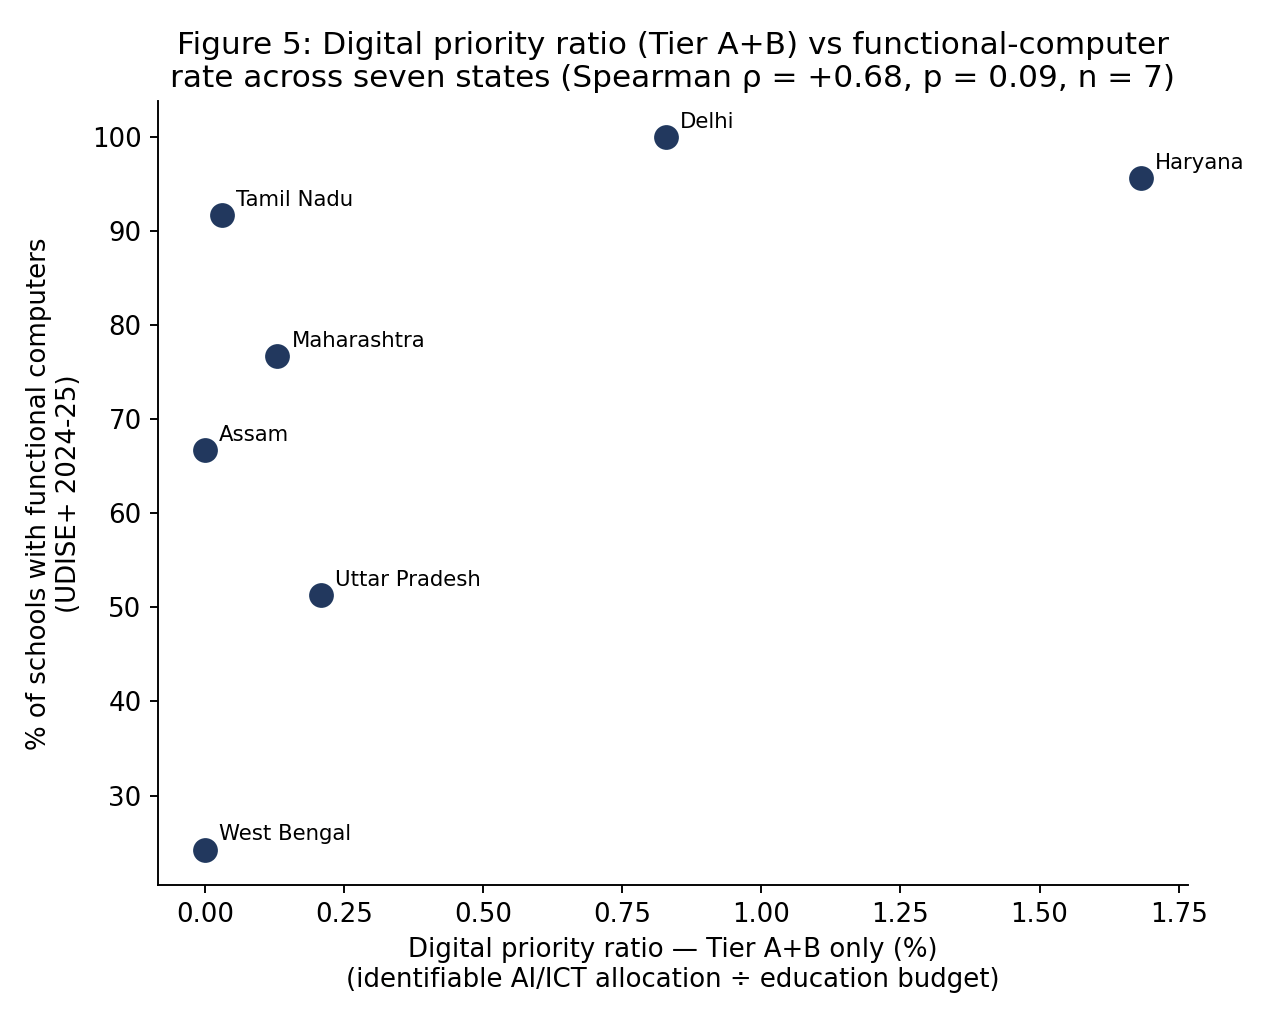
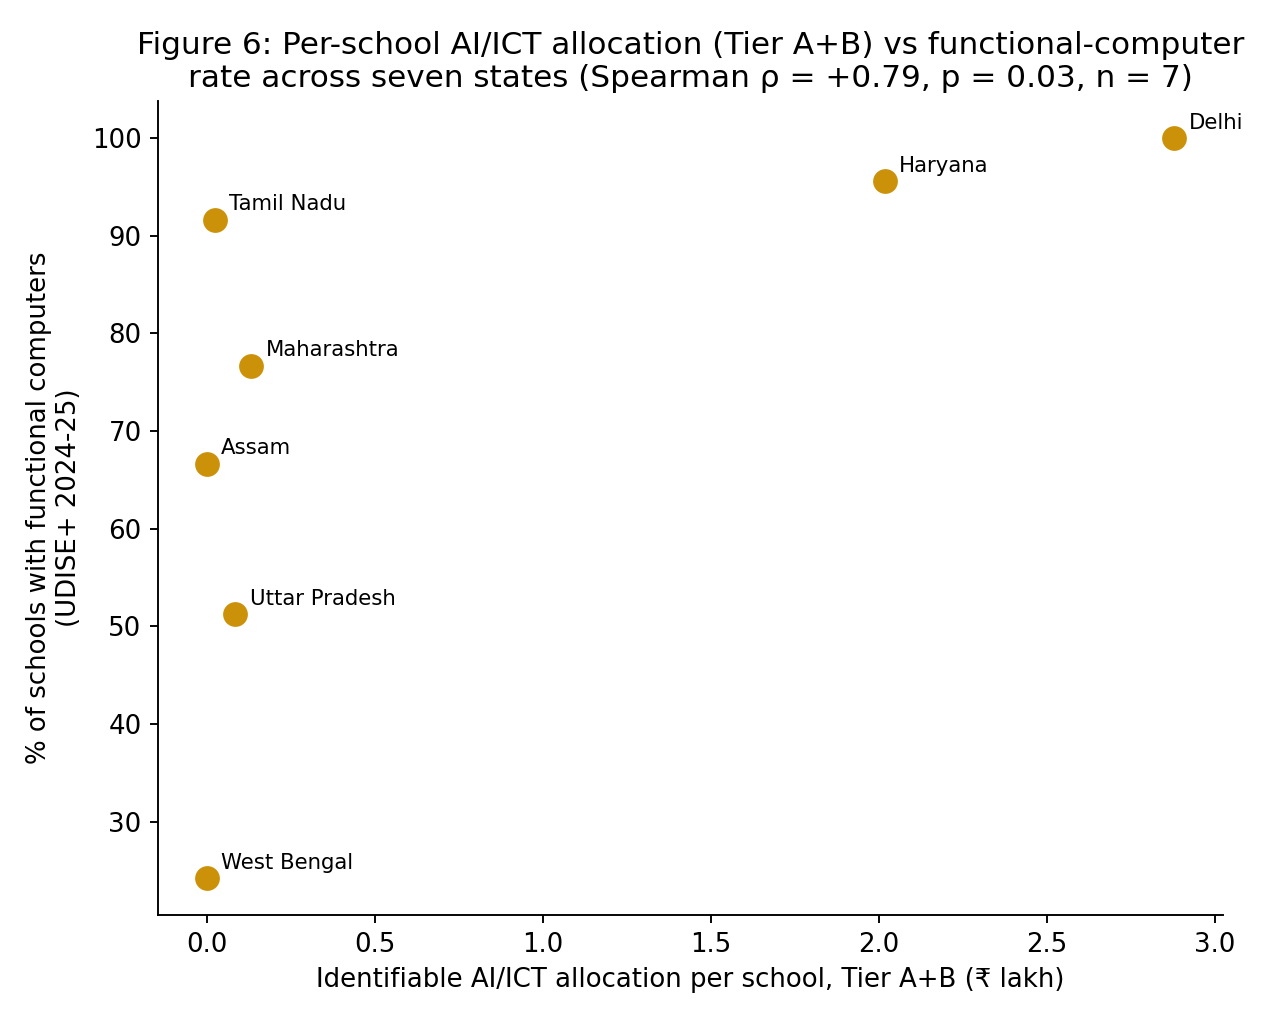
Three points of interpretation follow. First, the direction of the association is consistent with the policy expectation that identifiable AI/ICT spending accompanies better-functioning computer infrastructure: Delhi and Haryana combine relatively high Tier A+B priority with the highest functional-computer rates in the sample (99.9% and 95.6% respectively), while West Bengal and Assam, which report no Tier A or Tier B allocation at all, sit at or near the bottom on functional-computer rate (24.2% and 66.7%). Second, this pattern is not conclusive: Uttar Pradesh has a Tier A allocation but the second-lowest functional-computer rate (51.3%), and Tamil Nadu combines the second-highest functional-computer rate (91.6%) with one of the smallest Tier A+B ratios, because most of its digital spending sits in Tier C (Samagra Shiksha-linked, not AI-specific). Third, correlation across seven purposively selected states, using one year of budget data per state, cannot establish that AI/ICT spending caused better infrastructure, or rule out that both are driven by a state’s general administrative capacity or fiscal health- a possibility the literature reviewed in Chapter 2 (Theme 3) also raises. The higher, more narrowly and consistently defined digital/AI spending is associated with better functional computer infrastructure in this sample, but the relationship is indicative rather than statistically confirmed, and Tier-C spending in particular shows no clear relationship with infrastructure outcomes at all.
4.6 Administrative and Institutional Factors
This study was not designed to collect new primary evidence on administration inside state education departments, so this section synthesises the literature reviewed in Chapter 2 against the funding and infrastructure patterns documented in Sections 4.3 to 4.5, rather than presenting new fieldwork.
Three factors recur. First, fund release and utilisation, not allocation, appear to be the binding constraint in several states: Tamil Nadu’s Samagra Shiksha release rate fell from 88.3% to 4.6% between 2023-24 and 2025-26 even as its Tier C digital allocation grew, and West Bengal’s central PM POSHAN funds stopped entirely after 2023-24 despite the state recording the largest Tier C figure in this sample. This matches Kundu’s (2018) pre-NEP finding that allocation and expenditure diverge, and the Standing Committee on Education’s (2025) national finding, reported by PRS (2026b), that a large share of funds are typically spent only in the last quarter of the financial year. Second, bureaucratic and institutional culture is repeatedly identified in the West Bengal literature specifically (Datta & Mete, 2024; Shankar et al., 2024) as shaping whether computers purchased under a scheme are actually deployed for teaching, which is consistent with West Bengal’s low functional-computer rate (24.2%) despite its large Tier C allocation -the gap between having a computer (25.1% of schools) and having a functional one for teaching (24.2%) is in fact small in West Bengal, suggesting the shortfall, there is more about the initial scale of provisioning than about equipment falling into disuse. Third, classification and reporting practice itself is an administrative factor: Uttar Pradesh’s exclusion of its AI Mission allocation from the education budget, and Assam’s absence of any AI-specific budget head, are decisions made inside state finance departments about how to present spending, and they limit what any funding-infrastructure comparison, including the one in Section 4.5, can show for those two states specifically.
Taken together, this synthesis suggests that budget allocation is a necessary but not sufficient condition for functional infrastructure, and that release mechanisms, institutional culture, and reporting practice -none of which are captured by the allocation figures in Table 2, plausibly account for much of the state-to-state variation that allocation alone does not explain. This remains an interpretation drawn from existing literature and the patterns in this dataset, not a finding independently tested with new administrative data, and it should be read as a direction for future primary research rather than a settled conclusion.
Chapter 5 – FINDINGS
1. AI funding remains a recent and limited component of education spending: The Union-level analysis shows that education spending increased in absolute terms after NEP 2020, but its share of the overall Union Budget did not increase consistently. A separate AI-in-education allocation emerged only from 2025–26, with the Centre of Excellence in AI for Education representing approximately 0.36% of the Union education budget in 2026–27. This indicates that dedicated AI funding remains limited and inconsistently reported.
2. State-level AI and digital allocations are uneven and do not correspond directly to the size of education budgets: The seven-state comparison shows no consistent pattern in which states with larger education budgets allocate more to AI or digital infrastructure. The separation of Tier A, B and C also shows differences in the scale and nature of reported allocations.
3. AI and digital investment is not uniformly identifiable within state budgets: States differ in how they classify and report technology-related expenditure. West Bengal’s ₹2,349.78 crore allocation covers broader digital and modernisation infrastructure, while Assam reports no separate AI budget head and instead has a combined school capital outlay covering classrooms, laboratories and digital infrastructure. Tamil Nadu also combines its dedicated AI allocation with wider Samagra Shiksha spending. Therefore, the absence of a separately reported Tier A or Tier B allocation cannot be assumed to mean zero AI or digital investment.
4. Allocation does not necessarily translate into utilisation or implementation: Delhi, despite allocating approximately 19% of its 2026-27 budget to education, recorded utilisation rates of only 0.07% and 6.7% in earlier digital-classroom schemes. At the national level, Samagra Shiksha also recorded a 12.3% gap between actual expenditure in 2023–24 and the comparable revised estimate for 2024–25. Thus, higher allocation alone does not demonstrate effective implementation.
5. Fund release creates an additional implementation constraint: State implementation can also be affected by the release of centrally sponsored funds. Tamil Nadu’s Samagra Shiksha release rate declined from 88.3% in 2023–24 to 4.6% in 2025-26, while West Bengal received no PM POSHAN central funds after 2023–24. This demonstrates that allocation, release and expenditure are separate stages in the funding process.
6. The study does not establish a consistent relationship between higher funding and better functional infrastructure: States with relatively stronger digital infrastructure, such as Maharashtra and Haryana, do not consistently show higher AI-specific allocations. However, comparable school-level expenditure and functionality data are not available across all seven states. The findings therefore do not establish that higher spending produces better infrastructure; they indicate the need to examine budgetary investment alongside actual infrastructure functionality and use.
7. Overall, the evidence reveals a gap between policy ambition and measurable financial and implementation outcomes: NEP 2020 has established a strong policy emphasis on AI and technology-enabled education, but dedicated AI funding remains recent, uneven and differently reported across states. The study shows that allocation, fund release, expenditure and infrastructure functionality are distinct measures. The available evidence therefore supports assessing differences in the scale, prioritisation and visibility of public investment rather than ranking states according to AI implementation success.
Chapter 6 – POLICY RECOMMENDATION
Based on these findings, the ministry of education, state education departments and state finance departments should establish a more consistent framework for identifying and reporting expenditure on digital ICT, smart school and AI related education.
- Standardise budget reporting: The Ministry of Education, state education departments, and finance departments should establish common categories for reporting expenditure on digital ICT, smart schools, and AI-related education.
- Adopt dedicated and phased funding: States should provide phased funding for digital education, prioritising electricity, internet connectivity, functional ICT facilities, and maintenance before advanced AI applications.
- Use need-based funding: Funding should be based on the infrastructure and capacity gaps of schools and states rather than the overall size of their education budgets.
- Strengthen existing digital platforms: Government initiatives such as DIKSHA and NROER should be strengthened and integrated to improve access to quality digital learning resources.
- Develop regional-language content: States should develop and adapt digital learning content in regional and local languages to improve accessibility for students from diverse linguistic and socio-economic backgrounds, particularly in government schools.
- Link funding with implementation: Budget allocation should be linked to utilisation and implementation reporting, including funds released and spent, schools covered, infrastructure made functional, and teachers trained.
- Improve accountability and future research: Better reporting can help assess whether financial commitments translate into functional infrastructure. Future research should combine budget data with actual expenditure, programme-level releases, and school-level indicators of infrastructure, access, and usage.
Chapter 7 – CONCLUSION
The findings of this study highlights an important gap between the growing emphasis on technology enabled education under NEP 2020 and the way financial commitments towards AI and smart school infrastructure are reflected across states. The analysis of the seven states (West Bengal, Tamil Nadu, New Delhi, Haryana, Uttar Pradesh, Maharashtra) shows that while education budgets have generally increased, investment in digital and AI related education remains uneven in scale, unclear in classification and in visibility. Once that investment is separated into comparability tiers, the states with the largest identifiable, comparable AI-specific commitments are Haryana and Uttar Pradesh (Tier A), while West Bengal and Assam report the largest absolute digital-related figures but only as broad, non-AI-specific proxies (Tier C); Maharashtra and Uttar Pradesh, despite having among the largest overall education budgets in the sample, do not show correspondingly large AI-specific or ICT-specific allocations. These differences should not be interpreted simply as differences in actual digital spending, since the study found that states record such expenditure under different schemes, budget categories, and levels of specificity.
The central issue emerging from the study is therefore not only the amount of funding available, but the lack of consistent visibility and comparability in how digital education expenditure is planned, recorded and reported. Digital infrastructure may be included within broader school infrastructure, ICT programmes, centrally sponsored schemes or cross sectoral AI initiatives. Similarly, the absence of a separately identified allocation does not necessarily indicate an absence of digital activity, as seen in Assam and Maharashtra. This fragmented budget structure makes it difficult for policymakers and researchers to determine how much states are actually committing to technology enabled education and whether these investments are reaching schools effectively.
The findings also demonstrate that allocation alone cannot be treated as evidence of implementation. The study could not establish comparable utilisation data across the selected states, and therefore a high budgetary allocation cannot automatically be understood as effective expenditure or successful implementation. This distinction is important in light of the existing literature, which identifies inadequate infrastructure, connectivity, teacher training, digital literacy and administrative capacity as barriers to the effective adoption of technology in schools. This is relevant in India, where digital education hasn’t yet been universalised and many schools continue to face basic infrastructural constraints. Therefore, the expansion of AI should complement rather than replace efforts to address foundational educational infrastructure and access.
REFERENCES
ABP News. (2026). West Bengal budget 2026: CM Suvendu Adhikari, FM Swapan Dasgupta unveils IIT, IIM, airports and youth welfare plan. ABP Live. https://www.abplive.com/news/india/west-bengal-budget-2026-welfare-plan
AI Research News. (n.d.). West Bengal’s ₹2,000 crore digital pivot: AI and smart classrooms take center stage in state school overhaul. https://ai-research.news/en/articles/west-bengal-s-2000-crore-digital-pivot-ai-and-smart-classrooms-take-center-stage-in-state-school-overhaul
Assam Tribune. (2026, July 11). Assam budget projects wafer-thin Rs 419-crore deficit for 2026–27. https://assamtribune.com/
Banerjee, R., Trappel, J., & Van Audenhove, L. (2024). Evaluating ‘meaningful connectivity’: Digital literacy and women in West Bengal, India. In S. Yates & E. Carmi (Eds.), Digital inclusion: International policy and research (pp. 225–248). Palgrave Macmillan. https://doi.org/10.1007/978-3-031-28930-9_11
Bhatia, S. (2026, March 24). Delhi Economic Survey 2025–26: Education spending doubles in 10 years. Hindustan Times. https://www.hindustantimes.com/Delhi2025-26
Biltrax Media. (n.d.). Tamil Nadu budget 2024–25: Key highlights and major infrastructure projects. https://media.biltrax.com/tamil-nadu-budget-2024-25-key-highlights-and-major-infrastructure-projects/
Careers360. (2025, December 3). The education ministry spent just 4% of SSA funds in Tamil Nadu for 2025–26.https://news.careers360.com/tamil-nadu-ssa-4-percent-funds-allocated-in-2025-26-samagra-shiksha-abhiyan-lok-sabha-education-ministry https://news.careers360.com/tamil-nadu
Datta, R., & Mete, J. (2024). Opportunities, challenges, and future directions for the integration of digital education into school education in West Bengal. International Journal of Research – GRANTHAALAYAH, 12(4), 88–100. https://doi.org/10.29121/granthaalayah.v12.i4.2024.5599
Department of School Education and Literacy, Ministry of Education. (2025). Minutes of the Project Approval Board meeting on Annual Work Plan and Budget 2025–26 under Samagra Shiksha for the State of West Bengal. Government of India. https://dsel.education.gov.in/WB-2526
Deshmukh, R. (2026). Digital literacy and access to online education in rural Maharashtra: A study of learner experiences and infrastructural gap.https://www.ijmeer.com/article-v1i1p04.html
Diana, P. D., Khan, A. A., Khan, M. A., Rekha, V., Venkatachari, K., & Osei-Asiamah, J. (2024). AI-enhanced analysis of budgeting, procurement, and financial recording practices in public secondary schools in India. Forum for Linguistic Studies, 6(2). https://www.researchgate.net/publication/391480569_AI-ENHANCED_ANALYSIS_OF_BUDGETING_PROCUREMENT_AND_FINANCIAL_RECORDING_PRACTICES_IN_PUBLIC_SECONDARY_SCHOOLS_IN_INDIA
Directorate of Welfare of Scheduled Caste & Backward Classes, Government of Haryana. (2020–2024). Budget at a glance and budget & expenditure reports (2020–21 to 2023–24). https://haryanascbc.gov.in/budget-expenditure
Finance Department, Government of Haryana. (2020–2027). Haryana budget documents and financial statements (2020–21 to 2026–27). https://finhry.gov.in/
Finance Department, Government of NCT of Delhi. (2026). Budget at a glance. https://finance.delhi.gov.in/finance/budget-glance
Godase, M. (2025). Impact of AI in the Indian education system. SSRN. https://doi.org/10.2139/ssrn.5219491
Government of Haryana. (2026). Haryana budget 2026–27 at a glance. https://cdnbbsr.s3waas.gov.in/pdf
Government of Uttar Pradesh. (2026). Uttar Pradesh budget 2026–27: Budget documents and budgethighlights.https://prsindia.org/files/budget/budget_state/uttar-pradesh/2026/Budget_Analysis_2026-27-UP.pdf
Government of West Bengal, Finance Department. (2026). Budget speech 2026–2027. https://finance.wb.gov.in/writereaddata/Budget_Publication/2026_bp31.pdf
GovtEmpDiary. (2022, March). Tamil Nadu budget highlights 2022–23. https://govtempdiary.com/tamil-nadu-budget-highlights-2022-23
India Today NE. (2026, July 11). Assam’s budget 2026–27 is high on ambition but tight on funds. https://www.indiatodayne.in/opinion/assams-budget-2026-27
K, K., & Joshith, V. P. (2025). Unleashing the power of AI: Revolutionising Indian classrooms with AI-driven pedagogical breakthroughs. Indian Journal of Educational Technology, 7(2), 353–365. https://journals.ncert.gov.in/IJET/article/view/1412
Karan, B., & Angadi, G. R. (2023). Artificial intelligence integration into school education: A review of Indian and foreign perspectives. Millennial Asia, 16(1), 173–199. https://doi.org/10.1177/09763996231158229
Khan, N. A., Ahmad, M., Akhtar, M. M., Rajeyyagari, S., & Siddiqi, A. M. U. (2025). Transformative impact of artificial intelligence on higher education: A comprehensive analysis of pedagogical innovation, institutional transformation, and future learning ecosystems. SSRN Electronic Journal. https://doi.org/10.2139/ssrn.5782362
Kumar, A. (2021). New Education Policy (NEP) 2020: A roadmap for India 2.0. Journal of Advances and Scholarly Researches in Allied Education, 18(2), 110–115.https://digitalcommons.usf.edu/m3publishing/vol3/iss2021/36/
Kundu, P. (2018). Budgeting for school education: What has changed and what has not?—Analysis of six states in the 14th Finance Commission recommendation period. Centre for Budget and Governance Accountability & Child Rights and You.https://www.cbgaindia.org/study-report/budgeting-school-education-changed-not/
Malviya, S. B. (2025). Unlocking the future classroom: Exploring the landscape of digital education in India. International Journal of Educational Research and Development, 14(1), 45–58.https://scholarcave.com/index.php/isrn/article/view/138
Meena, N. (2025). Integration of technology and digital learning under NEP 2020: Opportunities and barriers. Journal of Digital Educational Technology, 5(1), e2501.https://ijrt.org/j/article/view/572
Mehta, A. C. (2025, February 4). Analysis of Department of School Education budget allocations (2025–2026). Education for All in India. https://educationforallinindia.com/2025-2026
Ministry of Education. (2020). National education policy 2020. Government of India.https://static.pib.gov.in/WriteReadData/userfiles/NEP_Final_English_0.pdf
Ministry of Education. (2021). National Digital Education Architecture (NDEAR). Government of India.https://www.pib.gov.in/PressReleaseIframePage.aspx?PRID=1696880®=48&lang=2
Ministry of Education, Government of India. (2025). Centre of Excellence (CoE) in AI for education. https://www.pib.gov.in/PressReleasePage.aspx?PRID=2295017®=48&lang=2
Moharana, S. (2025). Prospects of artificial intelligence (AI) and personalized learning in inclusive education integrated to NEP-2020. Asian Journal of Education and Social Studies, 51(4), 109–116.https://journalajess.com/index.php/AJESS/article/view/1852
News9Live. (n.d.). Tamil Nadu budget puts AI, digital skills and Gen Z at centre of growth. https://www.news9live.com/state/tamil-nadu/tamil-nadu-budget-puts-ai-digital-skills-and-gen-z-at-centre-of-growth-plan-2996859
News On AIR. (2026, March 2). Haryana Finance Minister Nayab Singh Saini presents 2026–27 budget of over ₹2.23 lakh crore [Press release]. Government of India. https://www.newsonair.gov.in/haryana
Nishali, B., & Malini, S. (2025). An assessment of the effectiveness of artificial intelligence (AI) tools in teacher training and development in Chennai City. Catalyst, 3 (Special Edition on Artificial Intelligence). Ethiraj Centre for Research, Innovation and Creativity, Ethiraj College for Women.https://www.researchgate.net/publication/389706998_An_Assessment_of_the_Effectiveness_of_Artificial_Intelligence_AI_Tools_in_Teacher_Training_and_Development_in_Chennai_City
Planning Department, Government of NCT of Delhi. (2025). Highlights of budget 2025–26. https://delhiplanning.delhi.gov.in/planning/2025-26
Planning Department, Government of NCT of Delhi. (2026). Highlights of budget 2026–27. https://prsindia.org/files/budget/budget_state/delhi/2026/Budget_Analysis_2026-27-DL.pdf
Prajapati, A. B. (2025). Artificial intelligence and NEP 2020: Shaping India’s educational future. ResearchGate. https://www.researchgate.net/publication/392909284_Artificial_Intelligence_and_NEP_2020_Shaping_India’s_Educational_Future
Press Information Bureau. (2026, February 1). Union Education Minister lauds historic Budget 2026–27, calling it a Yuva Shakti driven budget [Press release]. Government of India. https://www.pib.gov.in/PressReleasePage.aspx?PRID=2221734&lang=1®=3
Pritam, B. P., & Shaikh, Z. (2024). Functional integration and utilization of technologies in school education with reference to regional disparity in India. Discover Global Society, 2, Article 62. https://doi.org/10.1007/s44282-024-00087-z
PRS Legislative Research. (2017). Delhi budget analysis 2017–18. https://prsindia.org/budgets/states/delhi-budget-analysis-2017-18
PRS Legislative Research. (2020a). Delhi budget analysis 2020–21. https://prsindia.org/budgets/states/delhi-budget-analysis-2020-21
PRS Legislative Research. (2020b). Tamil Nadu budget analysis 2020–21. https://prsindia.org/budgets/states/tamil-nadu-budget-analysis-2020-21
PRS Legislative Research. (2020c). West Bengal budget analysis 2020–21. https://prsindia.org/budgets/states/west-bengal-budget-analysis-2020-21
PRS Legislative Research. (2021a). Tamil Nadu budget analysis 2021–22. https://prsindia.org/budgets/states/tamil-nadu-budget-analysis-2021-22
PRS Legislative Research. (2021b). West Bengal budget analysis 2021–22. https://prsindia.org/budgets/states/west-bengal-budget-analysis-2021-22
PRS Legislative Research. (2022a). Tamil Nadu budget analysis 2022–23. https://prsindia.org/budgets/states/tamil-nadu-budget-analysis-2022-23
PRS Legislative Research. (2022b). West Bengal budget analysis 2022–23. https://prsindia.org/budgets/states/west-bengal-budget-analysis-2022-23
PRS Legislative Research. (2023a). West Bengal budget analysis 2023–24. https://prsindia.org/budgets/states/west-bengal-budget-analysis-2023-24
PRS Legislative Research. (2023b). Delhi budget analysis 2023–24. https://prsindia.org/budgets/states/delhi-budget-analysis-2023-24
PRS Legislative Research. (2024a). Delhi budget analysis 2024–25. https://prsindia.org/budgets/states/delhi-budget-analysis-2024-25
PRS Legislative Research. (2024b). Tamil Nadu budget analysis 2024–25. https://prsindia.org/budgets/states/tamil-nadu-budget-analysis-2024-25
PRS Legislative Research. (2024c). West Bengal budget analysis 2024–25. https://prsindia.org/budgets/states/west-bengal-budget-analysis-2024-25
PRS Legislative Research. (2025a). Tamil Nadu budget analysis 2025–26. https://prsindia.org/budgets/states/tamil-nadu-budget-analysis-2025-26
PRS Legislative Research. (2025b). Uttar Pradesh budget analysis 2025–26.
https://prsindia.org/files/budget/budget_state/uttar-pradesh/2025/UP_Budget_Analysis_2025-26.pdf
PRS Legislative Research. (2025c). West Bengal budget analysis 2025–26. https://prsindia.org/budgets/states/west-bengal-budget-analysis-2025-26
PRS Legislative Research. (2026a). Delhi budget analysis 2026–27.
https://prsindia.org/budgets/states/delhi-budget-analysis-2026-27
PRS Legislative Research. (2026b). Demand for Grants 2026–27 analysis: Education.
demand-for-grants-2026-27-analysis-education
PRS Legislative Research. (2026c). Maharashtra budget analysis 2026–27.
https://prsindia.org/budgets/states/maharashtra-budget-analysis-2026-27
PRS Legislative Research. (2026d). Uttar Pradesh budget analysis 2026–27.
https://prsindia.org/files/budget/budget_state/uttar-pradesh/2026/Budget_Analysis_2026-27-UP.pdf
PRS Legislative Research. (2026e). West Bengal budget analysis 2026–27.
https://prsindia.org/budgets/states/west-bengal-budget-analysis-2026-27
Rout, A. P. (2025, March 28). Assam budget analysis 2025–26. PRS Legislative Research.
https://prsindia.org/budgets/states/assam-budget-analysis-2025-26
Saranya, K. (2024, January). The role of artificial intelligence in implementing the National Education Policy-2020: Challenges and opportunities. Indian Journal of Integrated Research in Law, V(V). https://ijirl.com/wp-content/uploads/2025/09/THE-ROLE-OF-ARTIFICIAL-INTELLIGENCE-IN-IMPLEMENTING-THE-NATIONAL-EDUCATION-POLICY-2020-CHALLENGES-AND-OPPORTUNITIES.pdf
Shankar, V. K., Sahni, R., & Roy, K. K. (2024). Introducing computers in Indian schools: Institutional resistances and the making of a digital divide. Learning, Media and Technology, 49(1), 35–48. https://www.tandfonline.com/doi/full/10.1080/17439884.2023.2233898
Sharma, S. (2026, March 24). Delhi budget FY27 strengthens education with student schemes and digital expansion. The Times of India. https://timesofindia.indiatimes.com/education/news/delhi-budget-fy27-strengthens-ed ucation-with-student-schemes-and-digital-expansion/articleshow/129772779.cms
The Covai Mail. (n.d.). CII welcomes Tamil Nadu budget 2026–27, calls it growth-focused. https://covaimail.com/cii-welcomes-tamil-nadu-budget-2026-27-calls-it-growth-focused
The Statesman. (n.d.). Bengal forfeited 10,000 crore in central education aid by skipping NEP: Union Education minister. https://www.thestatesman.com/bengal-forfeited-10000-crore-in-central-education-aid-by-skipping-nep-union-education-minister
The Tribune. (2026, March 3). Haryana budget: Future-ready skills, research, student welfare focal points for education. https://www.tribuneindia.com/news/haryana
Times Now. (n.d.). West Bengal to introduce smart classrooms, AI education in government schools. https://www.timesnownews.com/education/west-bengal-to-introduce-smart-classrooms-ai-education-in-government-schools-article-155217867
TNPSC Thervupettagam. (n.d.-a). Tamil Nadu budget 2024–25 Part-01 (2025–26). https://www.tnpscthervupettagam.com/articles-detail/tamil-nadu-budget-2024-25-part-01
TNPSC Thervupettagam. (n.d.-b). Tamil Nadu budget 2024–25 Part-02. https://www.tnpscthervupettagam.com/articles-detail/tamil-nadu-budget-2024-25-part-02
Tripathi, T., Sharma, S. R., Singh, V., Bhargava, P., & Raj, C. (2025). Teaching and learning with AI: A qualitative study on K–12 teachers’ use and engagement with artificialintelligence. Frontiers in Education, 10, 1651217. https://doi.org/10.3389/feduc.2025.1651217
Verma, S. (2025). Leveraging technology for transformative teaching and learning in alignment with NEP 2020. International Journal of Social Impact, 10(1), 1–5.
https://ijsi.in/articles/1001s01/
Wilson, N. M. (2026). Speech of the Minister for Finance Planning and Development Dr. N. Marie Wilson: Revised budget 2026–27 speech [Budget speech]. https://civilengghub.in/wp-content/uploads/2026/08/SK-TamilNadu-Budget-2026-2027-Part-I-English-Date.05.08.2026.pdf