Authors:
Nandini Kanodia, Anushka Satija, Sneha Bhattacharjee, Aastha Jain, Bhagyashri Chaturvedi, Hashmeet Kaur, Manasa Thuduri, Mehak Chauhan, Nandani Singh, Riya Pal, Siya Jhamb, Zoya Wakeel
Abstract
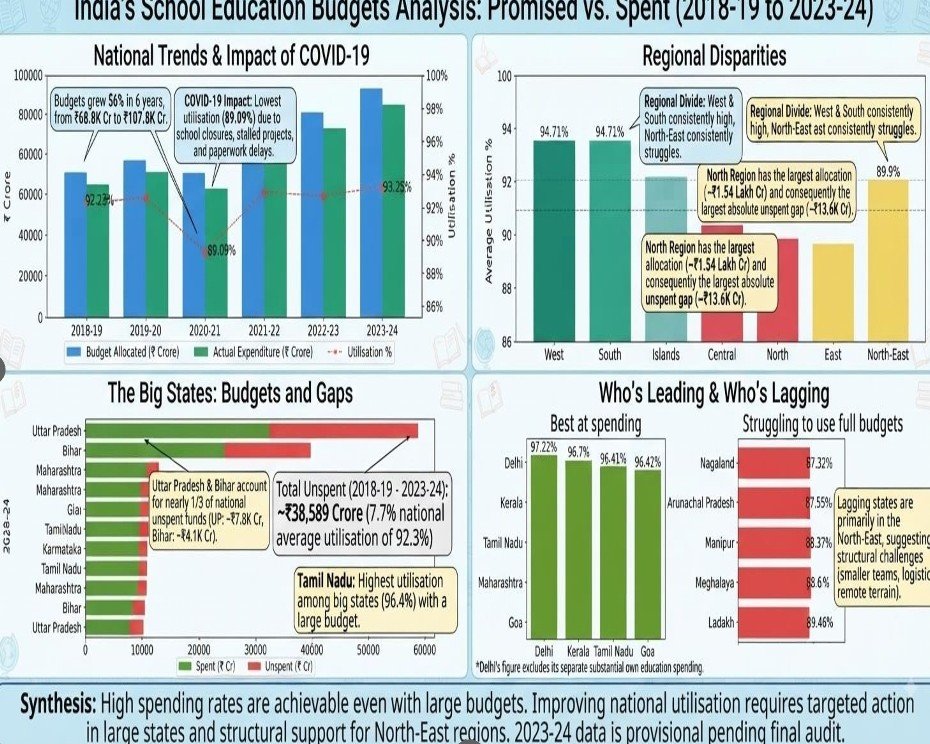
The social and economic development of India is heavily reliant on its education system which continues to be hitched by persistent structural challenges. Though the nation has a robust educational setup, most schools lack basic facilities and qualified teaching personnel. This research states the persistent gap between the estimated budget and the actual expenditure in the sector during the period from 2018-19 to 2023-24. The research employed a deductive mixed methods approach addressing secondary data in governmental budgets and reports following purposive sampling. The result states that the fiscal gap in deliveries has increased because the government has failed to distribute as much as Rs. 43010 crores. Much more serious is the gap within the regions as while Southern and Western states used 94.70% of allocated budget, the Northern and Eastern regions spent only 89.90% of the total.
Expenditure on education cannot be more than 4% of GDP, which level is much lower than the prescribed 6%. It is further noticed that the money spent on the development of human capital development is practically negligible. The research indicates that just increasing the financial allocations is not enough, and it is necessary to take in account the root causes of the inefficiencies of the administration.
Keywords: Education Financing, Fiscal Federalism, Public Expenditure, Budget Utilization, Regional Disparities
Introduction
Education plays a fundamental role in building an individual’s life and shaping a country’s holistic development. In a developing country like India, the education system notably determines the national growth of the country especially socially and economically.
The Indian education system has witnessed significant progress at different levels over the years through the introduction and implementation of various government schemes and legislation. For example, Sarva Shiksha Abhiyan, introduced in 2001, has been responsible for effectively increasing the gross enrolment ratio in elementary schools throughout India. It is also stated to produce a talented global workforce specifically through the Indian Institutes of Technology and Management employed in leading international corporations and firms.
Correspondingly, India has the third largest higher education system in the world, however, it faces systemic challenges and structural gaps in delivering accessible and affordable education to its citizens. It can be argued on the basis of current incidents taking place in the country. For instance, recently, students of Sarvodaya Inter College in the state of Uttar Pradesh’s district of Fatehpur organized a protest demanding basic school facilities. They complained of lack of electricity and fans in the school premises along with the issues of unsafe water, unclean toilets, broken desks and poor meals being delivered to them. Another such incident occurred in the district of Sitapur where reports of poor-quality and unhygienic mid-day meals in Changapur Primary School were recorded. The mid-day meal scheme, which was introduced in 1995 and operates under the PM POSHAN (PM POSHAN Shakti Nirman), observed a fall in its annual spending from over Rs. 8,400 crores in 2023-24 to nearly Rs. 8,100 crores in 2025-26 (Ministry of Education, 2026).
In addition to this, schools across the country experience severe faculty shortage and administrative hindrances. For instance, at a PM SHRI (Pradhan Mantri Schools for Rising India) government school in Mengalwa village, Jalore district, Rajasthan, widespread protests and demonstrations were mounted by the villagers and the students against the authorities for reportedly having only one teacher being responsible for over 150 students across several grades in the school. Despite the norm laid down by the education ministry for schools across the country to maintain a student-teacher ratio of around 30:1, such organizational and administrative challenges remain to persist. Therefore, it becomes imperative to address these underlying problems in the education system in order to bring substantive reforms which could facilitate the overall growth of our country. With this objective in view, the examination of discrepancies between budgetary allocations and expenditures in the education sector, specifically in a quasi-federal form of governance established in India, can serve as a crucial factor in addressing these institutional bottlenecks. Accordingly, the following research paper intends to critically analyze the budget reserved annually by the central government for ensuring the smooth functioning of the education sector in all the states and union territories of the nation spanning from the fiscal year of 2018-19 to 2023-24, and how much has actually been expended by these states and union territories, evaluating their performance comparatively over the mentioned years. The paper further seeks to qualitatively review and assess the existing literature available on the disbursement and utilization of the funds and grants-in-aid provided to different regions of the country thematically and employ deductive research methods based on the documented quantitative data extracted from government sources and publications. Consequently, the paper aims to scrutinize the collected data and figures along with published policy reports and articles, using purposive sampling method and study the variations in state-wise fiscal allotment of budget depending on the primary aspects of total geographical area and population density.
Emphasizing upon the analysis and evaluation of data, it attempts to discuss and find the determinants of successful performance and measured application of budgeted finances by some states and regions like that of Kerala as opposed to underutilized funds and subsequent poor functioning and outcome of the education sector in other states such as Uttar Pradesh irrespective of monetary allocation received by them.
Considering the broader perspective of the subject matter in focus, the paper ultimately targets at answering the following research questions:
Q1. What institutional and fiscal factors account for the lower utilization of central education grants in Northern and Eastern states compared to the higher utilization of central education grants, in Southern and Western states during 2018–19 to 2023–24?
Q2. What institutional, fiscal and governance factors explain the persistent gap between the budget allocations and actual expenditure in India’s education sector from 2019 to 2026 and what are the implications for achieving equitable and quality education?
Literature Review
Regional Disparities in Fund Utilization
Fiscal federalism is often regarded as the cornerstone of a democracy, providing the institutional scaffolding through which resources flow from the centre to the states and in turn enabling capacity building at the grassroots level. This is meant to ensure that funds allocated for sectors such as education reach their beneficiaries in a timely and complete manner.
One of the most consistent findings in recent fiscal analysis is the persistent gap between the funds proposed for school education and literacy and the funds actually delegated to the Department of School Education and Literacy. According to PRS Legislative Research’s Demand for Grants Report (2022), the government fell short of its own funding targets three years in a row, missing by Rs. 15,500 crores, then Rs. 22,700 crores, then Rs. 43,010 crores. Each year the gap got bigger, almost tripling in size. This points to a widening mismatch between what the government plans to spend on education and what it actually delivers. This mismatch, however, plays out unevenly across the country.
The contemporary utilization gap documented by PRS Legislative Research (2022) shows that Southern and Western states absorb 94.7 % of allocations while North and East states absorb 89.9 %. This difference can be explained by long‑term factors as Rao and Singh (2007) argue. They found that a state’s ability to absorb funds is shaped by investments in its bureaucracy. States that built administrative systems in earlier decades were better able to turn transfers into real spending. Thus, the recent regional utilization gap reported by PRS is not a short‑term failure, in administration. It reflects the lasting differences that Rao and Singh identified almost twenty years ago.
Scholars such as Rao and Singh (2007) argue that utilization capacity is itself a product of historical patterns of institutional investment: states that received stronger administrative infrastructure in earlier decades of planning were better positioned to absorb later increases in fund flows, creating a compounding advantage over time. Similarly, work on cooperative federalism in India points to differences in state-level bureaucratic continuity and political stability as key drivers states with more frequent changes in government or bureaucratic turnover tend to lose institutional memory needed to convert allocations into spending within the fiscal year. There is also a structural dimension: many North and East Indian states carry a disproportionate share of low-income districts, where fund utilization is further constrained by weak last-mile infrastructure, staffing shortages in the education bureaucracy, and delays in state-level matching contributions under centrally sponsored schemes.
Taken together, these findings point to a critical paradox within India’s fiscal federalism: the states that most need education funding is often the least equipped, for reasons rooted in history and institutional design, to fully utilize it. This suggests that future policy interventions need to look beyond allocation figures alone and address the underlying administrative and structural bottlenecks that perpetuate regional disparities in fund utilization.
Public Expenditure on Education in India
Researchers have sought to examine whether public expenditure on education in India is adequate and whether it is being allocated effectively. A recurring finding in the literature is that despite the well-established importance of education for human capital formation, government spending has consistently fallen short of adequate levels.
Tilak (1993, 2002), Mazumdar (1983) and De and Endow (2018) both agree that there is a long‑term shortfall when compared to the Kothari Commission’s goal of 6 % of GDP their views on the relationship between private sectors differ. Tilak’s study shows a relationship: when the government spends more it tends to stimulate household spending instead of replacing it. De and Endow’s long‑term analysis on the hand shows a structural change: by 2018–19 public spending had stopped growing and was only 3.9 % of GDP while private spending had increased to 2.7 %. Together this gives 6.6 % of GDP. It hides a growing reliance on private finance. These two perspectives highlight parts of the same financing gap. One view points to the benefits of public investment the other, to the risks of increasing privatization. Yet both point out that looking at the overall ratios does not guarantee that spending is enough or that everyone has fair access.
Empirical evidence supports this concern. De and Endow’s (2018) longitudinal analysis of public and private education expenditure across seven decades found that in 2018–19, government spending stood at 3.9% of GDP while private expenditure had risen to 2.7%, bringing combined spending to 6.6% of GDP. This aggregate figure, while nominally meeting the Kothari Commission target, masks a structural shift: private expenditure has been steadily rising even as public investment stagnates, raising equity concerns about access to quality education for lower-income households who cannot absorb rising private costs.
The relationship between public and private spending is not merely substitutive, however. Tilak’s research indicates a complementary dynamic, whereby increased government expenditure on education is associated with higher household spending as well, suggesting that public investment can crowd in, rather than crowd out, private educational spending.
The macroeconomic significance of this financing gap is well established. Tamang’s study on education expenditure and economic growth found a robust positive association between the two, a finding consistent with a broader body of literature linking human capital investment to growth outcomes.
Beyond the question of aggregate spending, concerns persist regarding expenditure quality and utilization and here the literature points to variation that is not adequately explained by expenditure figures alone. The University Grants Commission has noted that a disproportionate share of government education spending is absorbed by salaries and infrastructure maintenance, leaving limited fiscal space for research and quality enhancement. More recently, Guleria et al. (2025) identified persistent underutilization of allocated education budgets, but underutilization itself is unevenly distributed across states, and money is being spent with markedly different degrees of effectiveness depending on the region.
This regional divergence is unlikely to be explained by budgetary allocation alone; it more plausibly reflects differences in administrative and institutional capacity. States with stronger bureaucratic capacity and better-functioning public financial management systems tend to disburse and utilize allocated funds more efficiently, while states facing shortages of trained education-department personnel, weaker monitoring and audit mechanisms, or greater bureaucratic bottlenecks in fund release tend to underutilize their budgets even when allocations are adequate. India’s fiscal federalism structure compounds this: since education is a concurrent subject, the interaction between central transfers and state-level implementation capacity including the timing of fund release, conditionalities attached to centrally sponsored schemes, and state governments’ own administrative readiness to absorb funds becomes as consequential as the headline expenditure figure itself. Political economy factors, such as the priority accorded to education relative to competing demands within state budgets, may further shape this variation. This suggests that closing India’s education financing gap requires not only increased allocation but also strengthening the institutional and administrative capacity of the states that are expected to spend it.
Taken together, this literature suggests that India’s education financing challenge is multidimensional: it concerns not only the quantum of expenditure relative to GDP, but also the composition of that spending, the balance between public and private sources, and critically the institutional capacity that determines how effectively allocated funds are converted into educational outcomes across regions.
Teacher Shortage and Human Resource Constraints
The teacher shortage is where the underspending problem stops being just a number on a budget sheet and starts affecting real classrooms. It also connects directly to this review’s second research question. On the surface, the numbers look alarming. Official records report roughly 3.58 lakh vacant sanctioned teaching posts as of September 2025, with the worst shortfalls in Uttar Pradesh, Madhya Pradesh, and Karnataka (Careers360, 2025b). This figure has been repeated widely in news coverage and policy discussions as evidence of a full-blown staffing crisis.
Datta & Kingdon (2025) push back on that number, and their objection deserves attention because it is not really about counting errors. It is about what should be counted at all. When they remove enrolment figures, they consider inflated or simply fictitious, the shortage drops to around a quarter million, and in some calculations, it disappears entirely, turning into a surplus. The two sides are not just arguing over a few thousand posts; they start from different assumptions. The official count treats every sanctioned post as a genuine need, while Datta & Kingdon count only verified, actual students as the basis for teacher requirements. That single difference explains most of the gap. They also raise a practical worry: hiring permanent staff based on enrolment numbers that may not be real would create a large, ongoing cost for a benefit nobody can actually confirm.
Each method has its own drawbacks. The official, sanctioned post approach is standardized, consistent across states, comparable over time, and tied to approved staffing norms, which makes it convenient for planning and budgeting. Its weakness is that it assumes every sanctioned post still reflects real need, even where enrolment has dropped or was overstated to begin with, which can inflate the apparent shortage. Datta & Kingdon enrollment adjusted approach fixes this by anchoring the estimate to verified student numbers, arguably giving a more accurate picture of present-day need. But it brings its own vulnerability, since the estimate depends entirely on how “verified” or “fictitious” enrolment is defined, a judgment that is itself debatable. It may also understate future demand if enrollment is expected to grow, and neither method accounts for subject or grade level mismatches that can cause local shortages even when the overall numbers look balanced.
When the thin earmarking for human-resource spending is looked at as identified by PRS Legislative Research in 2022 0.2 percent of the relevant central allocation it becomes clearer when paired with Phukan and Bonia’s findings from 2022–23. Their research showed even states with high GDP faced challenges in digital-teaching readiness. This combination paints a complete institutional picture. The problem is two-first the actual amount of money set aside for personnel is very small. Second the administrative and infrastructural capacity to turn that money into real teacher deployment is uneven, across regions. Without considering both these issues earmarking and weak absorptive capacity neither the official number of vacant teaching positions nor the enrolment-adjusted estimate can be fully understood.
Put together, a different story emerges than the one usually told. The “teacher shortage” may have less to do with a real lack of available teachers and more to do with how little of the grant is earmarked for human resources, and how unevenly even that small amount is implemented. No one has yet tested either shortage estimate, the official vacancy count from Careers360 (2025b) or the enrolment adjusted figure from Aggarwal and Sharma (2025), against real grant spending data, and PRS (2022) along with Phukan and Bonia (2022 to 23) stop short of connecting their budget findings to either estimate. That is exactly the gap this review’s second research question aims to close: whether thin HR earmarking and uneven implementation, rather than the size of the vacancy number, better explains why teacher shortages look the way they do across states.
Curriculum, Learning Outcomes and Student Well – Being
India’s public spending on education is still lower than what the national education policy says it should be. The National Education Policy 2020 said that India should spend 6 percent of its GDP on education. In 2022 the government only spent about 4.10 percent of its GDP on education. This shows that there is a problem with how much money’s being spent on education and also with how well the money is being used. Just because more money is allocated for education it does not mean that it will automatically lead to education outcomes. The Ministry of Education did not spend all the money it was given with 5 percent of the budget not being used. This happened in both school education and higher education. The Parliamentary Standing Committee on Education also found that the Department of School Education and Literacy only used 59 percent of its budget by February 2025. Even though the department later used 95 percent of its budget the target budget was reduced. This shows that just because the budget is being used it does not mean that it is being used effectively.
Programmes like Samagra Shiksha and PM POSHAN are very important for education. Samagra Shiksha helps with things like school buildings and teacher training while PM POSHAN gives food to schoolchildren. If the money for these programmes is not used properly it can affect the education and well-being of the children. So, it is not about how much money is spent, but also about how well the money is used.
Some studies have found that spending money on education does not always lead to better results. This means that it is not about how much money is spent, but also about how the money is spent. Other studies have found that when the government spends money on education families are more likely to spend their own money on education. This can be good because it means that children have access to educational resources. It can also be bad if the benefits of the government spending are not shared equally among all families.
When we look at the repeated shortfalls that PRS recorded in 2022 and the mid‑year utilization numbers that the Parliamentary Standing Committee later shared a clear pattern emerges. The system often gives money than departments need yet it still shows high utilization rates once the budget is cut. This makes it hard to say that the low spending is simply management.
Research Methodology
Research Design
This study adopts a descriptive and comparative research design using a mixed-methods approach, to study “Gaps between budget and expenditure in the Indian education system from 2018-19 to 2023-24” combining quantitative analysis of budget and expenditure data with qualitative analysis of existing literature and policy documents.
Here, the descriptive component examines trends in budget allocation and expenditure across states of India while the comparative component identifies regional variations in fund utilization and their association with educational outcomes.
Research Approach
The study follows a deductive research approach, begins with existing theories and evidence on fiscal federalism, public expenditure, governance capacity, and examines whether the available budget and expenditure data support these theoretical arguments. The approach seeks to evaluate how governance factors such as administrative capacity, planning efficiency, and implementation mechanisms influence the utilization of central education grants in states and in different arenas.
Data Sources
The research is based on secondary data collected from credible government and institutional such as:
1. Ministry of Education budget and expenditure reports 2019-2024
2. PRS Legislative Research on Demands for Grants
3. National Education Policy (2020) for state’ Work on field
4. Parliamentary Standing Committee reports on actual expenditure gaps
5. Government budget documents for school education schemes
6. Published academic literature, journal articles, and policy reports
The state-wise education budget dataset covering 2018–19 to 2023–24, which provides information on allocated funds, actual expenditure, spending rates, and regional variations.
Sampling
This research relies entirely on secondary data; thus, probability sampling was not employed. Here, purposive sampling was used to select data sources that are directly relevant to the research objectives and its attributes.
The empirical analysis includes all 28 Indian states and 8 union territories for which comparable budget and expenditure data were available between 2018–19 and 2023–24 where particular attention is given to states with consistently high or low fund utilization, such as Uttar Pradesh, Bihar, Tamil Nadu, Kerala, and several North-Eastern states and others.
Data Collection
For this secondary data were collected through document analysis from government publications, policy reports, research articles, and dataset such as economic survey and budget.
The literature review was used to identify recurring themes including:
1. Regional disparities in fund utilization
2. Public expenditure on education
3. Teacher shortages and human resource constraints 4. Curriculum implementation and learning outcomes
Data Analysis
The collected data was analyzed using both descriptive statistical techniques and qualitative analysis such as –
1. Longitudinal (Time series) analysis -study tracks and analyses budgetary data over Six-year period
2 Descriptive Quantitative analysis- utilizes descriptive statistics to calculate and aggregate four primary metrics such as budget allocation, actual expenditure, unspent balance, spending utilization rate
Then graphs in the research were generated with help of calculating national /aggregate average spending rate with formulas such as
Aggregate spending Rate (%) = (total spent /allocated) *100%
The qualitative analysis involved thematic examination of academic literature and policy reports to identify governance challenges affecting fund utilization, including administrative capacity, fiscal management, implementation delays, teacher shortages, and institutional bottlenecks. The findings from both analyses were integrated to explain why some states consistently utilize education funds more effectively than others.
Limitations
This study has several limitations such as –
1. It relies exclusively on secondary data and therefore cannot establish direct causal relationships between the trends.
2. The analysis is limited to the availability and accuracy of published government datasets.
3. The budget figures for 2023–24 remain provisional and may change following the final audit.
4. The COVID-19 pandemic significantly affected expenditure during 2020–21, making comparisons across years more complex.
Ethical Considerations
The study is based entirely on publicly available secondary data and published literature and thus does not involve human participants, surveys, or interviews, and therefore formal ethical clearance was not required. Every effort has been made to accurately represent the original data and properly acknowledge all government reports etc. The research maintains academic integrity by ensuring transparency in data collection, analysis, and citation.
Discussion & Findings
The overall analysis of the findings on budget and expenditure in the Indian Education System illustrates a persistent and widening gap in proposing funds and their actual implementation. The data by PRS Legislative Research’s Demand for Grants Report (2022), represents the government’s shortcomings of meeting its own funding targets for straight three consecutive years with Rs.15,500 crore, Rs. 22,700 crore and Rs. 43,010 crores respectively. A structural imbalance in budget intent and its fiscal delivery. Regional disparities among the states represent further imbalance in the system. Where the states of West and South achieved spending 94.7% of their funds on an average. Whereas the states in the North and East managed to achieve just about 89.9 percent. These variations showcase a pattern of framing of administrative capacity and their mechanisms, where states with strong institutional framework succeed in converting allocations in effective educational outcomes, On the other hand there exists some weaker states which struggle to use the available resources. Together they spent 6.6% of GDP on education. The public expenditure on education also pertains to be considerably low as illustrated by the Kothari Commission.
Where in 2018-19 the government spent 3.9% of GDP on education and the private sector spent 2.7%. However, the rising trend of spending of funds in education by the private sector looks concerning as many households with bare minimum face financial barriers. The government spending is indeed there but research shows how most of it is absorbed in conditioning the salaries and maintenance of infrastructure rather than improving the quality of education. Furthermore, the shortage of teachers in institutions is another significant loophole that invites a closer scrutiny.
The official statistics report about the vacancies in sanctioned teaching posts to be at a level of approximately 3.58 lakh as of September 2025, with the largest gaps recorded in Uttar Pradesh, Madhya Pradesh, and Karnataka (Careers360, 2025b). However, Datta & Kingdon (2025) take a different view, arguing that after adjusting for the over-inflated enrollments, the shortage would only be a quarter of a lakh, whereas their calculation using “fictitious” enrollments yields an estimate that is either close to zero or even negative.
Consequently, the controversy over the shortage can be interpreted as arising from different perspectives on how to adjust the imbalances in enrollment growth and staffing levels. In addition, the data from the PRS Legislative Research (2022) indicates that only 0.2 percent of the allocation reserved for the centrally sponsored scheme in the 2022-23 financial year, or Rs 127 crore, was directly related to personnel costs, which is a smaller share than in the previous fiscal year. Furthermore, the report by Phukan and Bonia (2022-23) highlights that in several states with high GDP, such a lag in digital infrastructure capacity contributed to the lower-than-planned uptake of personnel-related provisions, which suggests that the current level of funding authorization is not fully utilized in practice. Overall, the evidence implies that the issue of shortage is partly a matter of perspective and is closely linked to the level of funding for human resources, which is both insufficient and distributed unevenly between states.
Conclusion
This study evaluated the structural and operational discrepancies between budgetary allocations and actual expenditures in the Indian education system from 2018 – 19 to 2023 -24. The empirical and thematic findings highlight that the prevailing difficulties within the Indian educational landscape transcend basic resource scarcities, reflecting deeper systemic imbalances in budgetary implementation, institutional frameworks and administrative management.
● Persistent Fiscal Mismatch: While the National Education Policy (NEP) 2020 promotes a public spending benchmark of 6% of GDP, the actual fiscal commitment has remained stagnant between 3.9% and 4.1%. This discrepancy is further underscored by the government’s inability to meet central funding objectives, as evidenced by an unspent deficit that escalated from ₹15,500 crore to ₹43,010 crore across three successive financial years.
● Regional Administrative Disparities: The efficacy of fund utilization varies significantly across the Indian landscape. Southern and Western states demonstrated superior absorption capacity, utilizing approximately 94.7% of their allocations by leveraging established institutional frameworks. In contrast, states in the North and East averaged a lower utilization rate of 89.9%, a trend largely attributed to fragile administrative machinery and protracted bureaucratic processes.
● Imbalance in Budget Composition: A disproportionate share of public educational expenditure is consumed by recurring administrative liabilities, primarily teacher salaries and basic maintenance, rather than capital investments in quality enhancements or digital modernization. This structural imbalance is highlighted by the fact that only 0.2% of centrally sponsored scheme allocations were directed toward personnel costs in the 2022–23 fiscal period.
● Structural Constraints and Outcome Impacts: The appearance of fiscal compliance is frequently obscured by year-end budgetary retrenchments rather than genuine operational efficiency. Such expenditure lags are intrinsically linked to persistent systemic crises, including a significant teaching vacancy level—officially estimated at 3.58 lakh—alongside acute facility shortages and reduced financial support for essential equity programs like PM POSHAN.
Significance and Policy Implications
The findings of this study carry important implications for the design and governance of education financing in India, particularly within its quasi-federal fiscal architecture. By demonstrating a persistent gap of approximately Rs 43,010 crore between budgeted allocations and actual expenditure, alongside marked regional disparities in utilization, the analysis underscores that current funding arrangements and insufficient to ensure that resources reach schools in a timely, effective and equitable manner. For policy makers at both Union and state levels, these results suggest an urgent need to reorient education finance from a narrow focus on nominal budgetary commitments towards a stronger emphasis on absorptive capacity, implementation quality and accountability for outcomes. In practical terms, this entails strengthening medium-term expenditure planning, tightening monitoring of state-wise and district-wise utilization, and linking a portion of intergovernmental transfers to demonstrated improvements in infrastructure, teacher deployment and learning conditions, so that fiscal federalism in education promotes not only formal compliance with allocation norms but substantive progress towards equitable and high-quality schooling for all.
Limitations of the Research
Despite its contributions, this research is subject to several important limitations that constrain the scope and generalizability of its findings. First, the analysis relies exclusively on secondary data from government budget documents and published reports, which, although authoritative, restricts insight into school-level implementation dynamics and intra-state disparities in resource utilization. Second, the temporal focus on the period from 2018–19 to 2023–24 offers a robust but bounded snapshot of fiscal behaviour, limiting the ability to capture longer-term historical trends or cyclical fluctuations in education financing. Third, the mixed-method design is based on documentary review rather than primary qualitative fieldwork; as a result, the perspectives of bureaucrats, school leaders and frontline officials on the causes of underutilization are inferred indirectly rather than triangulated through interviews or ethnographic observation, which narrows the depth of institutional and governance analysis.
Policy Recommendations
● Establish State-Level Fiscal Capacity Units: To address the 89.9% absorption limit in lagging Northern and Eastern states, the Ministry of Education should form dedicated administrative task forces to assist low-capacity states in streamlining public financial management, removing procurement bottlenecks, and executing grants on schedule.
● Shift Focus from Allocation Targets to Absorption Benchmarks: Central funding releases under schemes like Samagra Shiksha should move away from rigid annual allocation targets and implement phased, quarterly disbursement models tied to audited absorption milestones. This will eliminate the practice of downscaling budget targets late in the fiscal year to inflate percentage utilization figures.
● Earmark Dedicated Funding for Human Resources and Digital Infrastructure: Earmarks within central schemes for human resource management, teacher training, and recruitment must be increased above current negligible levels (0.2%). Funding guidelines should mandate dedicated capital for expanding digital teaching capabilities, ensuring high-GDP and low-capacity states alike can deploy personnel funds efficiently.
● Reconcile Staffing Formulas with Verified Enrolment Data: To resolve debates surrounding teacher shortages (3.58 lakh vs. enrolment-adjusted estimates), the government should deploy real-time, biometrically verified enrolment and staffing tracking databases. This will allow states to rationalize teacher deployment across grades to maintain the mandated 30:1 student-teacher ratio without incurring unverified fiscal liabilities.
Future Directions for Research
● Impact of Fiscal Federalism on Local Outcome Metrics: Future empirical research should employ micro-level panel datasets to evaluate how state-level administrative variance directly impacts district-level learning outcomes, standardized test scores, and dropout rates.
● Longitudinal Analysis of Private vs. Public Education Expenditure: Given that private expenditure accounts for nearly 2.7% of GDP alongside public spending, research should investigate how rising household educational expenditure deepens socio-economic disparities and impacts low-income families.
● Reconciliation Models for Educational Data: Further studies should develop econometric models that reconcile official vacancy numbers with verified, non-fictitious student enrolments to establish accurate fiscal forecasting models for human resource planning in public education.
Therefore, the study concludes that bridging the gap between budget allocation and actual expenditure is essential not only for improving efficiency but also for ensuring equitable and quality education. Without addressing underlying institutional and governance deficiencies, increased funding alone is unlikely to yield desired outcomes. Addressing the gap between budget allocation and expenditure therefore requires a multidimensional approach that combines increased funding with strong governance reforms, improved institutional capacity and accountability-driven policy frameworks.
References
1. Bhardwaj, M., Ranjan, A., & Sharma, J. (2024). Curriculum and NEP 2020: Perspectives and Inter-connections. Indian Journal of Public Administration, 70(2), 237–255. https://doi.org/10.1177/00195561241230244
2. Bhatty, K. (2014). Review of Elementary Education Policy in India: Has It Upheld the Constitutional Objective of Equality? Economic and Political Weekly, 49(43/44), 100–107. http://www.jstor.org/stable/24480999
3. Careers360. (2025, September 5). Beyond Teachers Day cards, gifts: How 3.57 lakh vacant posts are straining India’s government schools. https://news.careers360.com/teachers-day-2025-government-schools-3-57-lakh-teaching-vacancies-udise-plus-pab-data-uttar-pradesh-lead-education-ministry
4. Chaudhry, S., Tandon, A., Shinde, S., & Bhattacharya, A. (2024). Student psychological well-being in higher education: The role of internal team environment, institutional, friends and family support and academic engagement. PLOS ONE, 19(1), e0297508. https://doi.org/10.1371/journal.pone.0297508
5. Datta, S., & Kingdon, G. G. (2025). The myth and reality of teacher shortage in India. The Journal of Development Studies, 62(1), 83–105. https://doi.org/10.1080/00220388.2025.2557930
6. De, A., & Endow, T. (2018). Public expenditure on education in India: Recent trends and outcomes. (Working Paper).
7. Government of India, Ministry of Education. (2020). National Education Policy 2020. https://www.education.gov.in/sites/upload_files/mhrd/files/NEP_Final_English_0.pdf
8. Karmakar, R., & Suri, C. (2022). Financing of Higher Education in India: Allocation of Funds as per Union Budget 2022-23. NeuroQuantology, 20(16), 2337–2344. https://doi.org/10.48047/NQ.2022.20.16.NQ88236
9. Majumdar, T. (1983). Investment in education and social choice. Cambridge University Press. https://ci.nii.ac.jp/ncid/BA01422510
10. Mishra, Ram K. (2025). Revolutionizing higher education: rethinking funding and global models with an Indian lens. Public Administration and Policy, 28(3), 337–349.
11. Narayana, M. R. (2019). Fiscal Policy, Demographic Transition and Public Spending on Education: New Macroeconomic Evidence for Higher Education from India. Journal of Education Finance, 44(4), 405–422. http://www.jstor.org/stable/45213900
12. Phukan, S., & Bonia, B. (2022). Budget 2022-23 analysis on education: Mega push for digital education. Shodhsamhita, 9(1), 635–639. https://www.jagiroadcollege.co.in/upload/iqacarchive/1669723109.pdf
13. Press Information Bureau. (2022, February 8). Impetus to education sector in Union Budget 2022-2023 (Budget Series #3). Ministry of Information and Broadcasting, Government of India. https://www.pib.gov.in/PressReleasePage.aspx?PRID=1794415®=48&lang=2
14. PRS Legislative Research. (2022, February 1). Union Budget 2022-23 analysis. Institute for Policy Research Studies.https://prsindia.org/files/budget/budget_parliament/2022/Union%20Budget%20Analy
15. PRS Legislative Research. (2022, February 16). Demand for Grants 2022-23 analysis: Education. Institute for Policy Research Studies. https://prsindia.org/files/budget/budget_parliament/2022/2022-23%20DFG%20Analysis-_Housing%20and%20Urban%20Affairs.pdf
16. Rao, M. G., & Singh, N. (2007). The political economy of India’s fiscal federal system and its reform. Publius: The Journal of Federalism, 37(1), 26–44. https://doi.org/10.1093/publius/pjl014
17. Tamang, P. (2011). The impact of education expenditure on India’s economic growth. Journal of International Academic Research, 11(3).
18. Tilak, J. B. G. (1993). Financing higher education in India: Principles, practice, and policy issues. Higher Education, 26(1), 43–67. https://doi.org/10.1007/BF01575106
19. V. Gayathri. (2003). Universalising Education in India [Review of India Education Report: A Profile of Basic Education, by R. Govinda]. Economic and Political Weekly, 38(12/13), 1127–1128. http://www.jstor.org/stable/4413364
20. , Yoganandham, G. (2023). Highlights of Union Budget 2023-24 in India – An analysis. International Journal of All Research Education and Scientific Methods, 11(10), 160–171.https://www.researchgate.net/publication/375837300_Highlights_of_Union_Budget_
To download the copy of paper, click on the below link:
July 1 (L) G 1 (Publishing) _compressed