Authors: Anamika, Aman Verma, Avinash Kumar Khaware, Ravi Raminder Singh, Shivani
Abstract
Make in India was launched to boost the manufacturing power of the country, and this was to be done by policy interventions such as imposing higher import tariffs, incentivizing manufacturing, and removing restrictions on foreign investment. Paradoxically, these measures have led to improved domestic production and investment, but there is still some uncertainty about whether these measures have led to an increase in the competitiveness of the manufacturing sector and industrial development. This study analyzes the impact of tariff measures under Make in India by summarizing the findings from the existing literature on the impact of tariffs on welfare, firm behavior, sectoral performance, and economic results.
The analysis incorporates results of studies for the electronics industry and the solar industry, as well as firm-level studies on the performance of large firms and MSMEs and macro-level data on manufacturing output, FDI, exports and employment. The evidence suggests that tariffs, in fact, spurred domestic assembly and were able to draw investments, including in electronics. There was a notable reliance by many firms, however, on imported intermediate goods, restricting the development of value addition and creating what has been called in the literature the “screwdriver economy.” The results indicate that overall, larger companies have seen more benefits from the policy changes brought on by the tariff changes, whereas MSMEs have seen somewhat less benefit from the policy changes unless complemented with institutional reform.
The study concludes that, overall, tariff policies have helped achieve some of the goals of the Make in India initiative but have not by themselves worked to achieve the much-anticipated structural change. The most obvious single quantitative measure of the shortfall is the difference between the estimated welfare optimising tariff rate of 8% indicated in the literature and the real applied tariff rate for solar cells/modules of 25–40%. This revised paper maps this gap at the level of the individual firm and the macroeconomy. The paper recommends that tariff reforms, development of robust domestic value chains, technology uptake, infrastructure, and policy to enhance the capacity of MSMEs to contribute to industrial growth must go hand in hand for long-term competitiveness improvements in manufacturing.
Keywords: Make in India, MSME, Strategic Trade Theory, Import Tariffs, Endogenous Price Transmission, Scale Asymmetries, Counterfactual Thresholds, Allocative Efficiency.
Introduction
The Government of India, under the leadership of Narendra Modi, launched the Make in India initiative on 25 September 2014. It was launched to make India a manufacturing hub for the world, and to promote both domestic and foreign companies to invest here.
The thrust of the exercise was to move the manufacturing sector to a 25% share of GDP, create 100 million jobs, boost Foreign Direct Investment (FDI), and enhance India’s manufacturing capabilities. In the long run, it aimed at minimizing the reliance on manufactured imports and augmenting domestic manufacturing capability and sustainable economic development.
For this purpose, the Government has implemented several policy measures such as an increase in import tariffs, the Production Linked Incentive (PLI) Scheme, and liberalization of FDI norms. Import taxes on certain goods, especially in the electronics and solar cell industries, were raised specifically to promote domestic production. Manufacturers were exempt from paying taxes based on production under the PLI Scheme, and foreign companies increased their investments in manufacturing in India through FDI reforms. These measures were accompanied by other initiatives such as Ease of Doing Business reforms, development of industrial infrastructure, and manufacturing incentives for specific industries.
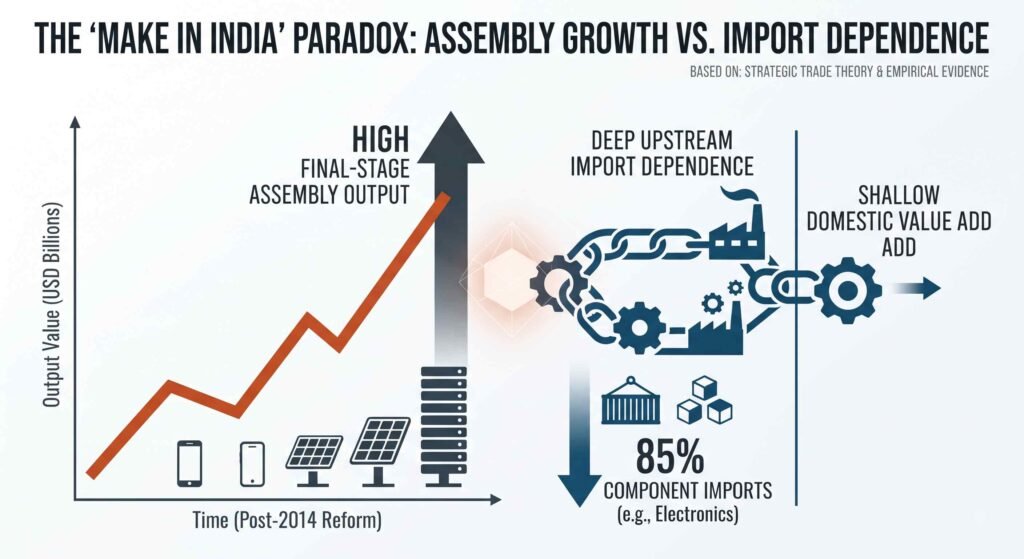
These moves have led to improved investment and manufacturing in some industries, but the success of tariff-oriented industrial policy remains a subject of debate. There are indications that higher tariffs led to both domestic production and domestic investment, and that they had a promotional effect on assembly primarily without much incremental value addition or export competitiveness. The conflicting opinions create a need to take a more comprehensive look at the impact of this policy.
In this context, this paper analyzes the effect of tariff policies in the context of the Make in India initiative. It examines their impacts on consumer welfare, tariff design, and firm behavior, focusing on the electronics and solar sectors of manufacturing. The study also looks into the response of large businesses and MSMEs, as well as the impacts of that response on manufacturing growth, foreign investment, exports, and job creation. This study, whose theoretical foundations lie in the Lerner Symmetry Theorem — that an import tariff works, in terms of its incentive effects, as if it were an implicit tax on export competitiveness views tariff-induced price transmission as an importation of structural distortions.
The remainder of this paper is organised as follows. This is followed by a review of the literature and the research methodology and data analysis. Results are then summarized and discussed, and the study implications and key observations are concluded.
The sequence of the argument in this paper takes a thoughtful and purposeful path from theory to evidence to policy. The Lerner Symmetry Theorem and strategic trade theory, discussed above and further explored in the Literature Review, provide reasons why an import tariff can be an implicit tax on export competitiveness while simultaneously taxing domestic assembly. The sector and firm level evidence provided in the Data Analysis section then serves as a three-fold empirical test of that theoretical prediction for the Indian case, via the welfare maximising tariff criterion, the sourcing evidence regarding the ‘screwdriver economy’ and the firm level markup regressions. The resulting empirical pattern (robust assembly growth, FDI growth, but limited value addition, exports competitiveness, and employment) then translates to tangible tariff design recommendations, MSME support suggestions and longer-term recommendations for industrial upgrading.
Literature Review
There is a question that keeps coming up in the literature on India’s tariff-driven push to industrialise: do the assembly lines you can now see on the ground actually mean more value is being captured at home, or are they just the last stop for parts made somewhere else? Strategic trade theory puts this down to a gap between where production physically happens and where the resulting rents end up and that gap shows up again and again in the empirical work on ‘Make in India.’ The classical story is fairly simple: infant-industry gains cost consumers something; that is the trade-off. Indian evidence from the last few years makes that story messier the trade-off is not the same across firms or tariff levels, and the headline production numbers often hide where in the value chain the rents actually end up, or where they leak out entirely. What follows pulls together three strands of this literature and then tries, in the final section, to read them as one story rather than three.
Competing Theoretical Frameworks: Infant-Industry Protection Versus Structuralist Critique
Before summarizing the sector and firm level evidence it is advisable to spell out these divergent theoretical perspectives. The infant-industry argument, which traces its roots from Hamilton and List, is that temporary protection is warranted in order to give the breathing room necessary to enable the emerging domestic industry to offset the externalities associated with learning-by-doing and to get to a level of production where competitive pressure without protection can be met. In view of this, the Make in India tariffs is just a measure of buying time for local capability to grow, while the assembly and FDI numbers are growing, they are being seen as a measure of readiness, a key indicator of the capability being built up.
In contrast to the criticism from the structuralists, their criticism goes directly at the accumulation assumption and not at the logic of temporary protection as such. Poswal (2025) argued that protection could boost assembly numbers without ever inducing the investment in the deeper sectors of the value chain that is assumed in infant-industry theory; since its impact would be felt at the final stage of production, a tariff on the finished product would be ineffective at incentivizing investment in the assembly sector. The ‘automation paradox’, first dubbed by Poswal (2025) under that same debate taken from the labour-market side of an argument, also generalises to the other critique: Infant-industry theory implicitly assumes that the protected sector will absorb labour as it grows; but when the protected sector responds to a tariff by importing capital-intensive automation into itself rather than expanding its employment, output can increase in just the manner as infant-industry theory predicts, but the labour-market dividend produced by protection will not.
There is no ‘right answer’ in Indian contexts to the question of who is ‘right’ – it depends on the context. The evidence below indicates that infant industry mechanism works fairly well at assembly and FDI level; at the latter, tariffs do pull final production onshore and the structuralist critique provides a better explanation of why this assembly growth has not yet led to the same level of value addition, export competitiveness, and jobs creation. One of the organising moves of this review is to consider both literatures together as complementary lenses for diagnosis rather than as competing hypotheses from which only one can be true – that is, how the two literatures are treated in the two Data Analysis and Discussion sections that follow.
Review Methodology
The sources here are a mix of academic working papers, peer-reviewed journal articles, institutional reports, and policy commentary from roughly 2015 to 2026, found mainly through Google Scholar, SSRN, and the EPW archive, searching combinations of terms such as ‘Make in India,’ ‘import tariffs,’ ‘MSME,’ ‘value chain,’ and ‘trade liberalisation.’ Anything that did not engage directly with post-2014 Indian tariff policy was set aside tariff studies from other countries were kept only where they were explicitly comparative.
Firm-level and sector-level empirical work took priority over descriptive commentary, though a handful of policy reports and think-tank pieces made the cut anyway, mostly because they contained aggregate figures that were not available anywhere else.
Sector-Specific Value Chain Realities
The clearest empirical test of the infant-industry-versus-screwdriver-economy debate sits at the level of individual sectors, where tariff design can be compared directly against value-chain outcomes. On paper, the tariff does exactly what protection theory says it should and that, several authors point out, is part of the problem. Callejas et al. (2024) track the domestic assembly share of finished handsets rising from 17% with no tariff to 80% once one was imposed, more than doubling almost overnight. The welfare picture that comes with it is less flattering: pass-through moved from producers to consumers, costing an estimated $0.7 billion in consumer surplus, against a welfare-maximizing average levy the authors put at around 8% — well below where actual tariffs currently sit.
Component-level tariffs, oddly, do the opposite of what they are meant to. Instead of pulling more of the value chain in-house, Callejas et al. (2024) find that multinationals often just go back to importing the whole device once a component gets taxed. Poswal (2025) has a name for this: the ‘Screwdriver Economy’: assembly that looks like real value creation until you notice that 80% of what goes into it was imported anyway, a pattern she ties to India’s $85 billion trade gap with China, and one that keeps widening.
The same pattern turns up well outside electronics. Tandon (2025) and Rana and Jindal (2025) both point to cheap Chinese components as the real driver behind India’s 90%-plus drop in the cost of solar electricity — a gain that tariff changes could easily unwind. Electronics clusters, meanwhile, have barely moved in over a decade.
Saripalle (2015) puts this down to liberalization that was never paired with any real deep-tier capability building, so the growth numbers at the assembly stage looked better than what was actually happening underneath. And firms do not sit still — they reverse sourcing decisions or substitute away from taxed inputs entirely, something Callejas et al. (2024) show clearly and Vandenbussche and Viegelahn (2016) show more partially, since their data only run to 2009, before the post-2014 protectionist turn.
Distributive Frictions and Price Shocks
Having established that the sector-level substitution pattern is real and fairly general, the review now turns to firm size, where the same tariff schedule appears to generate systematically different outcomes for large exporters and MSMEs. If the sector-level story is about substitution, the story at the firm and household level is really about who bears the cost. A survey of 100 stakeholders among import-dependent Haryana MSMEs found that it was not tariffs themselves causing the most distress — it was administrative complexity. The liquidity crunch comes from somewhere else: cash tied up upfront and input tax credit refunds that take too long, a problem COVID-19 made noticeably worse.
Mukherjee and Chanda (2021, 2024), working with panel data on 3,264 manufacturing firms, call this scale asymmetry liberalization boosts productivity and markups mostly for the bigger players, while MSMEs end up with thinner margins instead. Singh and Chanda (2021) find something similar from the cost side: restrictive rules on imported intermediate inputs eat into markups as firms absorb the shocks themselves, which does not sit comfortably next to Callejas et al.’s (2024) finding of consumer-facing pass-through. Put the two together, and it looks like whether costs get passed on or absorbed depends heavily on firm size.
Prabhakar’s (2026) analysis puts 92% of India’s $410 billion import bill under some form of tariff coverage, with 66% of those lines sitting on intermediate and capital goods — exactly the inputs domestic industry, MSMEs especially, actually needs.
None of this shows up in aggregate productivity or revenue numbers, which is itself an important methodological point: it only becomes visible in Manisha and Gour’s (2025) stakeholder-level data, which points to a gap between what the macro indicators say and what firms are actually dealing with day to day a gap the literature has not really reconciled yet. Mukherjee and Chanda treat firm size as a productivity story; Manisha and Gour treat it as an administrative capacity story. Either way, the conclusion is much the same: a lot of cash-strapped MSMEs are operating inside a system that, in practice, was built with large exporters in mind.
Macroeconomic Performance and Global Competitiveness
If sector- and firm-level adjustment is asymmetric in these ways, that asymmetry should be visible in the economy-wide indicators the Make in India programe itself uses to measure success — the macro record examined next. Pull back to the economy-wide view and the results are genuinely mixed. Poswal (2025) gives ‘Make in India’ 45 out of 100 across its 11 years manufacturing’s share of GDP has stayed at 17% against a 25% target, the Ease of Doing Business ranking improved to 63rd from 143rd, and FDI came in at $705 billion. But only 2 million jobs were created against a target of 100 million, cumulative production sits at $568 billion, and manufacturing exports reached just $314 billion.
Poswal’s (2025) ‘Automation Paradox’ is the idea that heavy investment in Industry 4.0 technology ate into the employment gains the policy was supposed to deliver, feeding into youth unemployment near 23%, while Vietnam and Bangladesh moved faster on basic infrastructure and picked up the ‘China+1’ opportunity India was hoping for.
A related EPW (2024) study looks at the trade balance from a different angle and finds domestic output and value added did rise on post-2014 tariff lines, even as the share of that output actually exported fell. Some of that, the authors suggest, comes down to trade and industrial policy simply not talking to each other — a disconnect that, per Francis and Kallummal (2020), persisted even as import surges from ASEAN and China kept coming.
Line up FDI, ease-of-doing-business rank, and output volumes, and India looks like a genuine success story. Line up what is happening at the level of actual value capture, and it looks a lot less convincing. That gap is really the macro-level fingerprint of the Automation Paradox and Screwdriver Economy dynamics described above not a separate finding, just the same underlying mechanism showing up at a different scale.
Toward an Integrating Framework
Taken on their own, these three strands can read like three different papers. Taken together, they are really describing one mechanism playing out at three different scales. At the sector level, tariffs succeed at pulling final assembly onshore but fail to pull value along with it, because firms substitute their way around any single-tier tariff design instead of deepening local integration the way the policy assumes they will.
That same substitution behavior is what produces the distributive asymmetry visible at the firm level large, integrated exporters can absorb compliance costs and reroute their sourcing, while cash-constrained MSMEs simply cannot, which leaves them exposed to both the liquidity squeeze from input tariffs and the administrative weight of a system that was not really built with them in mind.
Those same dynamics then resurface as the gap between headline macro indicators and actual value capture: strong FDI and output numbers sitting next to weak job creation and flat export growth. Seen this way, the ‘Screwdriver Economy’ at the sector level, the compliance disconnects at the firm level, and the ‘Automation Paradox’ at the macro level are not three separate problems they are three symptoms of the same underlying substitution dynamic.
Future empirical work could probably capture that directly by modelling input substitution, compliance cost, and export/domestic trade-offs together in one counterfactual framework, instead of as three separate literatures a gap this paper returns to explicitly in the Limitations and Future Research section below.
Research Methodology
Building directly on the integrating framework proposed at the close of the Literature Review, this study adopts a three-stage conceptual and secondary-data synthesis methodology to assess the structural and distributive impact of rising import tariffs under the “Make in India” regime, integrating consumer welfare, firm-level adjustment, and dynamic policy simulation into a single analytical frame.
Literature Search and Review Procedure. Literature was searched on SSRN, CEPR VoxEU, IIM Bangalore working papers, CSEP literature, and peer-reviewed journals using search terms combining “tariff,” “Make in India,” “MSME,” and “welfare.” The literature inclusion criteria focused primarily on India-specific evidence after 2014 relevant to the Make in India policy; however, firm-panel studies from before this era have been included only where they highlight an underlying mechanism that can be transferred to the current period, such as the regulatory restructuring examined by Mukherjee and Chanda (2021, 2024).
The screwdriver economy (Poswal, 2025), the welfare-maximizing tariff (Callejas et al., 2024), and scale asymmetry (Mukherjee & Chanda, 2021) are each defined once, at first use, for consistency going forward and to prevent redundancy.
Stage One (Demand and Welfare). This stage models price transmission by product attribute and income group, where the empirical measure of regressive impact is the difference between the tariff actually charged and the welfare-maximizing tariff of 8%, as proposed by Callejas et al. (2024).
Stage Two (Sourcing and the Screwdriver Economy). This stage uses revealed preference in firm sourcing choices — the increase in smartphone localisation from 17% to 80% (Callejas et al., 2024) and the shallow backward linkage documented by Poswal (2025) and Saripalle (2015) — and treats it as descriptive and correlated with the timing of policy implementation, but not causally identified, since the underlying literature relies on sector-level case studies and audits rather than firm panels.
Stage Three (Dynamic Simulation). This stage tests how sourcing, pricing, and product-variety choices co-move by firm size, using the single quasi-causal element available in this evidence base: the difference-in-differences specification around the 2006 MSME reclassification (Mukherjee & Chanda, 2021, 2024). In line with the cost-side findings of Singh and Chanda (2021), the reclassification threshold, rather than firm size per se, is used as the moderating variable here. Because the underlying panel runs only to 2009, this evidence is best treated as a structural prior about the post-2014 system rather than a direct estimate of it.
Integration. A conceptual map of the processes involved across the three stages addresses the gap noted by Prabhakar (2026) and Economic and Political Weekly (2024) the absence of a unified framework incorporating consumer pass-through, firm sourcing, and compliance costs (Manisha & Gour, 2025).
Limitations. The vintage discrepancy in the underlying data, the sectoral correlation (rather than causal identification) of several key results, and the unaccounted compliance-cost aggregation flagged by Manisha and Gour (2025) are treated as limitations throughout, alongside sensitivity tests for the 8%/10% welfare-maximising thresholds. These limitations, together with the concrete steps needed to resolve them, are developed at greater length in the Limitations and Future Research section following the Discussion, once the full weight of the empirical evidence has been presented.
Data Analysis
The conceptual methodology set out for this study distinguishes three analytically separable, but empirically interlocking, margins of adjustment to a tariff shock: (i) the price and welfare effect transmitted to consumers, (ii) the sourcing and product-variety response of firms deciding whether to assemble domestically or continue importing finished goods, and (iii) the dynamic, general-equilibrium outcome that emerges once both sides re-optimise simultaneously.
The data assembled across the reviewed sources firm-level regressions from Chanda and co-authors, sector case studies on electronics and solar manufacturing, and macro-level trade-policy audits do not test this model directly, but they populate each of its three margins with quantitative evidence. Read together rather than source-by-source, the numbers converge on a single structural finding: assembly-stage indicators (local content, production value, FDI) have moved sharply in the direction the policy intended, while the indicators that would confirm genuine value capture backward linkage, MSME markup gains, and export competitiveness have moved far less, or in the opposite direction, for large stretches of the period under review.
1. Stage One: Price Transmission and the Design of the Tariff Schedule
If tariffs behave as the regressive instrument the consumer-welfare model predicts, the size of the wedge between the implemented tariff and the welfare-maximising tariff is itself a measure of the avoidable burden placed on downstream buyers. The solar case gives a direct read on this wedge: the Basic Customs Duty actually levied is three to five times the rate the literature identifies as optimal.
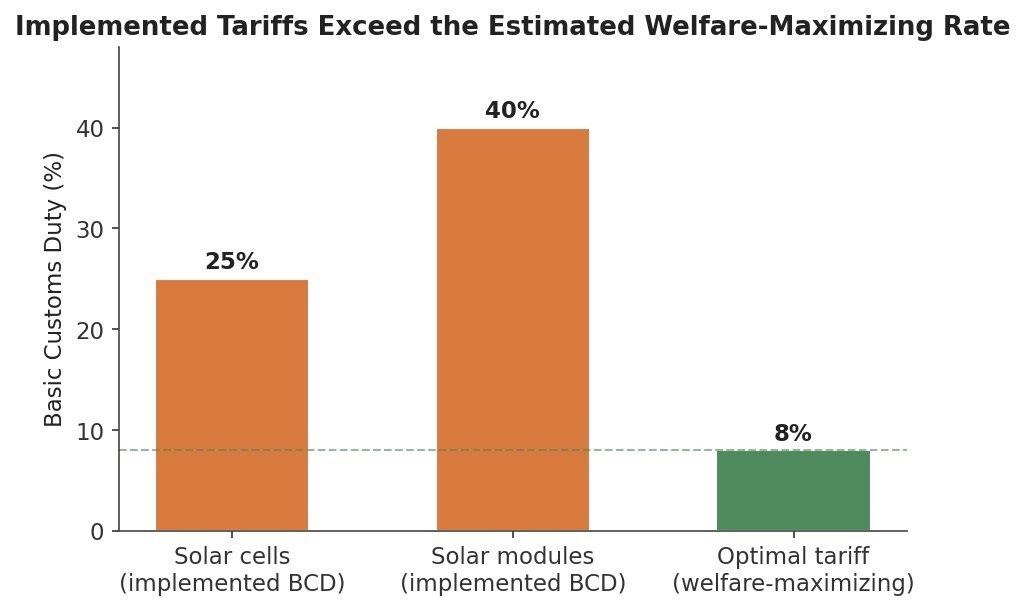
Figure 1. Implemented Basic Customs Duty on solar cells (25%) and modules (40%) against the estimated welfare-maximising tariff of 8%.
This is not an isolated design choice. At the level of the full tariff schedule, the CSEP audit shows that tariffs — rather than anti-dumping duties or quality-control orders — carry almost the entire weight of import protection, and that the schedule is concentrated in a mid-range band that applies disproportionately to inputs rather than finished consumer goods.
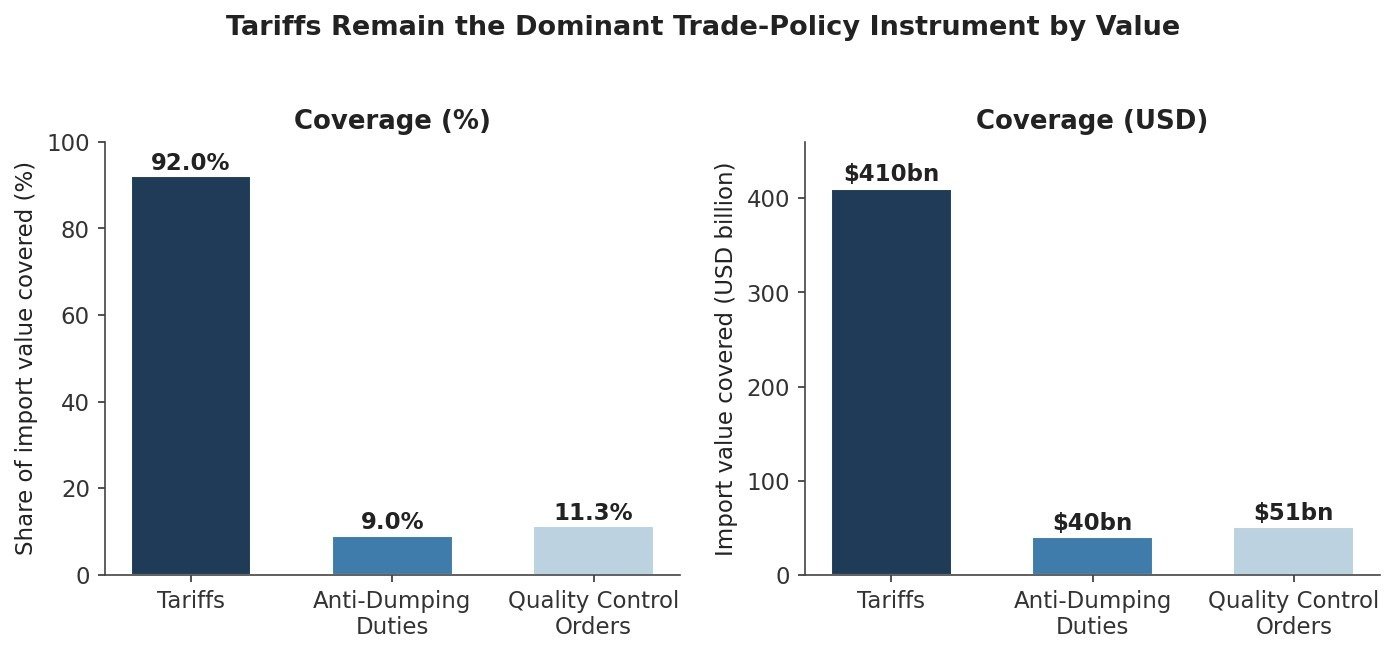
Figure 2. Tariffs cover 92% of India’s import value (USD 410bn); anti-dumping duties and quality-control orders cover a combined, smaller share.
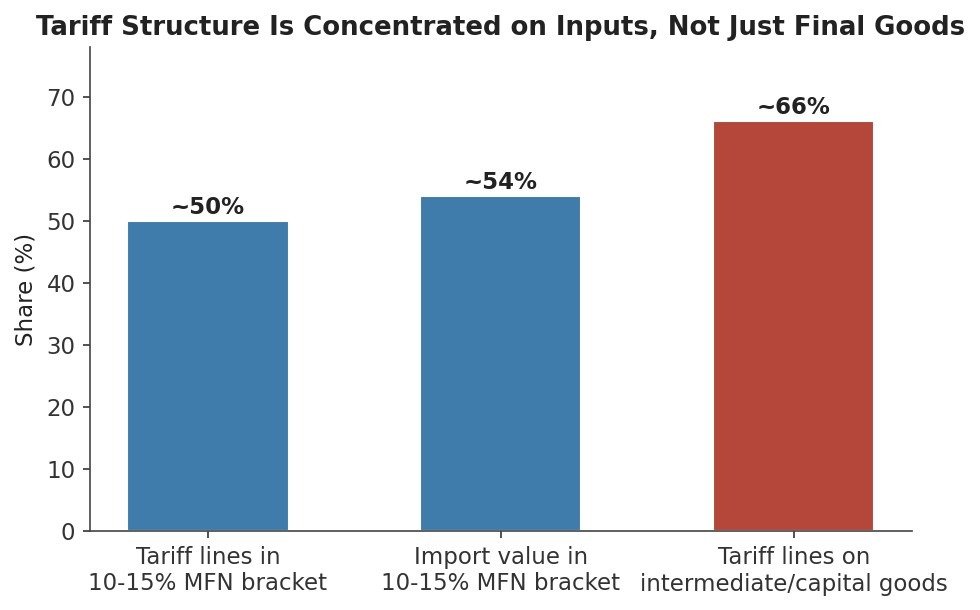
Figure 3. Roughly half of all tariff lines sit in the 10–15% MFN bracket, and 66% of tariff lines apply to intermediate and capital goods rather than final consumer products.
The concentration of tariff lines on intermediate and capital goods is the empirical bridge between the consumer-welfare stage and the firm-adjustment stage of the methodology: a duty nominally aimed at encouraging local assembly of a final good simultaneously raises the cost base of any firm that must still import an input to produce it. The regressive-tax logic therefore does not stop at the retail counter; it re-enters the model as a cost shock at the level of the firm, which is where the second stage of the analysis picks it up.
2. Stage Two: Sourcing Decisions and the “Screwdriver Economy”
Faced with a tariff on the finished good, a firm’s cheapest response is frequently to relocate only the final assembly step while continuing to import the underlying components — precisely the dynamic-substitution behaviour the methodology’s second stage is designed to isolate. Two independent sectors, smartphones and solar, show the same pattern at a similar order of magnitude.
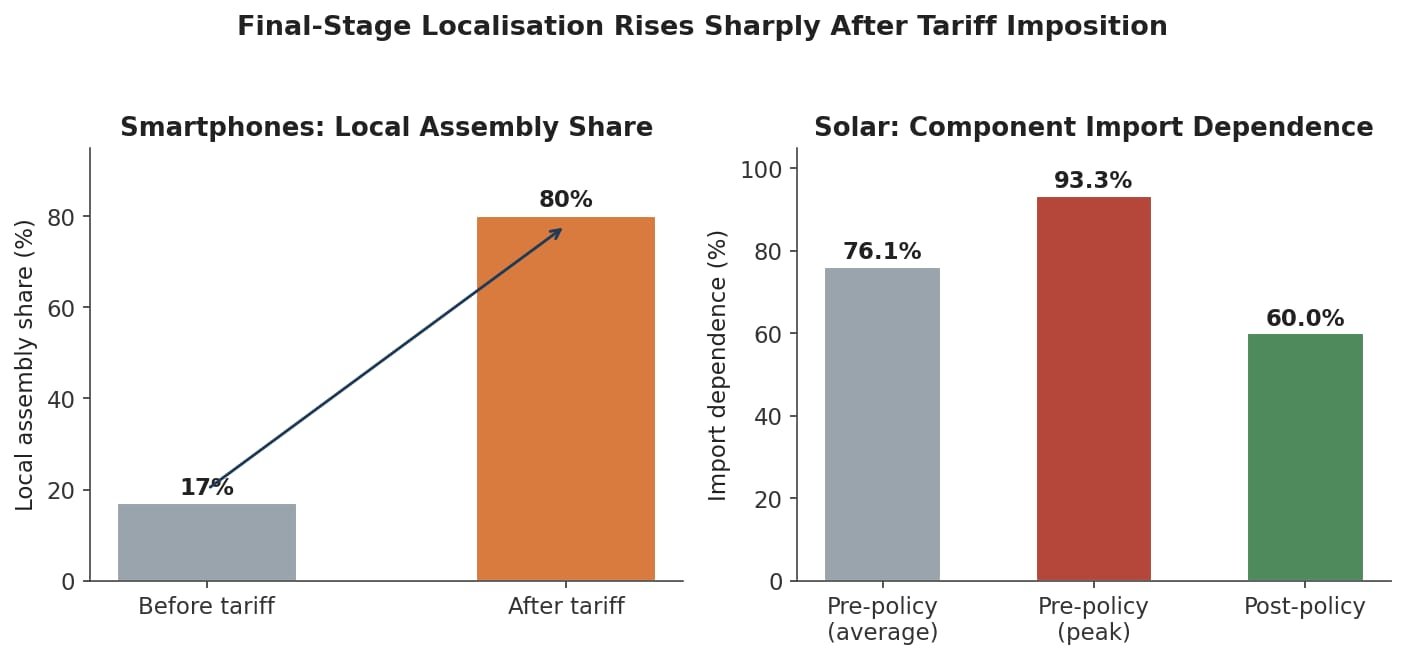
Figure 4. Local smartphone assembly rose from 17% to 80% after tariff imposition; solar-component import dependence fell only from a pre-policy average of 76.1% (peak 93.3%) to 60% after policy intervention — a smaller and more partial adjustment.
The asymmetry between the two panels above is analytically important: smartphone assembly localisation is far more complete than the reduction achieved in solar import dependence, suggesting the screwdriver-economy effect is stronger where the finished-good tariff is high and the input tariff is comparatively low. Firm- and supply-chain-level detail confirms that this localisation is shallow even in flagship cases, and that it sits on top of a globally concentrated upstream supply chain that Indian tariff policy alone cannot redirect.
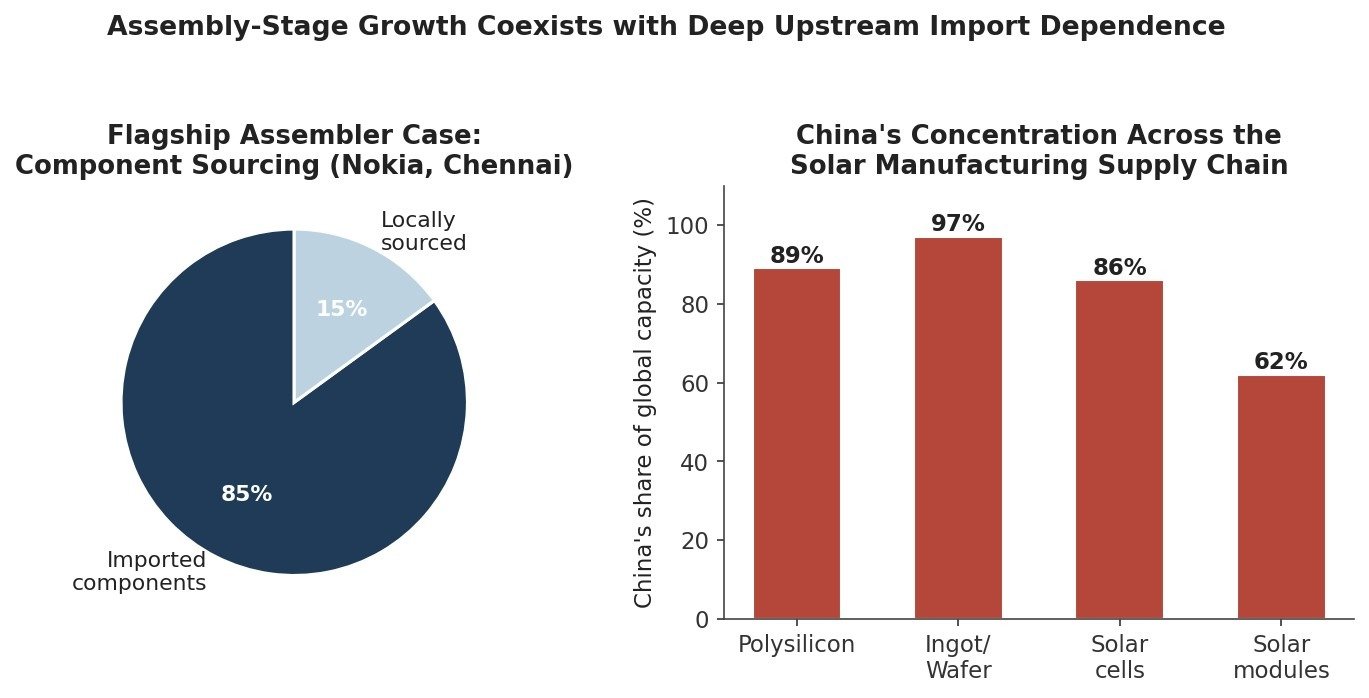
Figure 5. Imported components made up 85% of inputs at a flagship handset assembler’s Chennai plant; China separately controls 86–97% of global capacity across the polysilicon, wafer, and cell stages of the solar supply chain.
The same shallow-linkage pattern shows up in aggregate trade flows for electronics, where import growth has consistently outpaced export growth, and where preferential access under India’s FTAs has not meaningfully diverted sourcing away from a single dominant, non-FTA supplier.
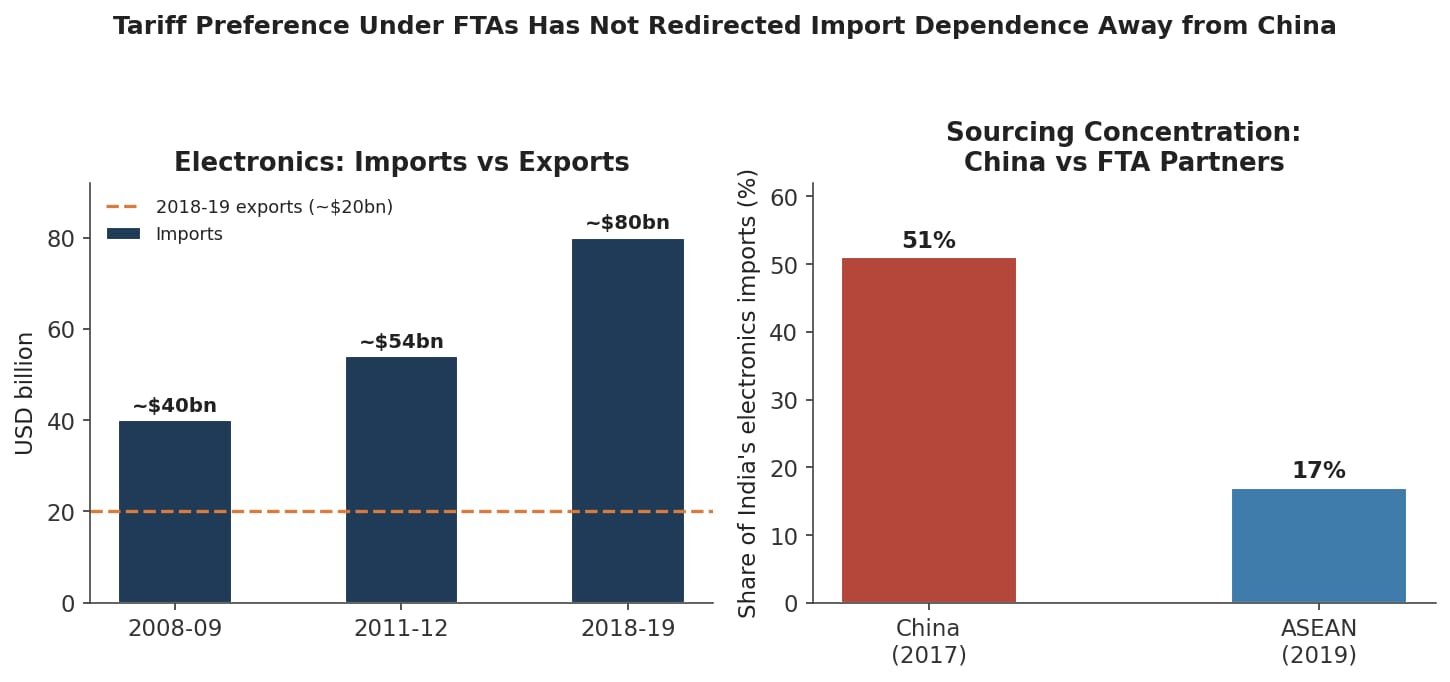
Figure 6. India’s electronics imports grew from ~$40bn (2008–09) to ~$80bn (2018–19) against exports of only ~$20bn; China alone supplied 51% of electronics imports in 2017, more than three times the combined 2019 share of all ASEAN partners.
Taken together, these three figures describe a consistent mechanism: tariffs raise the effective cost of importing a finished product, firms respond by shifting the last stage of production onshore, but the componentry behind that last stage remains sourced from the same concentrated set of external suppliers the tariff was meant to displace. This is the empirical content behind the “screwdriver economy” critique, and it is the reason headline assembly and production statistics can rise even where backward linkage does not.
3. Stage Three: Firm Heterogeneity and the Distribution of Gains
The methodology’s third stage requires simulating how sourcing, pricing, and product decisions move together once firms of different sizes face the same tariff schedule. The firm-level regressions available for Indian manufacturing (1999–2009) show that this joint adjustment is not scale-neutral: large firms convert input-tariff cuts into higher markups in both policy periods, while MSMEs do so only after the 2006 reclassification widened the MSME investment ceiling.
As reported in Table 2, the pre-2006 input-tariff coefficient is −0.041 for large firms and 0.160 for MSMEs; because the specification is written in cost-reduction terms, a negative coefficient corresponds to a markup expansion (large firms: a 1% input-tariff cut is associated with a 4.1% markup increase), while a positive coefficient corresponds to a markup contraction (MSMEs: the same 1% cut is associated with a 16.0% markup fall), so the sign reversal between the two rows is the statistical signature of the scale asymmetry rather than an inconsistency in the estimation.
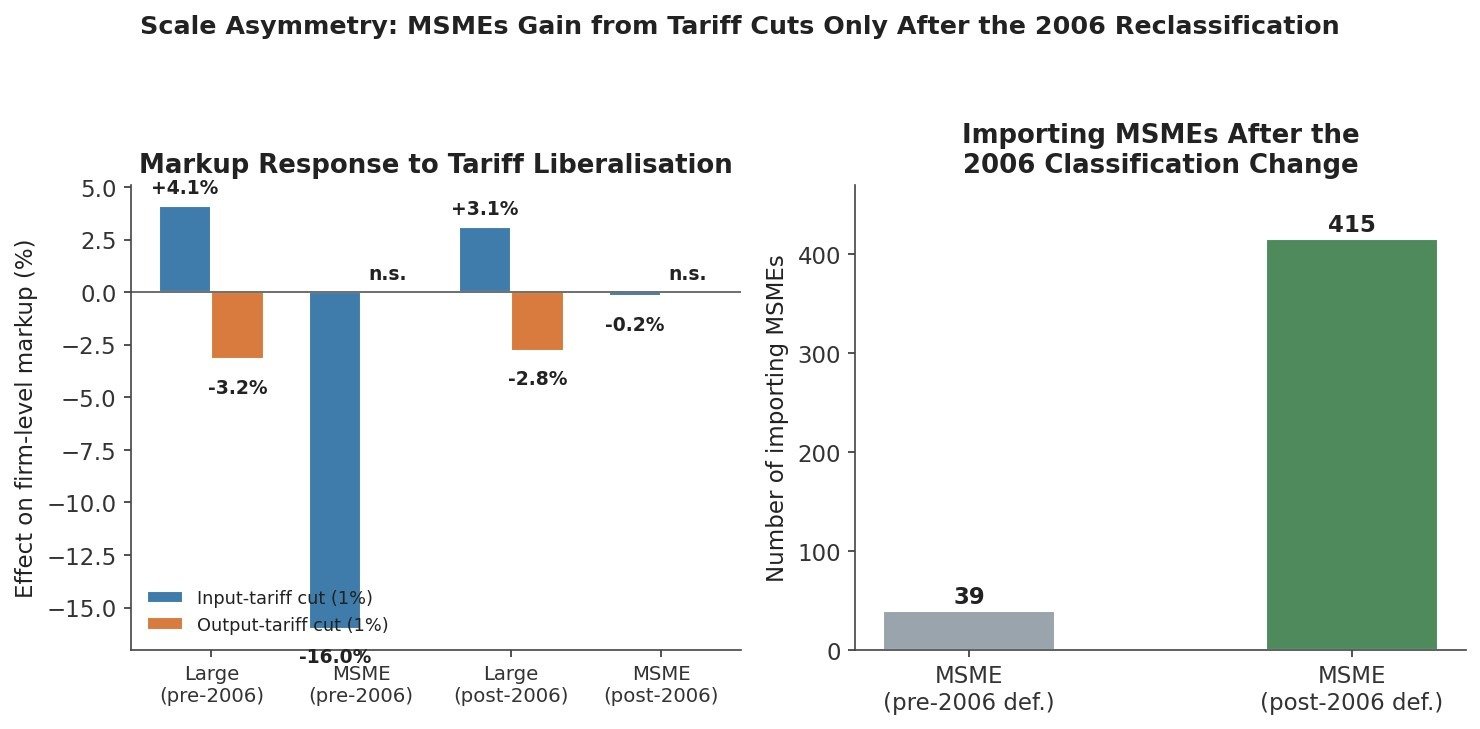
Figure 7. A 1% input-tariff cut raises Large-firm markups by 3–4% in both periods; the same cut is associated with a 16% markup fall for MSMEs before 2006, turning insignificant after 2006 — alongside a more than ten-fold rise in the number of importing MSMEs (39 to 415) once the classification was relaxed.
A difference-in-differences comparison of importing MSMEs against importing large firms isolates the reclassification itself as the operative channel, rather than the tariff cut in isolation: the post-2006 markup premium for importing MSMEs survives the inclusion of industry-year and state-year fixed effects, and the positive tariff-times-imports interaction is significant for MSMEs under both definitions, but an order of magnitude larger post-2006.
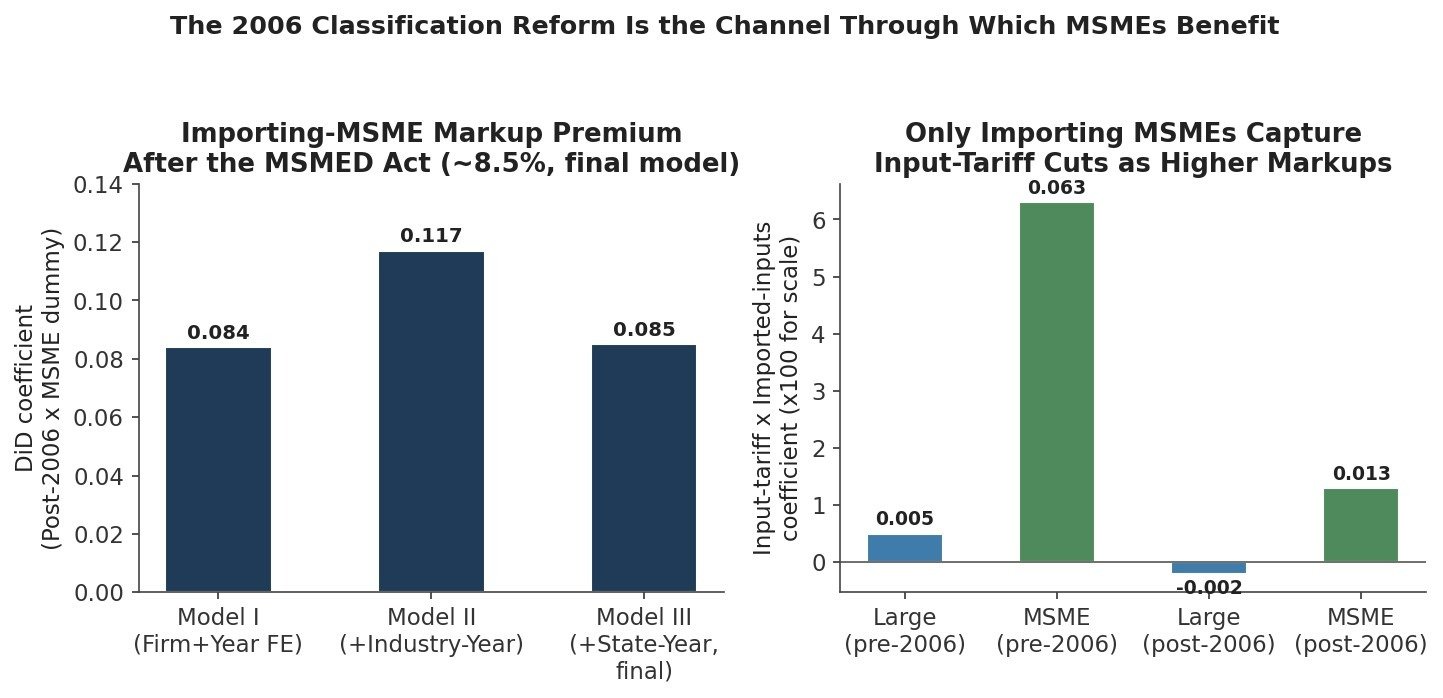
Figure 8. The Post-2006 x MSME interaction is positive across all three fixed-effects specifications, settling at an ~8.5% markup premium for importing MSMEs in the fully-controlled model; the input-tariff x imported-inputs interaction is positive for MSMEs in both periods and roughly five times larger post-2006.
Productivity effects run in the same direction as the markup effects but are more uniform across firm size: input-tariff cuts raise physical productivity (TFPQ) for all firm classes, while output-tariff cuts erode it through intensified competition. The MSME productivity response is directionally consistent with the large-firm response but only marginally significant, which is consistent with MSMEs facing the same competitive pressure as large firms without the same capacity to convert an input-cost saving into measured productivity gains.
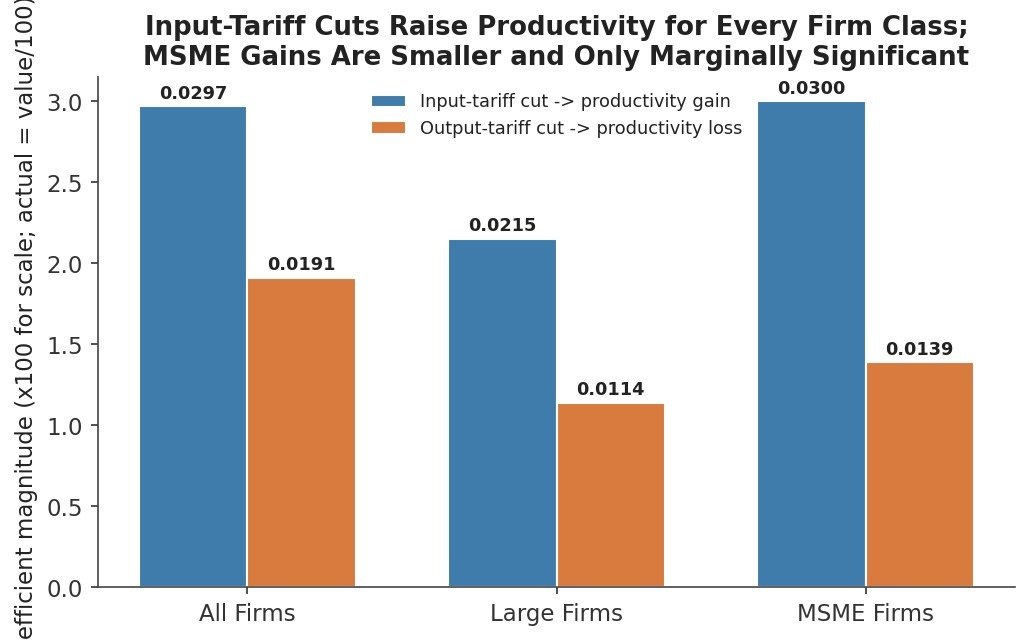
Figure 9. A 1% input-tariff cut raises TFPQ by roughly 0.030% for all firms and 0.021% for Large firms; the MSME coefficient is similar in size but only marginally significant, reflecting noisier estimation rather than an absent effect.
The regression evidence therefore locates the scale asymmetry precisely: it is not that MSMEs are structurally incapable of benefiting from liberalisation, but that the pre-2006 definition of “MSME” excluded most firms actually able to import and use liberalised inputs. This reframes the productivity-versus-compliance debate in the literature the classification threshold, not firm size as such, is doing much of the analytical work.
4. Cross-Cutting Synthesis: Aggregate Outcomes Against Structural Detail
Macro-level indicators for the Make in India programme sit above all three stages of firm- and household-level adjustment, and are the numbers most exposed to the risk of being read as success in isolation. Measured against the programme’s own stated targets, the aggregate record is decisively short on the indicators most tied to genuine value capture and employment, even where trade- and investment-facing indicators look comparatively strong.
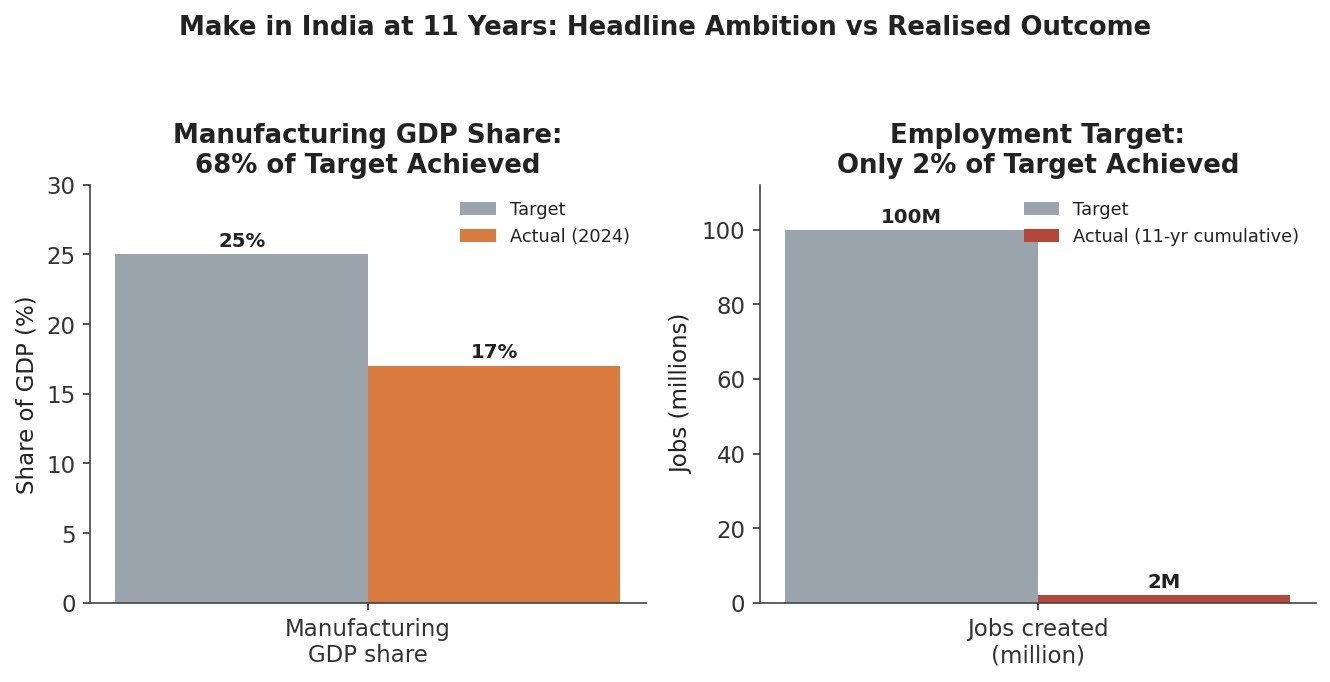
Figure 10. After 11 years, manufacturing’s GDP share has reached 17% against a 25% target (68% of target); cumulative job creation stands at an estimated 2 million against a 100 million target.
Table 1. Selected Make in India Indicators (11-Year Horizon)
| Indicator | Reported Value | Assessment |
| Manufacturing share of GDP | 17% (target: 25%) | Below target |
| Youth unemployment | 23% | Structural concern |
| Ease of Doing Business rank | 63rd (from 143rd) | Improved |
| FDI inflows (cumulative) | USD 705 billion | Strong |
| Manufacturing exports (cumulative) | USD 314 billion | Below export ambition |
| Jobs created | ~2 million (target: 100 million) | Substantially below target |
The pattern in Table 1 is the macro mirror of the firm- and sector-level findings above: capital-facing indicators (FDI, ease of doing business) have moved favourably, while output- and labour-facing indicators (manufacturing GDP share, jobs, exports) remain well short of stated targets. This is consistent with an assembly-led growth model that attracts capital and reports rising production value without a matching rise in either export competitiveness or broad-based employment — the same combination the sector case studies above describe as a screwdriver-economy outcome.
Table 2. Summary of Key Coefficients — Firm-Level Tariff Effects on Markups (Table 4/5, Mukherjee & Chanda, 2021)
| Firm group/period | Input-tariff coefficient | Output-tariff coefficient | Input-tariff × Imports |
| Large, pre-2006 | −0.041 (+4.1% markup per 1% cut) | 0.032 | 0.005 |
| MSME, pre-2006 | 0.160 (−16.0% markup per 1% cut) | −0.098 | 0.063 |
| Large, post-2006 | −0.031 (+3.1% markup per 1% cut) | 0.028 | −0.002 |
| MSME, post-2006 | −0.002 (n.s.) | −0.004 (n.s.) | 0.013 |
Reading Tables 1 and 2 side by side is the closest this evidence base comes to the integrated counterfactual the literature review identifies as missing: the firm-level table shows precisely which sub-population (post-2006, importing MSMEs) captured the liberalisation gain, while the macro table shows that this gain has not yet aggregated into the economy-wide manufacturing, export, or employment outcomes the policy targets. The distance between the two tables is, in effect, a measure of how much of the theoretical adjustment mechanism in the methodology’s Stage 3 has actually completed at national scale.
Three qualifications limit how far this synthesis can be pushed. First, the Chanda-authored panels end in 2009 and predate the post-2014 tariff escalation that motivates the rest of this review, so the scale-asymmetry finding is best read as a structural prior rather than a direct estimate of the current regime’s distributional effect. Second, the electronics- and solar-sector figures come from case studies and audits rather than firm-panel regressions, so the assembly-share and import-dependence numbers describe correlation with policy timing rather than an identified causal estimate. Third, no source in this evidence base jointly models consumer price pass-through, firm sourcing choice, and compliance cost in a single framework the gap the methodology’s three-stage design is intended to close, and one this data analysis can document but not itself resolve.
5. Reconciling the Quantitative Benchmarks: Why Assembly Rose While Value Addition Lagged
The quantitative evidence gathered from Stages One – Three all points to a single, very measurable gap. For the smartphone case, the welfare-maximising tariff estimated by Callejas et al. (2024) is close to 8%, whereas the BCED on solar cells and solar modules is fixed at 25% and 40% respectively, which is 3-5 times higher than the welfare-maximising tariff. This is the most obvious single quantitative measure of the gap between the estimated tariffs imposed and the welfare-maximising tariff identified in the literature. Not a single solar tariff line is an outlier the finished-good tariff that corresponds to the shift in smartphone assembly localisation from 17% to 80% of the total represents a broadly similar order of magnitude.
There are at least four different and non-exclusive reasons in the literature for the timing of this over-shoot and why there was a lag between rising assembly and declining value addition, and determining which matters for policy design.
First, as emerges from the work of Callejas et al. (2024), the finished-good/component asymmetry causes a high tariff-arbitrage cost: If a component is taxed, instead of the finished device, the latter pushes back towards re-addressing the trade in the whole unit. In this explanation the increase in assembly is due not to a real deepening of backward linkages but to the fact that assembly is the lowest cost to avoiding the tax.
Second, even when liberalisation and tariff protection have been combined, as they were in the Tamil Nadu’s electronics cluster, as Saripalle (2015) reports, deep-tier capability investment and development of new suppliers has not happened, and therefore, even if a firm decides to source more locally, it may not find suppliers ready to meet it.
Third, the concentration of upstream capacity, which China commands 86–97% of the global polysilicon, wafer and cell manufacturing, and 51% of India’s imports from China for electronics assembly means that for some inputs, local procurement could not be a practical option in the near term even if the tariff incentive is there, making part of the value-added gap a supply constraint rather than a failure of policy design.
Fourth, the short time frame of the evidence base, namely, that the evidence for identifying scale asymmetries in markups is from prior to 2014, creates some possible scope for lag.
The joint modelling of these four explanations was identified in the Literature Review as being missing from the existing evidence base and it is the most significant future-research task on the research agenda outlined later in this paper.
Discussion
Firm size accounts for the firm-level and macro-level evidence, but only in the sense of the ‘reclassification threshold’ of the MSMED Act (2006). The smaller companies which were reclassified saw a ten-fold growth in the number of importing MSMEs from 39 to 415 which brought about markup gains, not as a direct result of tariff reductions. Tariffs alone did not make MSMEs competitive, but they were combined with other factors that tended to benefit larger businesses with more financial power, tech knowledge and supply chains, while the benefits of tariff reductions were consistently felt by larger businesses.
This is supported by the intermediate input analysis in which mark-ups of importing MSMEs rose significantly after the implementation of the investment ceiling, indicating that the increased investment ceiling facilitated the entry into, and trade liberalization capture of, more global value chains. The Automation Paradox worsened these inequities, in that productivity gains from advanced imported technologies were not consistent. Compliance and technology costs have been distributed, higher production volumes, while in MSMEs there were no internal skills, no infrastructure, no managerial capacity to effectively use these compliance and technology costs. Therefore, to reap the benefits of manufacturing growth, the liberalisation of tariffs must be supported by other measures such as improving access to finance, promoting technology transfer, developing skills and easing compliance requirements, among others. The sustainability of the current tariff and assembly business model as a platform for industrial upgrading from a forward-looking standpoint is important to consider.
Theoretically, the assembly is the first step on a ladder to the economic development, similar to that in East Asia, where FDI and infrastructure promote structural upward scale through the years. But there are three structuralist restrictions to this rosy scenario. First, the shallow-linkage pattern in electronics has been around for more than 10 years; well beyond the typical baby industry learning window. Second, the GVC integration pattern of the economy is still overwhelmingly inward-facing rather than outward-facing, and exports are always less than imports of electronics, the major GVC dependent activity. Third, the Automation Paradox shows how technology upgrading can replace domestic job growth and thus defy expectations of the expected relationship between manufacturing transformation and mass job creation, Sustainable structural change needs to be complemented by institutional and capability building measures in addition to trade policy measures (export linked measures and export supplier development), and not be achieved through trade protection alone.
Limitations and Future Research
The findings presented in this review are limited by four methodological boundaries in the evidence base that suggest future empirical research directions.
Vintage discrepancy. The most important caveat is that the firm-panel regressions relied on by the findings of scale symmetry (Mukherjee & Chanda, 2021, 2024; Singh & Chanda, 2021) only cover the years up to 2009, while the period of tariff escalation dealt with in this paper starts in 2014. It is important to note that the data on firm-level markup and productivity in Table 2 should be interpreted as a structural prior, and not as a direct reflection of the impact of the post-2014 tariff regime on firm markups today. Future research should focus on expanding the firm-level panel to cover the 2014-2026 period, which is the specific period this paper focuses on, and be tested for the scale-asymmetry mechanism.
Sectoral correlation vs causal identification. The evidence on assembly-share and import-dependence changes in the electronics and solar sectors (see Stage Two (Callejas et al., 2024; Poswal, 2025; Saripalle, 2015)) is presented from a case study, audit, and before/after perspective – this does not represent the full research-design rigor of a credible counterfactual, and the changes in assembly-share and import-dependence describe the correlation that exists with policy timing. Future analyses might take advantage of the multiple waves and different magnitudes of the changes in BCDs for each product series and build a difference-in-differences or regression-discontinuity design around the key BCDs thresholds; such a design would enable estimating the magnitude of the sourcing substitution effect with the same rigor that is currently possible for the pre-2009 markup evidence.
Absence of a common interface for the joint. As per the Literature Review and Data Analysis, no source reviewed here has an integrated modeling of consumer price pass-through, firm sourcing substitution, and compliance cost in a single structural or counterfactual. Each is estimated in a separate literature, using different data and on different time period. It is this conceptual gap that ‘Toward an Integrating Framework’ above points to, and closing it is arguably the highest value contribution that this paper can refer to on the research agenda – a unified framework would enable the 8% welfare maximising benchmark, the substitution elasticity of the screwdriver economy, and the compliance-cost burden of MSME to be estimated together, and would allow counterfactual tariff schedules to be simulated and their combined distributive and structural impacts to be quantified before they are put in place, rather than assessed retrospectively as this paper has had to do.
Two areas of non-accountability for compliance costs and threshold sensitivity. However, administrative and compliance costs represent another, although poorly quantified, aspect of the burden of tariffs on MSMEs – these costs are not consistently measured across the sources analysed in this paper, and therefore cannot be combined into estimates of welfare and markup elsewhere in this paper, which likely underestimate the burden on smaller firms. Similarly, the 8% welfare-maximising tariff level which has been used in all the calculations in this paper (which is taken from a single study) is a point estimate, and further studies should report sensitivity analysis around these and also consider other states and sectors to incorporate compliance cost estimates with increasing confidence into future welfare calculations.
Lastly, future research could be usefully pursued through comparing across countries, as Vietnam and Bangladesh are routinely cited as the ‘China+1’ destinations that attracted manufacturing investment India lacked; a systematic comparison between the two countries, isolating out the ‘tariff-specific’ component of India’s underperformance from a broader ease-of-business/ infrastructure/ logistics one, would help to identify how much of the India underperformance documented in Table 1 is due to tariff design per se.
Conclusion
The study finds that liberalisation of tariffs has a positive impact on firm performance in Indian manufacturing, but its impact varies significantly among categories of firms. Large companies generally benefit from tariff cuts on their inputs owing to their greater financial, technological, and value-chain integration capabilities. While MSMEs enjoyed smaller gains initially, institutional reforms as embodied in the MSMED Act have proven more beneficial in enabling them to access intermediate inputs from imports and raise their markups.
The results show that trade liberalization is not, on its own, sufficient to guarantee inclusive industrial development. Complementary factors firm capabilities, the use of new technologies, access to foreign inputs, and supporting policy are all important to the ultimate impact of tariff reform. The Automation Paradox observed in this study also suggests that for technology to translate into sustainable productivity gains, organisations must be prepared to absorb it, supported by a human-capital-development effort that enables that absorption.
In addition to the above long-term evaluation, the core finding of this paper is that while assembly success and structural transformation are not equivalent phenomena, their disconnect between them is evident in the evidence reviewed in this paper: indicators of assembly success and production value have advanced considerably, while indicators of backward linkage, export competitiveness and jobs indicators have lagged significantly, and the latter would most directly confirm a structural shift towards durable integration in GVC. But, on the evidence put before us, that is not likely to be accomplished by tariff policy alone, but will require the kind of complementary institutional reform that was successfully implemented for MSMEs after 2006 and which, planned for that purpose, has to be extended to the export competitiveness and technology absorption margins on which the current regime is weakest.
In conclusion, the study suggests an all-encompassing perspective on trade policy, one that includes tariff-policy reform, institutional strengthening, compliance facilitation, financial assistance, and technology adoption. Well-coordinated policies of this kind can help increase productivity and competitiveness and facilitate better participation by both large companies and MSMEs in global value chains, fostering long-term industrial development and economic growth in India.
References
Callejas, J., Chatterjee, C., & Mohapatra, D. P. (2024). Domestic tariffs and consumer welfare in developing countries: Evidence from India (Working paper). SSRN. https://ssrn.com/abstract=4308204
Economic and Political Weekly. (2024). Do import tariffs increase domestic production or value in world consumption? Economic and Political Weekly.https://www.epw.in/journal/2024/34/indias-industrial-transformation/do-import-tariffs-increase-domestic-production-or.html
Francis, S., & Kallummal, M. (2020). The impact of free trade agreements on India’s electronics manufacturing. Institute for Studies in Industrial Development. https://www.wtcmumbai.org/Presentations.html
Manisha, & Gour, Y. (2025). Assessing the impact of GST on import practices of MSMEs in Haryana: Stakeholder perspectives. International Journal of Engineering, Science and Humanities, 15(2), 28–37. https://www.ijesh.com/j/article/view/252
Mukherjee, S., & Chanda, R. (2021). Tariff liberalization and firm-level markups in Indian manufacturing. Indian Institute of Management Bangalore. https://doi.org/10.1016/j.econmod.2021.105594
Mukherjee, S., & Chanda, R. (2024). Impact of trade liberalisation and MSME classification on productivity of Indian manufacturing firms. Indian Institute of Management Bangalore. https://doi.org/10.1177/00157325241239722
Poswal, S. (2025). Make in India: The comprehensive 11-year report card — A critical analysis of India’s flagship manufacturing initiative (2014–2024) [Research report]. https://saketposwal.com/research/make-in-india-the-comprehensive-11-year-report-card/
Prabhakar, P. (2026, April 9). Rebalancing India’s trade policy: From protection to competitiveness. Centre for Social and Economic Progress. https://csep.org/blog/rebalancing-indias-trade-policy-from-protection-to-competitiveness/Rana, A., & Jindal, S. (2025). Factors affecting Indian solar levelized cost of electricity. Journal of Renewable Energy Studies. https://doi.org/10.1016/j.egycc.2025.100207
Saripalle, M. (2015). Tamil Nadu’s electronics industry: Lessons for ‘Make in India’. Institute for Studies in Industrial Development. https://www.epw.in/journal/2015/26-27/notes/tamil-nadus-electronics-industry.html
Singh, R., & Chanda, R. (2021). Technical regulations, intermediate inputs, and performance of firms: Evidence from India. Indian Institute of Management Bangalore. https://doi.org/10.1016/j.jinteco.2020.103412
Tandon, A. (2025). Strategies in solar PV manufacturing for India. Journal of Energy Policy and Strategy. https://doi.org/10.1016/j.sftr.2025.101315
Vandenbussche, H., & Viegelahn, C. (2016, October 2). The impact of import tariffs on domestic production. CEPR VoxEU. https://cepr.org/voxeu/columns/impact-import-tariffs-domestic-production