Authors:
Khushboo, Garima Sharma, Aditi Shenoy, Arshia M Vinayak, Bhavna, Shamal Gadekar and Reet Chhabra
ABSTRACT
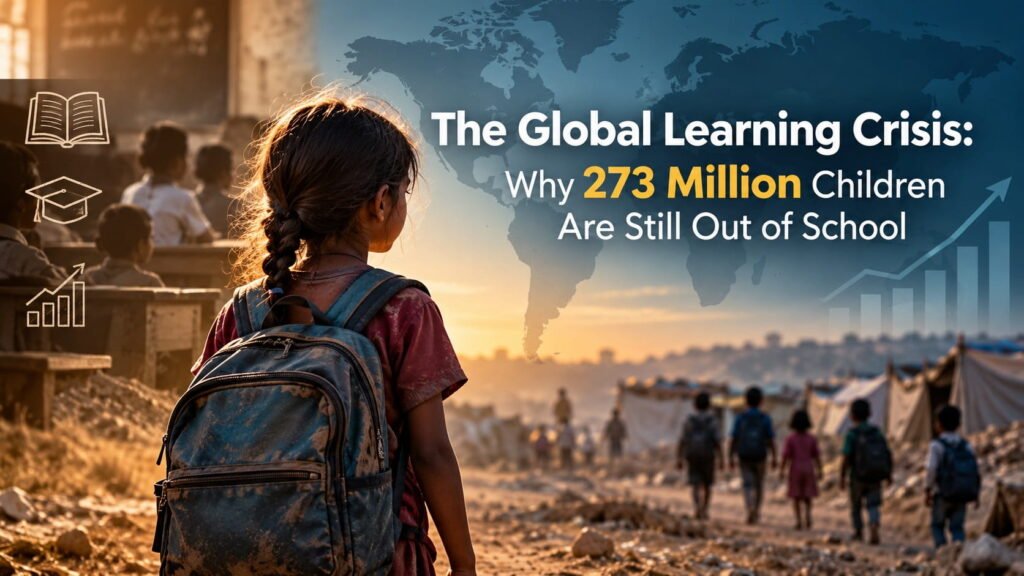
The global learning crisis extends beyond school enrollment to include both children, adolescents and young people who remain out of school and those who attend school without acquiring foundational skills. In 2024, an estimated 273 million children, adolescents and young people were out of school globally. This figure describes exclusion from education and should not be conflated with Learning Poverty (LP), which also captures inadequate reading proficiency among children in school. This study uses a descriptive, quantitative cross-country analysis of publicly available secondary data on LP, school completion, poverty and conflict-related displacement. Data were drawn from the World Bank Learning Poverty Database and Poverty and Inequality Platform, UNESCO Institute for Statistics and Global Education Monitoring data, and the Internal Displacement Monitoring Centre. The analysis reports descriptive statistics, gender completion gaps, and Pearson and Spearman correlations. LP ranged from 2.49% to 82.02% across 21 unique countries represented by 22 observations. In the 67-country completion dataset, average female completion exceeded average male completion at primary, lower secondary and upper secondary levels, with mean gaps of 2.12, 2.83 and 7.07 percentage points, respectively. In the matched 17-country sample, poverty headcount was positively associated with LP (Pearson r = +0.68; Spearman rho = +0.72; p < 0.01). Displacement records were reviewed as context but were not used to calculate crisis-group estimates because country coverage and reporting periods were not sufficiently harmonized. The findings are sample-specific and associational, not causal. The study highlights the value of examining access, completion and foundational learning together while recognizing the limits of the available data.
Keywords:
Learning Poverty; out-of-school children; school completion; poverty; gender; conflict and displacement; foundational learning
INTRODUCTION
Education has expanded across the world, yet access to school does not guarantee that children acquire foundational skills. The global learning crisis therefore involves two related but distinct challenges: exclusion from education and inadequate learning among children who attend school. The World Bank and UNESCO Institute for Statistics framework defines Learning Poverty (LP) around the inability to read and understand a simple, age-appropriate text by around age ten, while also accounting for primary-school-age children who are out of school [19, 20].
UNESCO’s 2026 Global Education Monitoring Report estimates that 273 million children, adolescents and young people were out of school in 2024, including 140 million boys and 133 million girls. It also reports global on-time completion rates of 88% for primary education, 78% for lower secondary education and 61% for upper secondary education in 2024 [15]. These global indicators describe access and completion; they are not estimates of LP and are not interchangeable with the country samples analyzed in this study.
Foundational learning is central to Sustainable Development Goal 4 because literacy supports further learning and participation in social and economic life [16, 18]. Educational disadvantage is unevenly distributed. Poverty, gender inequality, geographical isolation, disability, conflict, displacement and unsafe learning environments may overlap, but the indicators used to describe these conditions measure different things [13, 14, 10, 5].
This study examines four connected dimensions: LP and the quality of schooling; poverty as a socioeconomic indicator; gender-disaggregated completion; and conflict and displacement as a broader crisis context. It asks three quantitative questions: how LP varies in the available country observations, whether national poverty headcount is associated with LP in the matched sample, and how female and male completion rates differ across primary, lower secondary and upper secondary education. Conflict and displacement are considered contextually. Because the relevant records could not be sufficiently harmonized with the education indicators, the study does not calculate comparative crisis-group estimates.
The study offers an exploratory comparative view of several forms of educational disadvantage while keeping the indicators analytically distinct. Its scope is limited by uneven country coverage, different reporting years and small matched samples. The findings are therefore interpreted as descriptive patterns and associations within the available data, not as causal estimates or representative results for the world as a whole.
LITERATURE REVIEW
Research reviewed for this paper points to a multidimensional understanding of the global learning crisis. It distinguishes access to education from foundational learning and places both within socioeconomic, gender and crisis-related contexts. Enrolment, completion and learning are related outcomes, but they are not interchangeable. This distinction guides the way the present study describes its indicators and interprets its results.
Theme 1: Learning Poverty and Education Quality
The LP framework combines learning deprivation among children in school with schooling deprivation among primary-school-age children who are out of school. It draws attention to the difference between being enrolled and acquiring foundational literacy [19, 20, 21, 22]. The literature on education quality also emphasizes that access alone is not sufficient: instructional materials, teacher capacity, appropriate pedagogy and classroom conditions affect what children learn [16, 18].These sources provide a rationale for using LP as the primary learning outcome, but country-level estimates are constrained by the coverage and timing of available assessments. The country observations used here span different reporting years and do not form a fully harmonized global panel. LP values in this study must therefore be interpreted as observations in the supplied sample, not as current or representative estimates for all countries.
Theme 2: Poverty, Financial Barriers, and Educational Inequality
Economic disadvantage can affect participation through direct schooling costs, transport constraints, household work and child labor. It can also affect learning conditions through nutrition, health, access to materials and the support available for study [4, 7, 12]. These pathways help explain why poverty is a relevant socioeconomic context for education, but the cited research covers different settings and outcomes.
National poverty headcount and LP are available as country-level indicators, making a matched comparison possible where country and year fields align. A correlation between them remains associational, however, and cannot isolate the influence of household conditions from education-system quality, health, geography, language or other factors. The present study therefore treats the poverty-LP result as exploratory rather than as evidence of a direct causal pathway.
Theme 3: Gender, Completion, and Educational Inequality
Research on girls’ education documents barriers associated with domestic responsibilities, early marriage, safety, economic constraints and gender bias [3, 10, 17, 14]. The extent and direction of gender disparities vary by context, so one average across countries cannot describe every education system. The present analysis accordingly reports the female-minus-male mean completion gap in the supplied dataset without interpreting it as a universal pattern.
Completion rates are indicators of participation and persistence, not direct measures of learning mastery, school quality, safety or later labor-market outcomes. They also cannot, on their own, establish why a gap exists. The analysis compares completion by gender at three educational levels and treats possible explanations as contextual interpretations rather than mechanisms tested by the data.
Theme 4: Conflict, Displacement, and Child Protection
Conflict and forced displacement can disrupt education through insecurity, damaged infrastructure, teacher shortages, interrupted attendance, documentation barriers and difficulties integrating displaced learners into host systems [5, 6, 8, 9, 11]. Research also highlights how disability can compound exclusion for displaced learners [2]. Gender-based violence and wider protection risks can further undermine safe participation in education [1, 17]. These are documented concerns in crisis education research, but they are not variables directly measured in the present country-level analysis.
The displacement records available for this paper could not be aligned sufficiently by country and reporting year with LP and completion data. They are therefore retained as contextual material only. No quantitative estimate of the relationship between displacement and LP, or between crisis group and school completion, is reported.
Research Gap
The sources reviewed for this paper tend to examine learning quality, poverty-related disadvantage, gender patterns or crisis-related disruption separately, and they differ in indicators, country coverage and reporting years. This study addresses that gap in a limited, exploratory way by examining LP variation, the poverty-LP association and gender differences in completion within the available samples, while placing conflict and displacement in their broader context. Its contribution is the transparent comparison of complementary indicators, not the identification of a single cause or a fully harmonized global estimate.
METHODOLOGY
Research Design
The study uses a descriptive, quantitative cross-country design based on publicly available secondary data. It reports LP descriptive statistics, compares female and male completion rates, and estimates Pearson and Spearman correlations for matched poverty and LP observations. Displacement-related records are used for context only because country coverage and reporting years are not sufficiently aligned with the education indicators for quantitative group comparisons.
Study Setting / Context
The study is situated at the cross-country level and draws on international datasets with different country coverage, indicator definitions and reporting years. It is not a single harmonized country-year panel. This constraint limits direct comparison across indicators and is treated as a central methodological limitation.
Population and Sample / Participants
The unit of analysis is a country-level observation in each selected dataset. No human participants were recruited or interviewed. The final analytical samples comprise 22 LP observations across 21 unique countries, 67 country observations for gender-disaggregated completion, and 17 matched country observations for the poverty-LP analysis after duplicate resolution. Displacement records were reviewed as context and were not used to calculate crisis-group estimates.
Sampling Technique
No participant sampling was undertaken. Country observations were retained according to data availability and the degree to which indicators could be compared. The resulting samples are data-availability samples, not probability samples of countries.
Data Sources / Instruments
Table 1. Data sources, indicators, and role in the study
|
Source |
Indicator / Data |
Role in Study |
|
World Bank Learning Poverty Database |
Learning Poverty rate |
Primary learning outcome |
|
World Bank Poverty and Inequality Platform |
Poverty headcount ratio |
Socio-economic indicator |
|
UNESCO Institute for Statistics / Global Education Monitoring data |
Gender disaggregated completion rates |
Educational completion outcome |
|
Internal Displacement Monitoring Centre |
Displacement counts and crisis context |
Contextual source only; not used for quantitative group estimates |
Variables / Constructs
LP combines the share of primary-school-age children who are out of school with the share of children in school who do not meet minimum reading proficiency, following the World Bank and UNESCO Institute for Statistics framework [19, 20]. Completion rates are female and male completion rates at primary, lower secondary and upper secondary levels. Socioeconomic disadvantage is represented by national poverty headcount ratios from the World Bank Poverty and Inequality Platform. The gender gap is calculated as female mean completion minus male mean completion. Conflict and displacement records are contextual indicators only and are not used for quantitative estimates in this paper.
Data Collection Procedure
The study used publicly available secondary datasets. Indicators were extracted from the selected international databases, and country and reporting-year fields were matched where comparable. Duplicate observations were reviewed before analysis. Initial matching of LP and poverty headcount data produced 18 matching rows across 17 unique countries because Poland appeared twice for 2016. The duplicate was resolved by retaining the primary standardized national benchmark observation, leaving 17 unique observations for the final bivariate analysis.
Data Analysis / Analytical Framework
The analysis proceeded in three stages. First, descriptive statistics were calculated for LP, including the mean, median, standard deviation, minimum and maximum. Second, female and male completion rates were compared at primary, lower secondary and upper secondary levels using percentage-point differences. Third, Pearson correlation and Spearman rank correlation were calculated for matched poverty and LP observations after country-year matching and duplicate resolution. Displacement records were not used to estimate crisis-group differences because the available data could not be sufficiently harmonized with LP and completion measures.
Validity / Reliability / Trustworthiness
Quality assurance focused on transparent data matching, duplicate resolution, consistent variable definitions and explicit reporting of sample coverage and reporting-year differences. Each indicator is reported using its available analytical sample rather than being treated as part of a common panel. These steps improve transparency, but the small and non-harmonized samples limit generalizability and preclude robust multivariable modeling.
Ethical Considerations
The study uses publicly available secondary data and does not involve direct interaction with human participants or the collection of personal information. Ethical practice therefore centers on accurate reporting, transparent documentation of sources, appropriate citation and avoidance of selective interpretation. The observational design is interpreted as descriptive and associative, not causal.
DATA ANALYSIS AND INTERPRETATION
This section reports the quantitative findings for LP variation, gender-disaggregated completion and the association between poverty and LP. Conflict and displacement are discussed as contextual factors only because the available records do not support a sufficiently harmonized quantitative comparison.
Preliminary / Descriptive Results
Table 2. Baseline descriptive statistics
|
Variable |
n |
Mean (%) |
Median (%) |
Minimum (%) |
Maximum (%) |
Standard deviation (SD) |
|
LP Rate |
22 |
15.99 |
7.38 |
2.49 |
82.02 |
20.18 |
|
Primary Completion (Female) |
67 |
94.23 |
99.06 |
49.70 |
100.00 |
10.59 |
|
Primary Completion (Male) |
67 |
92.11 |
98.53 |
50.31 |
99.98 |
12.68 |
|
Lower Secondary Completion (Female) |
67 |
85.09 |
96.12 |
20.85 |
100.00 |
21.08 |
|
Lower Secondary Completion (Male) |
67 |
82.26 |
94.57 |
23.91 |
99.79 |
21.20 |
|
Upper Secondary Completion (Female) |
67 |
70.68 |
81.67 |
3.30 |
100.00 |
26.53 |
|
Upper Secondary Completion (Male) |
67 |
63.61 |
70.53 |
6.54 |
98.01 |
25.73 |
Across 22 observations covering 21 unique countries, LP ranged from 2.49% to 82.02%. The mean was 15.99%, higher than the median of 7.38%, which indicates a right-skewed distribution. Sweden recorded the lowest observation and South Africa the highest in the supplied sample. These values reflect the observations and reporting years available for this study, not estimates for all countries worldwide.
Results by Research Question / Objective
In the supplied 67-country 2025 completion dataset, average female completion was higher than average male completion at all three educational levels. The female-minus-male gap was 2.12 percentage points at primary level, 2.83 points at lower secondary level and 7.07 points at upper secondary level. This is a sample-specific result and should not be read as a universal global gender pattern or as evidence that gender itself caused the observed differences.
Table 3. Gender differences in completion rates
|
Educational Level |
Female Mean (%) |
Male Mean (%) |
Female – Male Gap (percentage points (pp)) |
|
Primary Completion |
94.23 |
92.11 |
+2.12 |
|
Lower Secondary Completion |
85.09 |
82.26 |
+2.83 |
|
Upper Secondary Completion |
70.68 |
63.61 |
+7.07 |
In the matched sample of 17 countries, national poverty headcount was positively associated with LP. Pearson’s r was +0.68 and Spearman’s rho was +0.72, with the reported p value below 0.01. The consistency of the two coefficients supports a positive association within this small matched sample, but the result should not be generalized to all countries and does not establish that poverty causes LP.
Table 4. Bivariate association between poverty headcount and Learning Poverty
|
Matched Analysis |
n |
Pearson r |
Spearman rho |
p value |
|
Poverty Headcount vs Learning Poverty |
17 |
+0.68 |
+0.72 |
< 0.01 |
Figures / Graphs
Figure 1 shows mean completion rates by gender and educational level. The widening gap across the three levels is a finding within the supplied 67-country 2025 dataset and is not presented as a universal global gender pattern.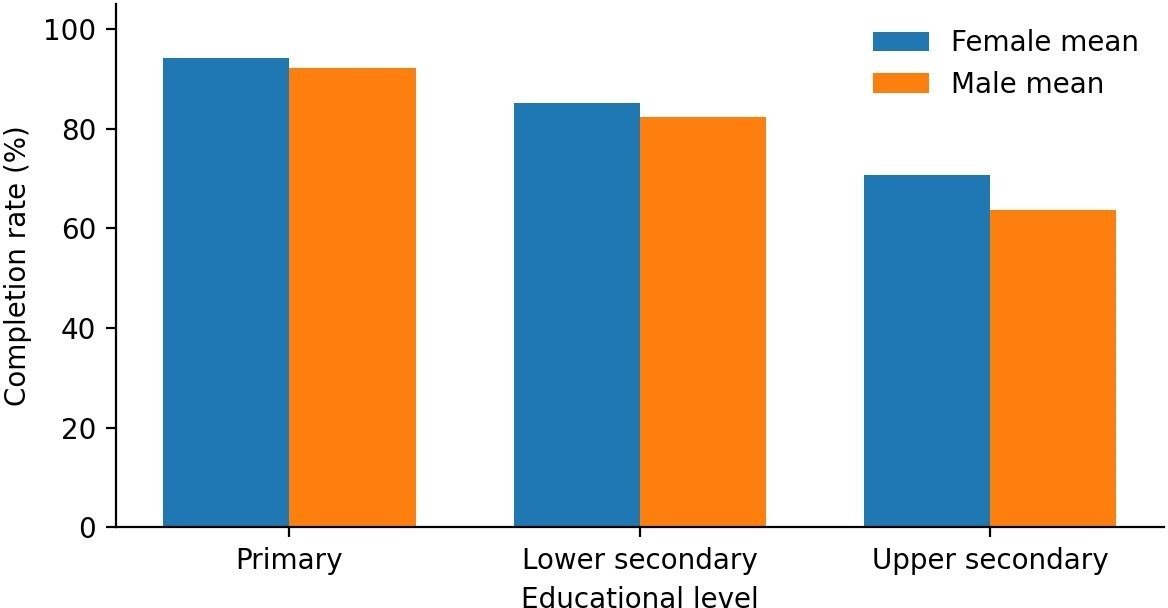
Figure 1. Mean completion rates by gender and educational level
Source: Authors’ calculations based on the supplied 67-country 2025 completion-rate dataset.
Interpretation / Discussion of Findings
1. Variation in Learning Poverty
Across the 21 countries represented by 22 observations, LP ranged from 2.49% in Sweden to 82.02% in South Africa. The sample mean was 15.99%, and the median was 7.38%. The mean exceeding the median indicates a right-skewed distribution, with a smaller number of observations recording substantially higher LP. These figures describe the supplied sample and its mix of reporting years; they should not be interpreted as a picture of all countries.
Possible explanations. The LP framework distinguishes school enrollment from the acquisition of foundational reading skills. Research highlights teacher preparation, instructional materials, language of instruction, early learning opportunities and classroom conditions as factors that may contribute to differences in learning outcomes [16, 18, 19, 20]. These factors were not measured directly in this study and remain possible explanations rather than findings.
2. Poverty and Learning Poverty
In the matched sample of 17 countries, a higher national poverty headcount ratio was associated with higher LP (Pearson r = +0.68; Spearman rho = +0.72; reported p < 0.01). Agreement in direction across the two coefficients supports a positive association in this sample. It is the clearest statistical relationship estimated in the paper, but it is a bivariate correlation based on a small matched sample and should not be generalized globally.
Possible explanations. Previous research links economic disadvantage with barriers to schooling and learning, including child work, limited resources and constraints on the conditions in which children study [4, 7, 12]. The present analysis did not test these mechanisms. Education-system quality, geography, language, health, inequality and crisis exposure may also be relevant. The correlation cannot establish that poverty causes LP or that poverty alone explains the observed variation.
3. Gender and School Completion
In the supplied 67-country 2025 completion dataset, average female completion was higher than average male completion at primary, lower secondary and upper secondary levels. The gaps were 2.12, 2.83 and 7.07 percentage points, respectively, with the largest difference at upper secondary level. This pattern applies to the countries and reporting year represented in the sample; it is not a universal global gender pattern. Completion rates indicate participation and persistence, but do not measure learning mastery, school quality, safety or later labor-market outcomes.
Possible explanations. The literature describes barriers affecting girls, including early marriage, domestic responsibilities, safety concerns, economic constraints and gender bias [3, 10, 17, 14]. Such contextual factors could be relevant to completion, but this study did not test them. The finding should not be taken to mean that gender inequality in education has disappeared, nor does it establish that gender caused the observed difference.
4. Conflict and Displacement as Context
Conflict and displacement are important contexts for understanding educational disruption, but the available displacement records could not be harmonized sufficiently by country and reporting year with the LP and completion datasets. In line with this limitation, this paper does not report numerical estimates of crisis-group differences or a quantitative association between displacement and LP.
Possible explanations from the literature. Research on crisis settings describes how insecurity, damaged infrastructure, teacher shortages, interrupted attendance, language barriers, documentation requirements and protection risks can impede education [1, 5, 6, 8, 9, 11, 17]. These mechanisms were not measured in the current analysis. They provide context for the research question, not empirical explanations established by this dataset.
5. Overall Synthesis and Limitations
Taken together, the findings show wide variation in LP across the sampled countries, a positive poverty-LP association in the matched 17-country sample, and higher average female completion than male completion in the supplied 67-country dataset. Conflict and displacement remain relevant contextual dimensions, but the available records do not support quantitative estimates that link them to the learning and completion outcomes analyzed here. The study brings these dimensions together without treating them as interchangeable or claiming a single cause.
The principal limitations are uneven country coverage, differences in reporting years, small matched samples and an observational design. The LP sample covers 21 unique countries, the completion sample covers 67 countries and the poverty-LP analysis includes 17 matched observations. These are separate samples, not a common global panel. The results should therefore be interpreted as exploratory and sample-specific. Future work would benefit from consistent country-year coverage, access to the underlying matched dataset, larger samples, multivariable or panel analysis, and country-level qualitative research.
The findings support continued attention to both educational access and the conditions that allow children to learn, including foundational literacy, teacher capacity, learning materials, social protection, inclusive completion strategies and crisis-responsive education systems. However, this study does not evaluate the causal effect of any particular intervention.
CONCLUSION
The global learning crisis cannot be understood only by asking whether children are in school. It also requires attention to whether children acquire foundational skills and to the social and economic conditions surrounding education. This study examined that broader problem using secondary data on Learning Poverty (LP), school completion, poverty and conflict-related displacement.
LP ranged from 2.49% to 82.02% across the 21-country sample represented by 22 observations. In the supplied 67-country 2025 completion dataset, average female completion was higher than average male completion at primary, lower secondary and upper secondary levels, with the largest average difference at upper secondary level. In the matched 17-country sample, national poverty headcount was positively associated with LP (Pearson r = +0.68; Spearman rho = +0.72; reported p < 0.01). These are sample-specific findings, and the observational design does not support causal interpretation. Conflict and displacement were retained as contextual dimensions, but the available records were not sufficiently harmonized to estimate their relationship with LP or completion.
Overall, the study supports a multidimensional understanding of educational disadvantage while recognizing the limits of the available evidence. It demonstrates the importance of data cleaning, duplicate resolution and country-year matching when indicators from international sources are combined. Future research should use larger datasets with consistent country-year coverage and harmonized indicators, supported by multivariable and panel models as well as country-level qualitative research. Such work would help explain why similar barriers may coincide with different educational outcomes across contexts.
REFERENCES
[1] Amaral, S., Garcia-Ramos, A., Gulesci, S., Ramos, A., Oré-Quispe, S. P., & Sviatschi, M. M. (2024). Gender-based violence in schools and girls’ education: Experimental evidence from Mozambique. NBER Working Paper No. 33203. National Bureau of Economic Research. https://www.nber.org/system/files/working_papers/w33203/w33203.pdf?
[2] Costantini, G., & El-Serafy, Y. (2025). Exacerbating exclusion? How the logic of refugee education perpetuates the exclusion of refugees with disabilities in Lebanon. International Review of Education, 71, 301-319. https://doi.org/10.1007/s11159-025-10132-x
[3] Evans, D. K., & Yuan, F. (2022). What we learn about girls’ education from interventions that do not focus on girls. The World Bank Economic Review, 36(1), 244-267. https://doi.org/10.1093/wber/lhab007
[4] Ferguson, H. B., Bovaird, S., & Mueller, M. P. (2007). The impact of poverty on educational outcomes for children. Paediatrics & Child Health, 12(8), 701-706. https://doi.org/10.1093/pch/12.8.701
[5] Ferris, E., & Winthrop, R. (2010). Education and displacement: Assessing conditions for refugees and internally displaced persons affected by conflict. Background paper prepared for the Education for All Global Monitoring Report 2011, The Hidden Crisis: Armed Conflict and Education.https://www.brookings.edu/articles/education-and-displacement-assessing-conditions-for-refugees-and-internally-displaced-persons-affected-by-conflict/?
[6] Fransen, S., Vargas-Silva, C., & Siegel, M. (2018). The impact of refugee experiences on education: Evidence from Burundi. IZA Journal of Development and Migration, 8, Article 6. https://doi.org/10.1186/s40176-017-0112-4
[7] Malik, B. K. (2013). Child schooling and child work in India: Does poverty matter? International Journal of Child Care and Education Policy, 7, 80-101. https://doi.org/10.1007/2288-6729-7-1-80
[8] Palik, J., & Østby, G. (2023). Interventions to improve refugee children’s access to education and quality learning: A scoping review of existing impact evaluations. International Review of Education, 69(1-2), 227-247. https://doi.org/10.1007/s11159-023-10004-2
[9] Pherali, T., & Rinehart, G. (2026). Addressing educational gaps in conflict and crisis settings: A rigorous review of interventions for children with disabilities, language minorities and the internally displaced. Education and Conflict Review, 7, 55-70. https://doi.org/10.14324/000.ch.10223220
[10] Psaki, S., Haberland, N., Mensch, B., Woyczynski, L., & Chuang, E. (2022). Policies and interventions to remove gender-related barriers to girls’ school participation and learning in low-
and middle-income countries: A systematic review of the evidence. Campbell Systematic Reviews, 18(1), e1207. https://doi.org/10.1002/cl2.1207
[11] Rinehart, G., Pherali, T., Chase, E., Zaw, H. T., & Naing, T. (2024). Diversity and fragmentation of Myanmar education: Schooling shaped by protracted conflict and crisis. ERICC Research Consortium.https://discovery.ucl.ac.uk/id/eprint/10200901/utm_source=chatgpt.com
[12] Sasmal, J., & Guillen, J. (2015). Poverty, educational failure and the child-labour trap: The Indian experience. Global Business Review, 16(2), 270-280. https://doi.org/10.1177/0972150914564419
[13] UNESCO. (2020). Global Education Monitoring Report 2020: Inclusion and education: All means all. Paris: UNESCO. https://www.unesco.org/gem-report/en/publication/2020-inclusion-and-education-all-means-all?utm_source=chatgpt.com
[14] UNESCO. (2023). Inclusion and gender equality: Brief on inclusion in education. UNESCO.https://www.unesco.org/en/articles/inclusion-and-gender-equality-brief-inclusion-education?utm_source=chatgpt.com
[15] UNESCO. (2026). Global Education Monitoring Report 2026: Access and equity: Countdown to 2030. Paris: UNESCO. https://doi.org/10.54676/JLKL3223
[16] UNICEF. (2022). Are children really learning? Exploring foundational skills in the midst of a learning crisis. New York: UNICEF.https://data.unicef.org/resources/are-children-really-learning-foundational-skills-report/?utm_source=chatgpt.com
[17] United Nations Girls’ Education Initiative. (2020). In solidarity with girls: Gender and education in crisis. UNGEI.https://www.ungei.org/news/policy-brief-series-gender-and-education-crisis?utm_source=chatgpt.com
[18] World Bank. (2018). World Development Report 2018: Learning to realize education’s promise. Washington, DC: World Bank.https://www.worldbank.org/en/publication/wdr2018?utm_source=chatgpt.com
[19] World Bank. (2021). Learning Poverty Measure. World Bank. https://www.worldbank.org/en/brief/2021/07/01/learning-poverty-measure
[20] World Bank. (2021). What is Learning Poverty? World Bank. https://www.worldbank.org/en/brief/2021/04/28/what-is-learning-poverty
[21] World Bank. (2022). Ending Learning Poverty. World Bank. https://www.worldbank.org/en/brief/2022/10/12/ending-learning-poverty
[22] World Bank, UNESCO, UNICEF, United States Agency for International Development, Foreign, Commonwealth & Development Office, & Bill & Melinda Gates Foundation. (2022). The State of Global Learning Poverty: 2022 Update. World Bank.https://www.worldbank.org/en/topic/education/publication/state-of-global-learning-poverty?utm_source=chatgpt.com