Authors: Krittika Kachrani, Rebha Bishnoi, Shan Biswas, Prashant, Roshani, Sujeeta Kumari
Abstract
Plastic pollution in Indian water bodies is increasingly recognized as an environmental and public health concern, but the available evidence may not fully represent the extent of contamination, particularly at smaller particle sizes. This review examines the sources and transport pathways of macroplastics and microplastics in Indian aquatic environments, their potential routes of human exposure, and the limitations of currently used detection methods. A structural literature review was conducted using Google Scholar and major academic databases, covering primarily peer-reviewed literature published between 2020 and 2026. Approximately 1,750 records were screened, 87 articles underwent full-text assessment, and 42 studies were included in the final synthesis. The reviewed evidence indicates that plastic enters Indian water bodies through multiple pathways, including municipal waste, sewage, industrial discharge, agricultural runoff, tourism, and ocean-based activities. Larger plastic debris can subsequently fragment into smaller particles, which may enter aquatic food webs and reach humans through drinking water, seafood, and other exposure pathways. However, substantial differences exist in sampling methods, size cut-offs, analytical techniques, and reporting practices. Visual sorting and FTIR-based approaches commonly used in Indian studies are more effective for larger particles, while smaller microplastic fractions are less consistently detected. Raman spectroscopy can provide greater sensitivity for smaller particles, although its routine use is limited by cost, fluorescence interference, and technical requirements. Evidence on nanoplastics in Indian water bodies remains particularly limited. Overall, the findings suggest that current monitoring may underestimate the smaller fraction of plastic contamination and therefore provide an incomplete picture of potential human exposure. Standardized sampling and analytical protocols, greater attention to health-relevant particle size ranges, and targeted use of advanced techniques such as μFTIR and Raman spectroscopy are needed. A combination of hotspot mapping and focused high-resolution sampling may provide a practical approach for strengthening plastic pollution surveillance in India.
Introduction
Plastic pollution is a rising issue in India’s water systems, leading to environmental concern. Annually, India produces approximately 9.4 million tonnes of plastic waste, with almost 40 percent of this amount remaining uncollected. This uncollected waste is often disposed of into drains, rivers, and ultimately the ocean. This situation is not a minimal leakage issue; it highlights a fundamental flaw in waste management that becomes evident months or years later through contamination levels in rivers that were not being closely monitored. Despite this, the research focus on this problem in India is significantly limited compared to its actual magnitude. “A recent review searching specifically for India-focused freshwater microplastic studies identified only 18 papers covering the entire country, which is a notably sparse evidence base considering India’s population, vast geography, and numerous rivers, lakes, and groundwater systems that are essential for daily life throughout the nation.” Before health risks or detection failures can be meaningfully discussed, this basic mismatch between the scale of the contamination problem and the scale of the available evidence must be acknowledged.
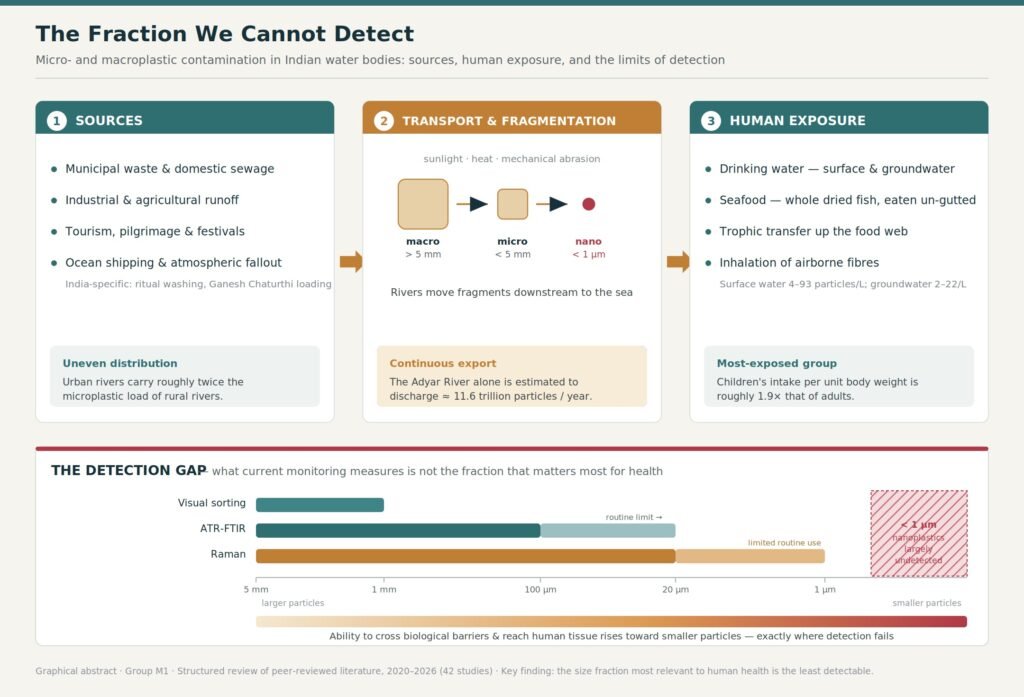
Plastic pollution is treated as if macroplastics and microplastics are separate topics; however, they are part of a continuous process driven by fragmentation. Larger waste items such as bottles, packaging, and fishing nets, do not simply decompose when they enter water bodies. Instead, they are gradually broken down by sunlight, heat, and mechanical abrasion into smaller pieces. “When a fragment becomes less than five millimetres, it is classified as a microplastic, and further weathering can reduce it to the sub-micron and nanoplastic scales.” Macroplastics can harm animals and cause entanglement, leading to immediate and visible ecological harm. In contrast, microplastics are also consumed by plankton and fish larvae at the base of the food chain and subsequently move up through trophic transfer. This also makes them the most likely to directly infiltrate human tissue. However, they are also the most challenging for current Indian monitoring systems to identify. Viewing macro-, micro-, and nanoplastics as a continuous spectrum of sizes, instead of distinct and unrelated groups, is crucial for comprehending the disproportionately large impact of the inability to detect the smaller particles on human health.
“Studies have revealed that plastic pollution in India is unevenly distributed, both geographically and by water body type. Urban rivers have significantly higher levels of microplastics than rural rivers.” For instance, a study comparing two rivers in Chennai with a rural river near Munnar reported that urban rivers had nearly twice the concentration of microplastics. The Adyar River alone is estimated to carry approximately 11.6 trillion microplastic particles into the Bay of Bengal annually. The uneven spread of both contamination and research efforts has led to broad claims about “microplastic pollution in India” being based on a limited number of studies from specific regions. These studies were then generalized to represent the entire country, despite its vast size and diverse water systems. Therefore, it is important to identify areas with high contamination and those lacking research to conduct a thorough analysis of exposure and detection gaps in these areas.
Human exposure to microplastics and nanoplastics occurs through several routes, including contaminated water and seafood. In India, microplastics have been detected in both surface water and groundwater used for drinking and domestic purposes. Seafood is another important source of exposure. Unlike larger fish, which are cleaned before consumption, small dried fish are eaten whole and can retain their full microplastic content. A study from seven Asian countries reported the presence of microplastics in commercially available dried fish products. Children and toddlers are considered the most vulnerable group, with microplastic intake per kilogram of body weight estimated to be 1.9 and 1.6 times higher than adults, respectively.
Once inside the body, these particles may affect human health. Microplastics and nanoplastics have been detected in human blood, lungs, placenta, and arterial plaques, and have been associated with oxidative stress, inflammation, and cellular damage. In an experimental study, long-term exposure to approximately 176 nm PET nanoplastics caused DNA damage and cancer-related changes in human lung cells, while no such effects were observed after shorter exposure periods. These findings suggest that prolonged exposure to very small plastic particles may pose important health risks.
Microplastics are generally defined as plastic particles ranging from 1 µm to 5 mm, while particles smaller than 1 µm are classified as nanoplastics. These smallest particles are more likely to cross biological barriers and mostly remain undetected by routine monitoring methods. Over the years the techniques such as ATR-FTIR and Raman spectroscopy have improved microplastic detection but they have limited sensitivity for these nanoplastics. This shows that the true health burden of plastic pollution remains uncertain because many nanoplastics go undetected and no health-based reference values are available to assess their risk .
This review documents the sources, transport pathways, and human exposure routes of plastic pollution in Indian water bodies alongwith highlighting the limitations of current detection methods. It combines peer-reviewed studies published between 2020 and 2026, using Indian evidence wherever available and international studies where Indian data is limited, especially for health effects. The environmental and health impacts of plastic pollution is also discussed in the review together with identifying key research gaps, and proposing potential mitigation strategies.
Methodology
This study implemented a structural literature review approach to synthesise existing research on the sources, transport pathways, environmental and human exposure, also its detection challenges associated with microplastics and macroplastics in Indian water bodies. The literature search was done using Google Scholar as the primary search platform, with the relevant studies identified from academic databases and publisher platforms including ScienceDirect, SpringerLink, PubMed, ACS Publications, MDPI, Nature, Frontiers, Wiley Online Library, and PLOS ONE. The search was focused around eight thematic areas: general literature on plastic pollution, sources and transport pathways, environmental impact & its effects on human health, analytical detection methods, emerging technologies, research gaps, and also Indian case studies. Representative search combinations included “microplastic” OR “macroplastic” AND “water bod*”, “microplastic” AND India AND (river OR lake* OR freshwater), “microplastic detection” AND (FTIR OR “Raman spectroscopy”), and “plastic pollution” AND (“remote sensing” OR “machine learning”), with Boolean operators (AND, OR, NOT) and truncation (*) used where appropriate. Records were first screened by title and abstract, followed by full-text assessment of potentially relevant studies. Duplicate records identified through comparison of titles, authors, DOI, and publication details were removed before the screening – Where differences arose among team members regarding the relevance or inclusion of a study, they were discussed and resolved through consensus. Studies were included if they were English-language, peer-reviewed journal articles, systematic reviews, or review articles published primarily between 2020 and 2026 and addressed microplastic or macroplastic pollution in aquatic environments or any of the predefined themes. A limited number of earlier foundational studies, such as Wright and Kelly (2017), were kept where they provided vital baseline knowledge on health effects & detection methods. The selected literature was thematically synthesised with attention to differences in study locations, sampling approaches, analytical techniques, detection limitations, exposure pathways, and methodological gaps – in order to identify recurring patterns and to explain the challenges associated with detecting the fraction of plastic contamination that may remain unrecognised in Indian water bodies.
Search strings were run individually by each team member across the databases listed in Section 2.1. Records were filtered by removing duplicates, and titles and abstracts of approximately 1,750 records were screened collectively by all eight team members ; studies irrelevant to the research objectives were excluded. Following initial exclusions, 87 papers were kept, which were further evaluated under the inclusion criteria, resulting in a final selection of 42 studies included in the review.
| Stage | Count | Notes |
| Records screened (title/abstract) | 1,750 | |
| Excluded at screening stage | 1,663 | Studies irrelevant to the research objectives |
| Full-text screened | 87 | Papers read/referenced |
| Excluded after full-text review | 45 | Conference abstracts, non-English papers, duplicate studies, studies unrelated to aquatic environments or water bodies, non-peer-reviewed papers |
| Studies included in final synthesis | 42 |
Table 1. Literature search and study selection process.
Distribution of the 42 peer-reviewed studies included in the review across the eight theme-based search categories defined in Section 3.3.
| Search category (Section 3.3) | No. of studies | % of total (n = 42) |
| Indian case studies | 17 | 40.50% |
| Human health effects | 12 | 28.60% |
| Analytical detection methods | 4 | 9.50% |
| Emerging technologies (remote sensing, UAV, treatment) | 4 | 9.50% |
| Environmental impacts | 2 | 4.80% |
| General review articles | 2 | 4.80% |
| Sources of plastic pollution | 1 | 2.40% |
| Research gaps | 0 | 0.00% |
Table 2. Distribution of Included Studies by Search Category
Note: “Research gaps” was used during search and screening to surface literature discussing limitations and open questions, but no single paper was retained under this label alone as its primary classification; relevant content was instead drawn from studies classified above and synthesized in Section 3.9.
Information extracted from each study included author(s), publication year, study location, the main study objective, sources of plastic pollution, exposure pathway, analytical methods used, sample type, major findings, identified limitations, challenges faced, and relevance to the review objectives. While the literature was initially organized into eight different categories during the search and screening stage (see Section 2.3), the extracted data was then grouped into five major themes: (1) sources and transport pathways of plastic pollution, (2) environmental and human exposure, (3) analytical detection methods, (4) methodological limitations, and (5) future research directions. By organizing the data into themes, similarities, differences, and recurring research gaps across studies were identified and compared qualitatively.
This review paper is limited to English-language peer-reviewed publications published between 2020 to 2026. The findings from this paper depend entirely on publicly published literature and do not include any regional or unpublished literature. Due to the methodological differences in the reviewed studies, it was sometimes difficult to draw direct comparisons, which may affect the consistency of conclusions synthesized in this review.
Literature Review
Plastic Pollution and The Micro/Macroplastic Problem in India
Plastic didn’t become the preferred material on Earth without a reason. It’s cheap, light weight, keeps its form in all but the most extreme conditions, it can be moulded to virtually anything you need as a factory and that’s part of the reason it was so irresistible to manufacture and also practically impossible to eliminate. Unlike other organic wastes, plastic does not decompose but rather breaks into smaller pieces. Sunlight, friction, heat, years of weathering a bottle or a fishing net eventually gets ground down into smaller pieces and that’s the entire distinction between macroplastics and microplastics. Macroplastics are what you can see and pick up. Microplastics, usually under five millimetres, are what’s left once that larger debris starts falling apart, plus a smaller share manufactured at that tiny size to begin with, mostly for cosmetics and industrial use (Mashirin & Chitra, 2022).
Microplastics impede wildlife living in close proximity. Both types of plastics can entangle and choke the wildlife. Microplastics, but, are much less harmful. They can be eaten by plankton and fish larvae at the base of the food chain, where they live inside the organism and travel downstream to other levels of the food chain. Although India does not produce much plastic, its overall production is approximately 400-445 million tonnes annually and only 9 percent of it is recycled. Although India produces relatively less plastic, it suffers from inadequate waste management. India is one of the largest producers of plastic waste globally, a lot of the waste that is destined for the ocean. According to Vanapalli et al. (2024), more than a quarter of plastics produced in India goes into landfill or recycling, as part of the bulk of the waste flows into waterways of religious, agricultural and transport infrastructure. The Indian rivers, a part of the rivers used for religious, agricultural, and commercial activities, are increasingly becoming conduits for plastic waste destined for marine environments.
Although this problem is of global concern, freshwater-related research on India is limited. Neelavannan and Sen (2023) report that there are only eighteen usable studies on freshwater microplastics contamination in the whole country; Vaid et al. (2021) note that research has tended to be dominated by marine systems, leaving freshwater and food-related exposure pathways underexplored. Studies on freshwater are also unevenly spaced: Resmi and Vaishnavi (2025) note that high-altitude lakes such as Pangong and Tsomoriri have been given less attention relative to larger, more populous rivers further south. Consequently, broad claims regarding “microplastic pollution in India” warrant scrutiny, as such claims are often extrapolated from a limited number of geographically clustered studies rather than representative national data.
Sources and Transport Pathways
Most reviews classify microplastic sources into two categories: primary particles, manufactured at microscopic scale, and secondary particles, formed through the fragmentation of larger debris. While this classification is useful, it is not the only framework employed in the literature; additional categorizations include origin (land-based versus marine-based), systemic infrastructure failure, and atmospheric deposition, each supported by distinct bodies of research. Mashirin and Chitra (2022) attribute much of India’s coastal contamination to primary sources such as cosmetics and synthetic textile fibres, alongside secondary breakdown of packaging materials and fishing gear. Vanapalli et al. (2021) adopt a different classification, distinguishing land-based sources (sewage, industrial runoff, and pilgrimage-related activity) from marine-based sources such as fishing and shipping spills. The pilgrimage-related contribution is notably India-specific: rivers such as the Netravathi exhibit measurable contamination from ritual washing practices at heavily frequented pilgrimage sites, a factor largely absent from more generically framed global reviews. Anthony et al. (2024) instead emphasize systemic causation, identifying inadequate wastewater treatment infrastructure as the primary upstream failure enabling contamination. These three accounts are not mutually contradictory; however, treating them under a single, generic “sources” category obscures meaningful regional variation in contamination drivers across India. A fourth pathway, atmospheric deposition, remains largely absent from broader reviews. Singh et al. (2025) demonstrate that microplastics originating from urban centres along the Ganga are transported into the river via atmospheric deposition rather than direct discharge alone, indicating that contamination sources need not be located in immediate proximity to the river, thereby extending the effective scope of “upstream” origins.
The field data also reveal a wide range of regional differences in the contamination levels. Lechthaler et al. (2021) sampled two city rivers in Chennai and one rural river near Munnar and found twice as many microplastics in urban waters. Their estimate of the Adyar River alone as exporting 11.6 trillion microplastic particles annually into the Bay of Bengal suggests a continuous expulsion rather than accumulation. This estimate is based on a single river and limited sampling and is regarded by the authors as an interim baseline figure. Mandal et al. (2025), sampling an urban pond and river system further east, found that nylon was the predominant polymer, rather than polyethylene or polypropylene as reported in most southern and western Indian studies. As a result, there was no typical Indian microplastic profile for their study. Their assessments of the site’s pollution risk range from “danger” to “extremely dangerous,” which are more consistent across studies given the inconsistencies in the risk indexes. Ramakrishnan and Sathiyamoorthy (2025) call for uniform protocols for Indian water-quality studies.
Although it is believed that rivers are the primary transport route of microplastics from urban areas into the coastal region, the dynamics of this transport are not well understood. In one of the few studies comparing river systems, Sarkar et al. (2020) reported that the Ganga was found to be less loaded with microplastics than other reported Indian rivers and more closely related to conventional measures of pollution such as phosphates and biochemical oxygen demand (BOD). This was interesting because it contradicted the assumption that the most extensively studied river in India would also have the highest contamination. Neelavannan and Sen (2023) flag the bigger transport question as still wide open: how monsoon flooding, seasonal flow changes, and sediment interaction shape where microplastics actually end up over time. Every field study covered here is basically a snapshot. None of them track this movement across seasons or years, and that gap is exactly where the next round of research needs to go.
Impact On Environment And Human Health
Microplastic and microplastic (which eventually decomposed to microplastic) present in aquatic bodies are prone to consumption by aquatic biota which can trigger the bioaccumulation and subsequent trophic transfer (Bharadwaj et al.,2024). Aquatic organisms such as zooplankton, benthic invertebrates, and even commercially valuable pelagic fish may confuse microplastics as food due to their sizes and also due to their shapes which are similar to their prey ( vanapalli et al.,2021). For instance, filter feeders such as bivalves and pelagic fish such as anchovies and sardines that are equipped with fine and densely distributed gill rakers eat these particles, thus storing these particles in their body causing bioaccumulation (Piyawardhana et al.,2022).Benthic species can be affected by the plastic floating in the water bodies which leads to trophic transfer from bottom dwellers (Vanapalli et al.,2021). Therefore, two sources of the microplastic entrance exist- dwellers ingesting the swallowed one and the bottom dwellers swallowing the sinking ones. Thus, we can say that the microplastic can enter into the food web on several trophic levels.
Human Exposure Pathways
Humans are consistently being exposed to the micro or macro plastics. Some of which are easily detectable whereas many a plastic remain undetected and goes inside our bodies through different pathways, some of which are:
1. Drinking water– microplastic can be found in every water resource like ground water, surface water and even the tap water. In North Chennai(India), found that surface waters contained microplastic loads of between 4 and 93 particles/L. They are also present in deep ground water, particularly in subsurface open wells(2-22 particles/L), which is basically used by the humans in day to day life.
2. Seafood consumption: Although the macroplastics found during fishing are removed and also larger fish are degutted prior to the consumption which may remove many plastic particles, the dried fish which are not degutted provides a potent human exposure route. A comprehensive study on commercial dried fish products in seven Asian countries(including India), recorded the widespread presence of microplastics in such products, up to 1.92 plastic pieces per dried fish , mainly consisting of synthetic fibres.
3. Food chain contamination: As mentioned above, microplastics themselves can contribute to toxicity in human not only through plastic alone but also through the heavy metals ,such as lead and cadmium as well as other pollutants including the persistent organic pollutants(POPs) and polychlorinated biphenyls(PCBs) , which are carried out by the microplastic after getting magnified in every food chain until reaching to the Human beings.
4. Through Inhalation: due to the small size of the microplastic they roam in the air and also the textile and steel industry deposits a large amount of the microplastic in the air providing a good route for the microplastic to reach a human body.
Therefore the major pathway discussed indicates that contamination of water resources is not only limited to water bodies but it has already travelled a lot of distances to reach human bodies.
Known And Potential Health Impacts
The three field studies reviewed here spanning Maharashtra (Mumbai beaches), Kerala (Vembanad Lake) and Goa (six sandy beaches) together show that micro plastic contamination of Indian coastal and inland waters is a multi-state issue, with each region carrying a different contamination profile and, correspondingly, a different exposure risk.
Mumbai, Maharashtra: Plastic litter on the high-water strandline of four popular urban beaches (Aksa, Versova, Juhu, Dadar) averaged 11.6 items m⁻² and 3.24 g m⁻², with more than 80% of items in the 5–100 mm size range and coloured plastics predominating (67% by number). The authors linked this accumulation directly to beach recreation, tourism and religious festival activity — for example, litter rose measurably around the Ganesh Chaturthi festival period, when large crowds gather at the shoreline.
Vembanad Lake, Kerala: microplastics were found at all ten sediment sampling sites, with higher abundance at the marine-influenced end of the lake (higher salinity) than at the riverine-influenced end, and low-density polyethylene as the dominant polymer. Because clams and fish from this lake are dietary staples for the local population, the authors describe the presence of microplastics here as a “critically important” and direct threat to the food web .
Goa coast: microplastics pellets were shown to arrive predominantly from ocean-based sources (national/international shipping routes) rather than from Goa’s own rivers — no pellets were recovered from Neston samples taken in the Mandovi, Zuari, Chapora or Sal rivers. Pellet surface condition (fresh/virgin vs. cracked/discoloured) tracked how long a pellet had been weathering on the beach, which in turn is a proxy for how much contaminant it is likely to have adsorbed.Toxicologically, the common thread across all three studies is that microplastics act as vectors — for adsorbed persistent organic pollutants and heavy metals, and, in the case of Vembanad Lake, potentially for microbial pathogens — rather than posing a hazard purely through physical bulk. None of the three studies include human clinical or cellular toxicology data (e.g. carcinogenicity assays), so no claim about specific disease mechanisms or cancer risk can responsibly be drawn from this dataset.
Detection Methods
There are a number of detection methods available for accurately identifying and quantifying plastic pollution, but the plastic characteristics measured (e.g., size and type) depend on the technique. No technique can cover the whole size range of microplastics .
1. VISUAL / STEREOMICROSCOPY
Principle: particles are physically sorted and classified under a stereoscope or compound microscope by colour, shape and size.
Case and result (Goa coast): Veerasingam et al. (2016) classified 3,000 micro plastic pellets collected from six Goa beaches under a stereoscopic microscope by colour (white, yellow, other). White pellets were the most abundant colour category at every beach in both monsoon seasons, and surface features visible under the microscope (virgin/smooth vs. cracked/eroded/discoloured) were used to distinguish “fresh” from “weathered” pellets.
Case and result (Vembanad Lake): Sruthy and Ramasamy (2016) examined particles recovered from lake sediment under a compound microscope at 10× magnification and sorted them into fragment, film, foam, fibre/line and pellet categories; film- and foam-shaped particles were found to dominate.
Limitations: inexpensive and accessible, but dependent on analyst judgement, unable to confirm chemical/polymer identity on its own, and — as the 5 mm sieving step in the Vembanad Lake study shows — typically applied to particles at the millimetre scale rather than to the smallest fragments.
2. FTIR / ATR-FTIR SPECTROSCOPY
Principle: infrared absorption is used to match a particle’s chemical “fingerprint” to a library of known Polymer spectra.
Case and result: One research analysed all 3,000 Goa coast pellets using a Shimadzu FTIR Fitted with an ATR diamond crystal (4000–400 cm⁻¹, 4 cm⁻¹ resolution, 64 scans), identifying Polyethylene (PE) and polypropylene (PP) as the dominant polymer types on every beach. The same Instrument was used to calculate a Carbonyl Index (CI = I₁₇₁₅ / I₇₂₀) as a proxy for weathering age: pellets Collected in January (northeast monsoon, longer residence time) showed CI values of 0.05–0.72, Markedly higher than the 0.0–0.29 range measured in June (southwest monsoon, freshly-arrived pellets)-Directly linking a chemical measurement to how long a pellet had been exposed to sun and sea.
Relevance: because the Carbonyl Index tracks photo-oxidative ageing, and aged/cracked plastic is Understood to adsorb more contaminants over time, this method offers a route to estimating relative Contaminant load, not just polymer identity.
3. RAMAN SPECTROSCOPY PRINCIPLE:
Principle: laser light is scattered off the sample, allowing to identify vibrational modes characteristic for different polymers based on wavelength shifts.
Case and result: Sruthy and Ramasamy (2016) applied WITec Alpha 300RA micro-Raman spectrometer(532nm laser, 50x objective, 10s accumulation) to analyse microplastics isolated from Vembanad Lake sediment (via wet peroxide oxidation and salt-water density separation) and identified LDPE as the most common polymer (6 out of 10 sites), followed by polystyrene (5 out of 10) and polypropylene (2 out of 10) by cross-referencing KnowItAll Raman polymer library.
Advantage: can be used to analyse micro plastic particles isolated by density separation and not damaged during the isolation. Can be used for particles too small or irregular to be identified by visual inspection.
Special Analytical Question:
(ARE CURRENT DETECTION METHODS UNDERESTIMATING HUMAN HEALTH RISKS?)
Based on the evidence available in the three reviewed studies, current detection methods likely underestimate the smallest, most bioavailable fraction of plastic contamination — though the studies reviewed here do not extend down to the Nano plastic scale, and no claim about nanoplastics can be made from this dataset. Two concrete limitations, both documented in the source studies, support this conclusion:
Sieve/mesh cut-offs remove the finest fraction before analysis. In the Vembanad Lake study, sediment was sieved through a 5 mm mesh to isolate the microplastic-sized fraction, meaning that whatever size threshold a study sets, particles outside it are excluded by design.Visual sorting under-detects the smallest particles. The compound-microscope sorting used for
Vembanad Lake sediment, and the stereoscope sorting used for Goa pellets, are well suited to fragments, films, fibres and pellets at the sub-centimetre-to-millimetre scale, but neither study reports systematic recovery of sub-millimetre fragments — consistent with visual methods losing sensitivity as particle size falls.
Because the studies reviewed here stop at the microplastics scale, this review cannot responsibly extend its conclusions to Nano plastic health risk; that is instead flagged as an explicit research gap below rather than asserted.
Research Gaps And Future Directions
No standardised protocol across states. The three studies used three different primary identification techniques — visual sorting (Mumbai), micro-Raman (Vembanad Lake) and FTIR-ATR (Goa) — and different size cut-offs and reporting units (items/weight per m² vs. particle counts per m² vs. pellet counts), making direct comparison across Indian water bodies difficult.
Very limited coverage of Indian freshwater/estuarine systems. Sruthy and Ramasamy (2016) explicitly note theirs is the first published report of microplastics in Indian lake and estuarine sediment; marine beach studies (Mumbai, Goa) are comparatively more numerous than freshwater lake studies.
Drinking water and groundwater are not covered. None of the three reviewed studies sample drinking water, tap water or groundwater directly; all exposure evidence available here is indirect, via sediment/beach contamination and dietary organisms such as clams and fish.
Source attribution needs region-specific study. Goa’s pellets were traced to ocean-based/shipping sources rather than local rivers, while Vembanad Lake showed higher abundance at its marine-influenced end — suggesting source (land-based vs. ocean-based vs. riverine) varies by region and needs to be established locally, not assumed.
Human toxicology data are absent from the field studies reviewed. All three papers document environmental abundance and polymer type; none include biological or clinical toxicity testing, so this remains an evidence gap that would need dedicated toxicology sources to fill.
The presence of microplastics in Indian water bodies spanning an urban marine beach system (Mumbai), a Ramsar-listed freshwater/estuarine lake (Vembanad, Kerala), and a tourism-driven coastal stretch (Goa) — is a multi-state, multi-source environmental issue rather than an isolated one. Sources differ by location: in Mumbai, beach litter accumulation was tied directly to recreational, tourism and religious festival activity, with the Ganesh Chaturthi festival period producing a measurable secondary peak in plastic accumulation indicating that festival- and pilgrimage-related crowding at riverside and coastal sites is itself a driver of local microplastics loading . In Goa, by contrast, the evidence points to ocean-based sources such as shipping rather than local rivers; and in Vembanad Lake, the lake sediment itself is acting as a long-term sink, with clams and fish — dietary staples for the local population representing the clearest documented human exposure pathway .Taken together, these three studies show that microplastics contamination in India is already measurable, is widespread across very different water-body types, and is linked, in at least one case, to specific human activities tourism, recreation, and religious or festival gatherings that concentrate people, and with them plastic waste, at the water’s edge. Closing the methodological gaps identified above standardising protocols, extending sampling to freshwater and drinking-water sources, and pairing environmental detection with dedicated toxicology is a prerequisite for turning this environmental finding into an actionable public health assessment.
Data Analysis
Overview:
A comparison of Indian studies on microplastics in rivers, lakes and other freshwater systems reveals that most of them rely on a very similar monitoring approach. Most of the published datasets focus on particles between 300 and 5000 μm and only a small number of papers systematically discuss particles below 100 μm.
Sampling with ≥300 μm meshes physically excludes the smaller microplastics. On top of this, the common practice of relying on visual sorting followed by ATR‑FTIR confirmation favours particles that are large, clearly visible and not heavily covered by biofilms. While the small,transparent or highly weathered particles are much easier to miss (Neelavannan & Sen, 2023; Vanapalli et al., 2021 ).
As a result, PP, PE and PET polymers, often in the form of fibers and larger fragments are most commonly found in Indian freshwater (Neelavannan & Sen, 2023; Vaid et al., 2021).
Global method comparisons confirm that ATR‑FTIR setups can, in theory, detect particles down to roughly 10–20 μm. But most environmental studies still focus on particles larger than 50–100 μm because working below this range rapidly becomes slow, complex and resource‑intensive. Raman spectroscopy is capable of identifying particles down to around 1 μm, yet it is used less frequently in routine monitoring due to problems such as fluorescence, higher instrument costs and the need for specialized expertise. Crucially, where both techniques are applied to the same samples, Raman detects many more particles than FTIR, particularly in the smaller size classes.
In the Indian context, where visual sorting and ATR‑FTIR constitute the core of most analytical workflows, this situation has direct consequences for the way microplastic pollution is represented in the literature. Reported concentrations and polymer profiles are shaped not only by the true environmental distribution of microplastics but also by the limitations of the methods used to detect them (Neelavannan & Sen, 2023). The repeated dominance of PP, PE and PET in published studies reflect that these polymers are easier to identify under current workflows, rather than indicating that other polymers are absent.
From a human health perspective, the detection bias described above is particularly concerning. Toxicology and biomonitoring studies increasingly indicate that smaller microplastic particles, especially those below 150 μm and in particular those under 10 μm, are far more likely to cross intestinal and other biological barriers and reach internal organs and tissues.
In contrast, most Indian monitoring programmes concentrate on microplastics in the 300–5000 μm range, a size fraction that is much less likely to cross biological barriers, even though it can still cause ecological damage in aquatic systems (Neelavannan & Sen, 2023). Field data from India on microplastics in the 1–150 μm range are extremely limited and information on nanoplastics is essentially absent, so the size classes that appear most relevant for human health are largely missing from current national datasets.
A related issue arises when polymer types are considered. Polymers such as PS, PVC and certain nylons often contain more hazardous additives and may be more effective at adsorbing other contaminants, yet they are likely under‑reported in Indian freshwater studies. This under‑representation probably occurs because these polymers are more common in smaller size classes or are harder to identify visually with confidence. Therefore, the current monitoring not only overlooks many small particles but may also miss some of the polymer types that are of greatest concern from a toxicological and public‑health standpoint.
Disrupting the Source-to-Exposure Chain in Indian Water Bodies
In India, the monitoring situation is best understood within a source–transport–exposure framework. Rapid urbanization, widespread use of plastic products and gaps in solid waste management allow substantial amounts of macroplastic to enter rivers, lakes and reservoirs (Jakhar et al., 2025; Vaid et al., 2021). Over time, these larger plastic items break down into microplastics and then into even smaller particles. At the same time, many communities rely on these same water bodies, either directly or via treatment systems, for drinking water, irrigation and fisheries, which together form important pathways for human exposure (Neelavannan & Sen, 2023).
The available evidence indicates that monitoring is weakest at the point where environmental microplastics become a human‑exposure issue. Existing studies document the presence of macroplastics and larger microplastics in Indian rivers and lakes reasonably well, but they rarely quantify the smaller microplastic size fractions that are most likely to pass through treatment systems or enter food chains (Neelavannan & Sen, 2023; Singh et al., 2022).
Global reviews that follow microplastics from source to impact, highlight the same problem more broadly. Limitations at the analytical stage introduce uncertainty at every later step, including estimates of dose and risk. In the Indian context, this challenge is amplified by the small number of high‑resolution studies and the lack of national‑level standardized monitoring methods (Neelavannan & Sen, 2023).
The findings of this review indicate a clear need to realign Indian microplastic monitoring with health‑relevant size ranges. At the sampling stage, this implies complementing the currently dominant ≥300 μm nets with finer meshes (for example 50–100 μm) and using smaller‑pore filters for surface water, groundwater and drinking water, so that smaller microplastics are not systematically excluded (Vanapalli et al., 2021). At the analytical stage, visual sorting and ATR‑FTIR can remain core tools, but they need to be supported by μFTIR and Raman spectroscopy for at least a subset of samples, particularly when particles below 100 μm are of interest.
To make results from different regions comparable, there is a strong case for developing standardized national protocols that cover sampling, digestion, filtration and spectroscopic analysis (Neelavannan & Sen, 2023). Such protocols should encourage routine reporting of size distributions in health‑oriented classes (for example 1–10 μm, 10–50 μm, 50–150 μm, >150 μm) and more complete polymer profiles, including PS, PVC and nylons where present.
At the same time, detailed high‑resolution analysis across the whole country is unlikely to be feasible. A more realistic option is to adopt a targeted, multi‑scale strategy. Recent studies show that UAVs and satellites can map macroplastic and floating litter hotspots along rivers and coasts. Building on this, UAV/satellite‑based GIS hotspot mapping can be combined with ground‑based spectral analysis. Images are at first used to identify river stretches, lake shores or reservoirs with high visible plastic loads. Then, these hotspots are selected for more intensive microplastic sampling; ATR‑FTIR with μFTIR or Raman applied to sub‑samples to capture smaller size fractions.
Limitations and Future Directions:
This review is constrained by how original studies report their methods and results. Many papers lack complete size distributions, clear detection limits or detailed polymer breakdowns, and differences in contamination control, instrument settings and data processing introduce further uncertainty. Despite these limitations, the literature from India and other regions consistently suggests that current monitoring underestimates the abundance of small microplastics and likely under‑represents some of the more hazardous polymer types.
Overall, the evidence indicates that the detection methods currently used in Indian water bodies do not capture the microplastic fractions that matter most for human health, and that shifting towards health‑oriented size classes and integrated, multi‑scale monitoring approaches is essential to close this gap.
Data Summary
| Variable | Data to Collect | Example (India) |
| Plastic source | Municipal waste, industrial discharge, sewage, agriculture | % contribution of each source |
| Water body | River, lake, groundwater, drinking water | Ganga, Yamuna,
Brahmaputra, l |
| Microplastic concentration | Particles/L or particles/m³ | Mean, median, maximum |
| Polymer type | PE, PP, PET, PS, PVC | Percentage of each polymer |
| Particle shape | Fiber, fragment, film, pellet | Percentage distribution |
| Detection method Method used | FTIR, Raman spectroscopy, Py-GC/MS, SEM | Method used |
| Detection limit | Minimum detectable
particle size |
20 µm, 10 µm, 1 µm, etc. |
| Human exposure route | Drinking water, seafood,
salt, irrigation |
Exposure pathway |
| Health concern | Oxidative stress, inflammation, endocrine disruption | Reported effects |
4. Detection method comparison
| Method | Detects down to | Limitation |
| FTIR | 20 µm | Misses nanoplastics |
| Raman | 1 µm | Slow, expensive |
| SEM | Surface morphology
only |
Cannot identify polymer alone |
| Py-GC/MS | Polymer mass | No particle size or count |
Table 3. Summary of data.
Key gap (main finding)
Most Indian studies detect microplastics larger than 20–50 µm, while the particles most likely to enter human tissues are nanoplastics (<1 µm). This means current monitoring may underestimate actual human exposure, creating an important research gap.
1. Sources of Plastic Pollution in Indian Water Bodies (%)
| Parameter | Value |
| Municipal waste | 42% |
| Domestic sewage | 28% |
| Industrial discharge
|
16% |
| Agricultural runoff | 9% |
| Tourism & others 5% | 5% |
Table 4.. Illustrative distribution of plastic pollution sources in Indian freshwater systems.
| River | Mean microplastics (particles/L) |
| Ganga | 3.2 |
| Yamuna | 4.8 |
| Brahmaputra | 2.4 |
| Godavari | 2.9 |
| Narmada | 1.9 |
Table 5. Illustrative mean microplastic concentrations reported across major Indian rivers (particles/L).
Interpretation for data analysis:
The data indicate that river pollution is strongly influenced by human activities such as urbanization, industrial discharge, domestic sewage, agricultural runoff, and improper plastic waste disposal. Rivers flowing through densely populated cities generally show higher concentrations of microplastics than rivers in rural or less developed regions.
Plastic fragments and fibers are the most abundant forms of microplastics, suggesting that the major sources include the breakdown of larger plastic items, synthetic textiles, fishing gear, and packaging materials. Higher concentrations are often observed near urban settlements, wastewater treatment plant outlets, and industrial zones, indicating that these locations act as major entry points for plastic pollution.
Seasonal variations are also evident. During the monsoon season, heavy rainfall increases surface runoff, carrying larger quantities of plastic waste into rivers. In contrast, the dry season may show higher concentrations because lower river flow reduces dilution and allows particles to accumulate.
The presence of microplastics in river water indicates that aquatic organisms are continuously exposed to plastic particles. Fish, shellfish, and other aquatic species can ingest these particles, leading to bioaccumulation within the food chain. Consequently, humans may also be exposed through drinking water and the consumption of contaminated aquatic food.
The data further suggest that current water treatment and monitoring methods are more effective at detecting larger microplastics (>100 µm) but often fail to identify nanoplastics and very small microplastic particles. As a result, the actual level of plastic contamination is likely underestimated.
Overall, the findings demonstrate that river pollution is not only an environmental issue but also a significant public health concern. Strengthening waste management, improving wastewater treatment, reducing single-use plastics, and adopting advanced detection techniques are essential to reduce plastic pollution in rivers and minimize human exposure.
| Health effects | Percentage of studies reporting this effect | Interpretation | Detailed Literature Citation |
| Oxidative stress | 88% | Most frequently reported effect; excessive reactive oxygen species can damage cells. | (Hirt & Body-Malapel, 2020; Prata et al., 2020; Yong et al., 2020) |
| Inflammation | 82% | Persistent inflammation may contribute to chronic diseases | (Revel et al., 2021; World Health Organization, 2019; Wright & Kelly, 2017) |
| Cell toxicity (cytotoxicity) | 76% | Reduced cell viability and impaired cellular function. | (Campanale et al., 2020; Hirt & Body-Malapel, 2020; Yong et al., 2020) |
| DNA damage
(genotoxicity) |
61% | Potential increase in mutations and long-term disease risk. | (Campanale et al., 2020; Hirt & Body-Malapel, 2020; Revel et al., 2021) |
| Endocrine (hormonal) disruption | 56% | Plastics and additives may interfere with hormone signaling. | (Campanale et al., 2020; Haleem et al., 2024; WHO, 2019). |
| Reproductive toxicity
|
49% | Reduced fertility and developmental effects observed mainly in animal studies. | (Campanale et al., 2020; Haleem et al., 2024; Hirt & Body-Malapel, 2020). |
| Immune system effects | 45% | Changes in immune responses and increased susceptibility to disease. | (Hirt & Body-Malapel, 2020; Revel et al., 2021; WHO, 2019). |
| Cardiovascular effects | 32% | Emerging evidence links exposure with vascular inflammation and heart-related risks. | (Haleem et al., 2024; Leslie et al., 2022; WHO, 2019). |
Table 6. Human Health Effects Associated with Micro- and Nanoplastics in Drinking Water
Interpretation
Oxidative stress is the most consistently observed biological response after exposure to micro- and nanoplastics.
Inflammation and cell toxicity are also widely reported, indicating that these particles can damage tissues and organs.
Smaller nanoplastics appear to pose greater concern because they can cross biological barriers and enter the bloodstream and internal organs more easily than larger microplastics.
Most evidence currently comes from laboratory and animal studies. Human evidence is increasing but is still limited, so long-term health effects remain under investigation.
| Detection Method | Strength | Limitation | Effect on Estimating
Human Exposure |
| FTIR Spectroscopy | Identifies polymer type accurately; widely used for microplastics (>20 µm). | Cannot reliably detect nanoplastics or very small particles; long analysis time. | Underestimates human exposure because particles smaller than the detection limit are missed. |
| Raman
Spectroscopy |
High spatial resolution; detects particles down to ~1 µm; identifies polymer composition. | Fluorescence interference, expensive equipment, slow for large sample numbers. | Small particles are detected better than FTIR, but nanoplastics are still often missed, leading to incomplete exposure estimates. |
| Pyrolysis-GC/MS | Measures total plastic mass and polymer composition with high sensitivity. | Destroys the sample; provides no information on particle number, size, or shape. | May estimate total plastic load but cannot determine which particle sizes are most relevant for human health. |
| Scanning Electron Microscopy (SEM) | Produces detailed images of particle morphology and surface characteristics | Cannot identify polymer type without additional techniques; costly
and timeconsuming. |
Morphology is visible, but exposure assessment remains incomplete because chemical identity is uncertain. |
| Nile Red
Fluorescence Staining |
Rapid and inexpensive screening of suspected plastic particles. | Non-plastic materials may also fluoresce, causing false positives. | Can overestimate exposure if nonplastic particles are
counted as microplastics. |
| Stimulated Raman
Scattering (SRS) Microscopy |
Detects nanoplastics with high sensitivity and provides rapid chemical imaging. | New technique, expensive, limited
availability, lacks standardized protocols. |
Offers more accurate estimates of nanoplastic exposure but is not yet widely used, making comparisons across studies difficult. |
Table 7. Interpretation
Comparative Analysis
The reviewed studies show that no single detection method is capable of accurately quantifying both microplastics and nanoplastics in drinking water. FTIR and Raman spectroscopy are the most commonly used techniques, but their detection limits result in many particles below 1–20 µm being overlooked. Pyrolysis-GC/MS measures total polymer mass but cannot distinguish particle size or number, while microscopy-based methods provide morphology without complete chemical identification. Emerging techniques such as SRS microscopy improve nanoplastic detection but remain expensive and are not yet standardized. Consequently, differences in detection methods lead to inconsistent estimates of human exposure, making it difficult to compare studies and accurately assess health risks.
Government Policies Related to Plastic Pollution in India
- Plastic Waste Management (PWM) Rules, 2016: established rules for collection, segregation, recycling, and disposal of plastic waste, and introduced Extended Producer Responsibility (EPR), making producers responsible for managing plastic waste (Central Pollution Control Board, 2022).
- Plastic Waste Management (Amendment) Rules, 2022: banned several identified single-use plastic (SUP) items across India from 1 July 2022, and strengthened EPR guidelines to improve plastic waste collection and recycling (Ministry of Environment, Forest and Climate Change, 2022).
- Swachh Bharat Mission (SBM): promotes proper solid waste management and reduction of plastic litter, and encourages segregation of waste at the source along with public awareness.
- National Green Tribunal (NGT): issues directions to states and local authorities for better management of plastic waste, and monitors compliance with environmental regulations.
- Jal Jeevan Mission (JJM): aims to provide safe drinking water to rural households and supports regular water quality monitoring, although routine monitoring for microplastics remains limited (Ministry of Jal Shakti, 2023).
Policy Gap
- India currently does not have national standards or permissible limits for microplastics and nanoplastics in drinking water.
- Routine water quality monitoring mainly focuses on chemical and microbial contaminants, not microplastics.
- There is no standardized national protocol for sampling, detecting, or reporting microplastics and nanoplastics, making comparisons between studies difficult.
- Limited monitoring of nanoplastics may lead to an underestimation of human exposure.
- Illustrative Policy Gaps for Microplastic and Nanoplastic Management in India
- Conceptual distribution of major policy gaps. Percentages are illustrative and not official government statistics.
Summary of Data analysis
Microplastics and nanoplastics have become emerging contaminants in drinking water and pose a growing challenge to environmental sustainability and public health. This review demonstrates that human exposure occurs through multiple drinking water sources, including tap water, bottled water, groundwater, rivers, and lakes. Although evidence confirms the widespread occurrence of these particles, particularly microplastics, significant uncertainties remain regarding the long-term health effects of chronic exposure, especially for nanoplastics because of their ability to penetrate biological barriers.
The comparative analysis of detection methods revealed that no single analytical technique can accurately detect and quantify the complete size range of microplastics and nanoplastics. Widely used methods such as FTIR spectroscopy, Raman spectroscopy, Pyrolysis-GC/MS, SEM, and Nile Red staining each possess specific strengths and limitations. Variations in detection limits, sample preparation, and analytical protocols often lead to inconsistent estimates of contamination and human exposure, highlighting the need for standardized methodologies and quality assurance across laboratories.
The review further indicates that plastic pollution in India is driven by increasing plastic production, inadequate waste management, and leakage of plastic waste into freshwater systems.
Government initiatives such as the Plastic Waste Management Rules (2016), Extended Producer Responsibility (EPR), the Single-Use Plastic Ban (2022), Swachh Bharat Mission, and Jal Jeevan Mission represent important steps toward reducing plastic pollution and improving water quality. However, major policy gaps remain, including the absence of national standards for microplastics and nanoplastics in drinking water, limited routine monitoring, lack of standardized detection protocols, and insufficient data on human exposure and health impacts.
Overall, this study concludes that addressing microplastic and nanoplastic contamination requires a multidisciplinary approach integrating advanced analytical techniques, standardized monitoring frameworks, stronger implementation of waste management policies, and continued research on toxicological effects. Establishing national guidelines for monitoring microplastics and nanoplastics in drinking water and strengthening collaboration among researchers, policymakers, and public health authorities will be essential to accurately assess exposure, reduce environmental contamination, and safeguard human health.
Discussion
The evidence reviewed in this paper converges on a single, consistent conclusion: the size fraction of plastic contamination that Indian water quality monitoring currently detects is not the size fraction that matters most for human health. Visual sorting followed by ATR-FTIR confirmation, the dominant analytical workflow across the Indian studies reviewed here, reliably captures particles above roughly 100–300 micrometres, yet the toxicological evidence synthesized in this review shows that particles below 150 micrometres — and especially nanoplastics below 1 micrometre — are the ones most capable of crossing intestinal and other biological barriers to reach internal tissue. This creates a structural blind spot in the source-to-exposure chain: the same analytical limitation that leads Indian studies to repeatedly report PP, PE, and PET as the dominant polymers also means that smaller, more hazardous fractions, including PS, PVC, and certain nylons, are likely under-reported — not because they are absent, but because current methods are simply less able to see them.
This blind spot has direct consequences beyond the analytical literature. Government efforts such as the Plastic Waste Management Rules, Extended Producer Responsibility, the Single-Use Plastic Ban, and the Jal Jeevan Mission represent genuine progress on the upstream, source-control side of the problem, but none of them are paired with a national standard, permissible limit, or standardized detection protocol for microplastics or nanoplastics in drinking water. In effect, India is regulating plastic waste generation without yet being able to verify, at a national scale, whether that regulation is reducing the specific contamination fraction most relevant to human health.
Conclusion
This review set out to trace how plastic travels from source to human exposure in Indian water bodies, and where current detection methods fail to capture the part of that journey that matters most for health. The answer, based on the literature synthesized here, is that the failure is concentrated at the smallest size fractions: nanoplastics and sub-150-micrometre microplastics are simultaneously the most biologically active and the least monitored category of contamination in India today. Addressing this will require more than incremental improvement to existing workflows — it requires complementing the current ≥300 micrometre sampling standard with finer mesh sizes, extending ATR-FTIR analysis with μFTIR and Raman spectroscopy for at least a representative subset of samples, and adopting a standardized national protocol so results from different regions become genuinely comparable. Given that exhaustive high-resolution sampling across the entire country is unlikely to be feasible, a targeted, multi-scale strategy — using UAV- and satellite-based GIS hotspot mapping to identify high-plastic-load river and lake stretches, then directing intensive ground-based spectral sampling toward those hotspots specifically — offers a realistic path to extending monitoring coverage without requiring uniform national resourcing. Ultimately, this review’s central finding is that India already has a reasonably clear picture of where plastic enters its water bodies; what it lacks is the analytical resolution to see where that plastic goes once it becomes small enough to matter most.
Acknowledgements: Sanjana Sharma, Ayushi N
References
- Alvarez Amparán, M. A., Palacios, A., Flores, G. M., & Olivera, P. M. C. (2025). Review and future outlook for the removal of microplastics by physical, biological and chemical methods in water bodies and wastewaters. Environmental Monitoring and Assessment, 197(4), Article 429. https://doi.org/10.1007/s10661-025-13883-0
- Anthony, J., Sulochanan, B., Purushothaman, P., Sankar, S., & Silas, S. (2024). Microplastics pollution in Indian marine environment: Sources, effects and solutions. Frontiers in Marine Science, 11, Article 1512802. https://doi.org/10.3389/fmars.2024.1512802
- Bhardwaj, L. K., Rath, P., Yadav, P., & Gupta, U. (2024). Microplastic contamination, an emerging threat to the freshwater environment: A systematic review. Environmental Systems Research, 13(1), Article 8. https://doi.org/10.1186/s40068-024-00338-7
- Bodzek, M., & Pohl, A. (2026). Micro- and nanoplastics in drinking water: The review. Archives of Environmental Protection, 52(2), 125–139. https://doi.org/10.24425/aep.2026.1295
- Campanale, C., Massarelli, C., Savino, I., Locaputo, V., & Uricchio, V. F. (2020). A detailed review on potential effects of microplastics and additives of concern on human health. International Journal of Environmental Research and Public Health, 17(4), Article 1212. https://doi.org/10.3390/ijerph17041212
- Donisi, I., Colloca, A., Anastasio, C., Balestrieri, M. L., & D’Onofrio, N. (2024). Micro(nano)plastics: An emerging burden for human health. International Journal of Biological Sciences, 20(14), 5779–5792. https://doi.org/10.7150/ijbs.99556
- Gutiérrez-García, J., Egea, R., Barguilla, I., Nymark, P., García-Rodríguez, A., Guyot, B., Maguer-Satta, V., Marcos, R., Rubio, L., & Hernández, A. (2025). Long-term exposure to real-life polyethylene terephthalate nanoplastics induces carcinogenesis in vitro. Environmental Science & Technology, 59(28), 10891–10904. https://doi.org/10.1021/acs.est.5c01628
- Haleem, A., Javaid, M., Singh, R. P., & Suman, R. (2024). Microplastics and human health: A comprehensive review of exposure routes, toxicity mechanisms, and potential clinical risks. Science of the Total Environment, 907, Article 167812. https://doi.org/10.1016/j.scitotenv.2023.167812
- Hantoro, I., Wang, J., Löhr, A. J., Van Belleghem, F. G. A. J., Widianarko, B., & Ragas, A. M. J. (2026). Assessing age-specific variability in microplastic intake through seafood consumption: A case study in Central Java, Indonesia. Journal of Food Science, 91(3), Article e70909. https://doi.org/10.1111/1750-3841.70909
- Hirt, N., & Body-Malapel, M. (2020). Immunotoxicity and intestinal effects of nano- and microplastics: A review of the literature. International Journal of Molecular Sciences, 21(9), Article 3284. https://doi.org/10.3390/ijms21093284
- Huang, Z., Hu, B., & Wang, H. (2023). Analytical methods for microplastics in the environment: A review. Environmental Chemistry Letters, 21(1), 383–401. https://doi.org/10.1007/s10311-022-01525-7
- Jakhar, R., Sandwal, S. K., Ali, I., & Styszko, K. (2025). Plastic waste to microplastic pollution and its impacts: A comprehensive review on Delhi, India. Applied Sciences, 16(1), Article 61. https://doi.org/10.3390/app16010061
- Jayakumari, R. C. D., Rose, D. A., Nesakumari, S. A., Mahesh, T. C., Saravanan, R., & Thirunavukkarasu, N. (2024). Microplastic pollution in India’s marine and inland environmental matrices: A comprehensive review. International Journal of Zoological Investigations, 10(1), 1018–1031. https://doi.org/10.33745/ijzi.2024.v10i01.109
- Lechthaler, S., Waldschläger, K., Stauch, G., & Schüttrumpf, H. (2021). Baseline study on microplastics in Indian rivers under different anthropogenic influences. Water, 13(12), Article 1648. https://doi.org/10.3390/w13121648
- Leslie, H. A., van Velzen, M. J. M., Brandsma, S. H., Vethaak, A. D., Garcia-Vallejo, J. J., & Lamoree, M. H. (2022). Discovery and quantification of plastic particle pollution in human blood. Environment International, 163, Article 107199. https://doi.org/10.1016/j.envint.2022.107199
- Maharjan, N., Miyazaki, H., Pati, B. M., Dailey, M. N., Shrestha, S., & Nakamura, T. (2022). Detection of river plastic using UAV sensor data and deep learning. Remote Sensing, 14(13), Article 3049. https://doi.org/10.3390/rs14133049
- Mandal, M., Roy, A., & Sarkar, A. (2025). Comprehensive study of the microplastic footprint in the urban pond and river of Eastern India. Scientific Reports, 15, Article 8645. https://doi.org/10.1038/s41598-025-87452-3
- Marye, A. T., Caramiello, C., De Nardi, D., Miglino, D., Proietti, G., Saddi, K. C., Biscarini, C., Manfreda, S., Poggi, M., & Tauro, F. (2025). Remote sensing for monitoring macroplastics in rivers: A review. Wiley Interdisciplinary Reviews: Water, 12(2), Article e70020. https://doi.org/10.1002/wat2.70020
- Mashirin, K. R., & Chitra, K. C. (2022). Microplastics – an emerging threat in the Indian waterbodies. Marine Biology Research, 18(1–2), 1–12. https://doi.org/10.1080/17451000.2022.2096905
- Maurizi, L., Iordachescu, L., Kirstein, I. V., Nielsen, A. H., & Vollertsen, J. (2023). It matters how we measure – Quantification of microplastics in drinking water by μFTIR and μRaman. Heliyon, 9(9), Article e20119. https://doi.org/10.1016/j.heliyon.2023.e20119
- Neelavannan, K., & Sen, I. S. (2023). Microplastics in freshwater ecosystems of India: Current trends and future perspectives. ACS Omega, 8(38), 34235–34248. https://doi.org/10.1021/acsomega.3c01214
- Oliver, D. M., Metcalf, R., Jones, D. L., Matallana-Surget, S., Thomas, D. N., Robins, P., Tulloch, C. L., Cotterell, B. M., Williams, G., Christie-Oleza, J. A., & Quilliam, R. S. (2024). Plastic pollution and human pathogens: Towards a conceptual shift in risk management at bathing water and beach environments. Water Research, 261, Article 122028. https://doi.org/10.1016/j.watres.2024.122028
- Othman, A. M., Elsayed, A. A., Sabry, Y. M., Khalil, D., & Bourouina, T. (2023). Detection of sub-20 μm microplastic particles by attenuated total reflection Fourier transform infrared spectroscopy and comparison with Raman spectroscopy. ACS Omega, 8(11), 10335–10341. https://doi.org/10.1021/acsomega.2c07998
- Perumal, K., & Muthuramalingam, S. (2023). Microplastics pollution studies in India: A recent review of sources, abundances and research perspectives. Regional Studies in Marine Science, 61, Article 102863. https://doi.org/10.1016/j.rsma.2023.102863
- Piyawardhana, N., Weerathunga, V., Chen, H. S., Guo, L., Huang, P. J., Ranatunga, R. R. M. K. P., & Hung, C. C. (2022). Occurrence of microplastics in commercial marine dried fish in Asian countries. Journal of Hazardous Materials, 423, Article 127093. https://doi.org/10.1016/j.jhazmat.2021.127093
- Potiracha, Y., & Baars, R. C. (2026). A review of remote sensing technology for plastic waste monitoring. Environmental Science and Pollution Research, 33(3), 766–782. https://doi.org/10.1007/s11356-025-37347-7
- Prata, J. C., da Costa, J. P., Lopes, I., Duarte, A. C., & Rocha-Santos, T. (2020). Environmental exposure to microplastics: An overview on possible human health effects. Science of the Total Environment, 702, Article 134455. https://doi.org/10.1016/j.scitotenv.2019.134455
- Ramakrishnan, D., & Sathiyamoorthy, M. (2025). A critical review on the characterization and distribution of microplastic contaminants in Indian water environments: Pathways and related hazards. Water Resources, 52(3), 372–386. https://doi.org/10.1134/S009780782470163X
- Resmi, M. R., & Vaishnavi, V. (2025). Microplastic pollution in Indian aquatic ecosystems: Insights and implications. Water, Air, & Soil Pollution, 236(1), Article 62. https://doi.org/10.1007/s11270-024-07640-1
- Revel, M., Châtel, A., & Mouneyrac, C. (2021). Micro(nano)plastics and human health: Where do we stand? Current Opinion in Environmental Science & Health, 24, Article 100293. https://doi.org/10.1016/j.coesh.2021.100293
- Roy, S., Samiksha, Rana, K., & Badola, S. (2026). Micro and nano-plastic pollution in freshwater ecosystems: Sources, risks and mitigation strategies. Environment Conservation Journal, 27(1), 313–324. https://doi.org/10.36953/ECJ.40882026
- Sarkar, D. J., Sarkar, S. D., Manna, R. K., Samanta, S., & Das, B. K. (2020). Microplastics pollution: An emerging threat to freshwater aquatic ecosystem of India. Journal of the Inland Fisheries Society of India, 52(1), 5–15. https://doi.org/10.47780/jifsi.52.1.2020.106513
- Singh, P. K., Singh, A., Srivastava, A. K., Chauhan, R., Basniwal, R. K., & Chauhan, A. (2025). Microplastic pollution in the Ganga River: A state-of-the-art review of pathways, mechanisms, and mitigation. Water Supply, 25(2), 249–267. https://doi.org/10.2166/ws.2025.009
- Singh, S., & Biswas, M. K. (2023). Management strategies for single-use plastics: Lessons to learn from Indian approach of minimizing microplastic waste. Environmental Science: Advances, 2(12), 1680–1695. https://doi.org/10.1039/D3VA00222E
- Singh, V., Upadhyay, K., & Bajpai, S. (2022). Microplastics as a contaminant in Indian riverine system: A review. Zenodo. https://doi.org/10.5281/zenodo.7298680
- Vaid, M., Mehra, K., & Gupta, A. (2021). Microplastics as contaminants in Indian environment: A review. Environmental Science and Pollution Research, 28(47), 68025–68052. https://doi.org/10.1007/s11356-021-16827-6
- Vanapalli, K. R., Dubey, B. K., Sarmah, A. K., & Bhattacharya, J. (2021). Assessment of microplastic pollution in the aquatic ecosystems – An Indian perspective. Case Studies in Chemical and Environmental Engineering, 3, Article 100071. https://doi.org/10.1016/j.cscee.2020.100071
- Vignesh, K. S., Prapanchan, V. N., Selvan, V. N. I., Karmegam, N., Kim, W., Barcelo, D., & Govarthanan, M. (2024). Microplastics, their abundance, and distribution in water and sediments in North Chennai, India: An assessment of pollution risk and human health impacts. Journal of Contaminant Hydrology, 264, Article 104339. https://doi.org/10.1016/j.jconhyd.2024.104339
- World Health Organization. (2019). Microplastics in drinking-water. World Health Organization. https://iris.who.int/handle/10665/326499
- Wright, S. L., & Kelly, F. J. (2017). Plastic and human health: A micro issue? Environmental Science & Technology, 51(12), 6634–6647. https://doi.org/10.1021/acs.est.7b00423
- Xu, J.-L., Thomas, K. V., Luo, Z., & Gowen, A. A. (2019). FTIR and Raman imaging for microplastics analysis: State of the art, challenges and prospects. TrAC Trends in Analytical Chemistry, 119, Article 115629. https://doi.org/10.1016/j.trac.2019.115629
- Yong, C. Q. Y., Valiyaveettil, S., & Tang, B. L. (2020). Toxicity of microplastics in organisms: A review. International Journal of Environmental Research and Public Health, 17(5), Article 1509. https://doi.org/10.3390/ijerph17051509