Auhtors: Madhu S and Amshula Ravi
Abstract
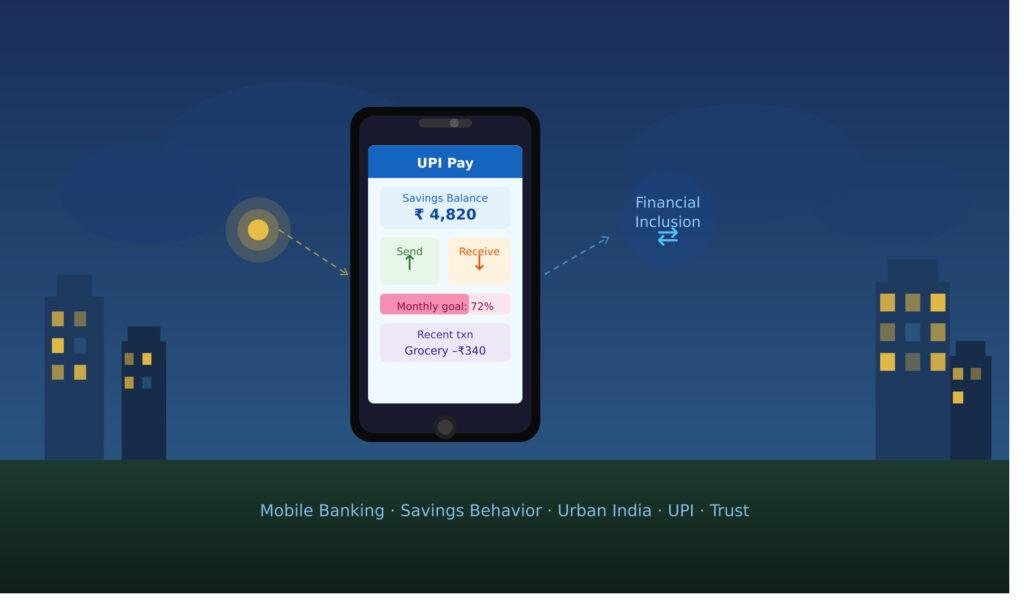
The rapid transformation in the Indian financial sector, driven by the Unified Payments Interface (UPI) and increasing smartphone penetration, has led to the adoption of mobile banking by low-income urban households. But how this access contributes to better financial behavior is poorly understood, especially among urban households with monthly incomes less than ₹20,000. This research explores the role of mobile banking in impacting savings frequency, quality of savings, and the behavioral factors that mediate effective digital savings among low-income urban households in Delhi, Chennai, Madurai, and Bengaluru.
Using a quantitative cross-sectional approach, the study gathered primary data from 134 valid responses via a questionnaire with 35 items. Chi-Square, One-Way ANOVA and Pearson Correlation tests were conducted to test three hypotheses. Findings reveal that although mobile banking does not influence the frequency of savings (χ² = 5.882, p = 0.208), it does show a positive effect on quality of savings behavior (users’ mean = 3.18, non-users’ mean = 2.60) with a suggestive but inconclusive One-Way ANOVA (F = 2.971, p = 0.087) (F = 2.971, p = 0.087). Among the behavioral barriers, only trust was found to be a statistically significant barrier (r = 0.188, p = 0.033), with fear of fraud and poor experiences with past banking transactions identified as the key psychological barriers in using digital savings.
These findings suggest that expanding platform access alone is insufficient to transform savings behavior. Incentives for policy need to focus on increasing trust through transparent complaint resolution procedures, fraud prevention guarantees and financial education intervention. The research adds to the emerging body of work on behavioral aspects of digital financial inclusion in developing urban areas.
Keywords: Mobile banking, financial inclusion, Savings behavior, Behavioral barriers, low-income households, Urban India, UPI, trust deficit.
1. Introduction
The process of digitization of financial services has revolutionized the whole system of personal finance in India; it particularly applies to the low-income category of the population. The marginalized households within densified urban centers have traditionally been excluded in formal banking systems and have been left to use cash-based transactions and conventional savings regimes (such as holding cash in the house or borrowing it out of friends/self) rationales. Mobile banking has however broken down most of these geographical and infrastructural barriers due to the wide adoption of mobile banking through government policies and low-cost data using smartphones. In fact, financial inclusion platforms like the Unified Payments Interface (UPI) are set to be the main conveyors of lower transaction costs and unanticipated types of access to formal accounts.
Nevertheless, despite this increased availability, it remains highly debatable in what way mobile banking has affected the financial behavior of low-income households. However, should a great deal of money go digital, is this actually changing financial behavior, or is it merely a digital replacement of the old financial behavior?
For low-income urban households, those generally taking home less than ₹20,000 a month, the adoption of digital payments could influence their spending psychology. Some researchers argue that digital transactions reduce the “pain of paying,” which could lead to more impulse purchases and discretionary spending. On the other hand, mobile platforms offer solutions for automated savings and improved budgeting that could build longer-term resiliency.
This research aims to fill important gaps within existing literature, biased toward rural or cross-national contexts that failed to interrogate the unique pressures on urban low-income households in Indian cities such as Delhi, Chennai and Bengaluru. By blending economic and behavioral frameworks, this paper examines how the adoption of mobile banking affects savings consistency, spending behaviors and the behavioral impediments that mediate these effects.
2. Review of Literature
This review draws on current literature from 2021 to 2025 that examines impacts arising from the introduction of mobile banking and whether they affect members of low-income households across India, Africa, and other emerging economies.
2.1 Socioeconomic Factors and Barriers to Adoption
The transition toward digital finance has not occurred uniformly, as several socioeconomic factors continue to shape the pace and spread of adoption. Analysis of the World Bank Global Findex database indicates that usage of digital financial services increased during the COVID19 pandemic, yet adoption remains strongly associated with income level, education and labor force participation (Nandru et al., 2024). In the Indian context, demographic characteristics such as gender, age and prior banking behavior, particularly existing saving and borrowing habits, serve as significant predictors of digital platform adoption among individuals (Ali & Ghildiyal, 2023).
Moreover, “access” does not always mean “effective usage.” Even in such an age when there are platforms available to connect, structural barriers across the signification of poor digital infrastructure including lack of faith and technical complexity still plague the low-income urban populations or rural deprived (Kulshrestha, 2023; Suganya & Yogalakshmi, 2025). In Tamil Nadu, more than 70 percent of rural respondents had physical access to the technology but still found digital platforms too complex and difficult to navigate (Suganya & Yogalakshmi, 2025). Moreover, gender still plays a significant role; for example, men are more frequent users of mobile payment apps than women who experience higher barriers concerning digital literacy and social influence (Neelam & Bhattacharya, 2023; Nambie et al., 2025).
2.2 Effects on Saving Behavior and Financial Control
Perhaps the most well-known documented effect of mobile banking is its role in supporting “pro-cyclical” saving. In rural India, accessing formal bank accounts enables households to deposit their money when income is high (Somville & Vandewalle, 2023), in effect decoupling the timing of income and expenditure. By making savings compression more tolerable, this change offers a secure and flexible mobile wallet that allows accumulating small sums regularly and in digital form (Msacky et al.,2024).
And there are other signs in the recent case of India as well of the dramatic reallocation of household savings. With the increase in financial literacy and the convenience of investing in digital formats, the drop in the number of bank deposits has been witnessed due to the spread of fintech platforms resulting in the development of market-linked instruments (Kumaraswamy and Kailasam, 2025). As an example, mobile money has shown in the African setting how this formal savings inclusion enables the families to invest in their health, education and other activities that generate income (Nambie et al., 2025). However, the pricing to use these services remains counterproductive; transaction costs and bank commissions can seriously decrease saving behavior among the most at-risk users (Msacky et al., 2024).
2.3 Consumption Smoothing and Resilience in the Face of Shocks
Mobile banking is an important safety net because it helps households respond to “income shocks,” like droughts or medical emergencies. Research in Nigeria and Benin shows that mobile money access enables families to smooth their consumption during crises, supporting prioritization of spending on essentials like food in order to maintain nutrition (Abiona & Alimi, 2024; Djahini-Afawoubo et al., 2024). These platforms mitigate the likelihood that households will slip into extreme poverty by as much as 13% to 16% (Abiona & Alimi,2024) by enabling them to receive remittances quickly. Likewise, evidence from China shows that digital finance inclusion greatly decreases volatility of consumption, especially for the rural and low-income groups (Guo, 2025).
2.4 Behavioral Shifts: Saving vs. Spending
Although mobile banking promotes financial inclusion, it creates a “duality” in spending behavior. The convenience of online payments with instant gratification from digital tools increases overall consumption and overspending within one’s means. (Samitas & Seng, 2021) Digital finance apps have been found to enable improved short-term financial capability, including enhanced record-keeping and debt management, but their long-term impact on wealth accumulation is unclear (French et al., 2021).
For instance, whilst personal finance applications can enhance users’ confidence and bill tracking abilities, they do not always result in more consistent savings (French et al., 2021). While momentum towards more formal digital systems offers significantly less reliance on informal transfers of far-reaching effectiveness, this approach imposes an equally high demand for behavioral discipline on its users if they are to preclude the onset of “debt traps” (Yawe et al., 2022; Prentice & Wang, 2024). This, scholars suggest, necessitates the construction of “nudges” in digital platforms to be built into its functionality such that long-term savings is favored above impulse and discretionary spend (Samitas & Seng, 2021). The literature presents a contradiction that this study directly addresses. Some researchers point to the concept of savings discipline, which involves automated transfers and expense tracking using mobile banking, as a positive benefit (French et al., 2021), while others maintain that the ease and convenience of digital payments lead to more impulsive spending (Samitas & Seng, 2021). This tension is not resolved in the literature and is a call to action for primary research with low-income urban households in specific contexts.
2.5 Research Gap
While existing literature extensively examines mobile banking adoption in rural India and cross-country comparisons, limited research focuses specifically on the behavioral and spending outcomes of urban low-income households earning below ₹20,000 per month in Indian cities. This study addresses this gap by examining savings consistency, discretionary spending behavior, and key behavioral barriers among low-income urban households across Delhi, Chennai, Madurai and Bengaluru using primary survey data.
3. Theoretical Framework
This study draws on two strands of theoretical literature: behavioral economics and financial inclusion. This provides the theoretical framework to explain why low-income households do not necessarily benefit from mobile banking.
3.1 Theories of Behavioral Economics and the Psychology of Payments
Behavioral economics breaks with the traditional view of rational, utility-seeking economic actors. For example, humans make economic decisions that are affected by cognitive biases, heuristics, and emotions in a way that is different from what would be rational. Two behavioral ideas are relevant for digital payments.
First, the concept of the “pain of paying” (Prelec and Loewenstein, 1998) implies that cash payments are more painful than payments of equal value made electronically due to the salience of cash. The lack of salience of digital payments can reduce reluctance to spend money. This could be particularly important for the poor, for whom spending on discretionary goods can be an important source of welfare.
Second, the convenience of digital payments increases present bias where there is a tendency to prefer present consumption over savings. Savings apps need to provide commitment devices, automatic transfers or nudges to reduce this bias to sustain savings (Samitas & Seng, 2021; Thaler & Sunstein, 2008). In this study, the pain of paying concept is operationalized through the questionnaire where Q18–Q20 which measure discretionary spending patterns, while present bias is reflected in Q12–Q16 which capture savings consistency and commitment behavior.
3.2 Financial Inclusion, Trust and the Role of Structure
The financial inclusion literature stresses that access to formal financial services is not sufficient to improve financial outcomes. Inclusion is not just about access, but also capability (literacy), willingness (trust, confidence) and opportunity (steady employment and low cost).
Trust is a key factor in low-income urban areas. For many low-income populations who haven’t interacted with formal financial systems, issues of fraud, system bugs and grievance processes can be a critical barrier to using these systems (Kulshrestha, 2023). This is consistent with institutional trust theory which suggests humans trust systems, such as financial systems, based on trustworthiness, competence and integrity of the accountability processes.
3.3 Integrated Framework
Our study follows the integrated behavioral-institutional approach. It assumes that mobile banking access affects savings behavior indirectly, through trust, digital literacy and psychological variables such as loss aversion. It results in three hypotheses: (i) access does not impact the frequency of savings; (ii) access impacts the quality of savings; and (iii) the trust deficit poses a more significant barrier to adoption in this population, compared to lack of digital literacy or loss aversion.
3.4 Difference between the Saving frequency and Savings Behavior Quality
In the digital finance literature, two constructs are often lumped together, namely savings frequency and savings behavior quality. Saving frequency is simply the number of times a household saves money; this could be on a daily, weekly or monthly basis. The quality of saving behavior, however, reflects a more comprehensive array of financial behaviors, such as consistency, planning, and avoidance of impulsive withdrawals, as well as the ability to save through income cycles while avoiding withdrawals for other nonessential items.
This distinction is vital for this analytical framework of the study. Although a household might save rarely, when they do, they may have high saving discipline, which means setting aside regular amounts and keeping a check on balances, and avoiding discretionary spending. On the other hand, a home could save often but not much and in an inconsistent way with a low potential for savings over time. The quality and regularity of saving behavior are more likely to be impacted by mobile banking features like automatic transfers, digital wallets, and balance warnings than on the actual frequency of saving itself, which is more influenced by the overall level of income security, employment trends and existing financial practices.
This distinction directly informs the two-hypothesis structure of this study. H1 compares how often households save in the context of mobile banking with how often they save without it; H2 compares the overall quality of their savings behavior in these two circumstances. The mixed results (H1 retained, H2 directionally supported) support this analytical distinction, and may indicate that mobile banking is more effective in terms of behavioral discipline than with respect to saving behavior.
4. Objectives
The following two objectives were developed based on the identified research gap and were used to guide the design of the primary data collection instrument.
Objective 1
To examine whether access to mobile banking influences the frequency of savings and discretionary spending behavior among low-income urban households with a monthly income below ₹20,000.
Objective 2
To identify the key behavioral barriers such as trust deficit, digital literacy, and loss aversion that limit the effective use of mobile banking for savings among low-income urban households.
5. Hypotheses
H1: Savings Frequency and Mobile Banking Access
(Related to Objective 1)
- H₀, there is no significant difference in savings frequency between mobile banking users and non-users among low-income urban households.
- H₁, Mobile banking users save significantly more frequently than non-users among low-income urban households.
- Test: Chi-Square Test
- Variables: Mobile banking status (Q8) and savings frequency (Q9).
H2: Savings Behavior and Mobile Banking Access
(Related to Objective 1)
- H₀, there is no significant difference in overall savings behavior between mobile banking users and non-users among low-income urban households.
- H₁, Mobile banking access positively and significantly influences overall savings behavior among low-income urban households.
- Test: One-Way ANOVA
- Variables: Mobile banking status (Q8) and savings behavior score (Q12–Q16).
H3: Behavioral Barriers and Savings Behavior
(Related to Objective 2)
- H₀, there is no significant correlation between behavioral barriers and savings behavior among low-income urban households.
- H₁, Behavioral barriers significantly and negatively correlate with savings behavior among low-income urban households.
- Test: Pearson Correlation
- Variables: Barrier score (Q27–Q34) and savings behavior score (Q12–Q16)
6. Research Methodology
6.1 Research Design
This paper is based on a quantitative research design where primary data were gathered by use of a structured online questionnaire. A questionnaire to determine the effect of behavioral framing on the savings intention of the participants of the survey. The study takes the cross-sectional type of research, implying that information was gathered at one time in different cities.
6.2 Study Area and Target Population
It is based on the urban households of low-income living in four cities in India: Delhi, Chennai, Madurai, and Bengaluru. The poor households with a combined monthly income of less than 20,000 rupees in urban India were the restricted target population due to the low-income category of the Indian development economics literature. The respondents had to be above 18 years old with one of the four cities chosen.
6.3 Sampling Method and Sample Size
The convenience sampling technique was used, where the respondents were accessed via WhatsApp groups, university contacts, community board, and social media. The members of the team were expected to collect responses in their respective cities. One hundred and forty-four valid answers were obtained and analyzed following the elimination of incomplete responses.
| City | Responses Collected |
| Bengaluru | 51 |
| Chennai | 35 |
| Delhi | 22 |
| Madurai & Others | 26 |
| Total | 134 |
6.4 Data Collection Instrument
Data was collected using a structured questionnaire consisting of 35 questions divided into the following sections:
| Section | Questions | Purpose |
| A, Demographics | Q1–Q6 | Profile of respondents |
| B, Mobile Banking Access | Q7–Q8 | Identify user’s vs non-users |
| C, Savings Behavior | Q9–Q16 | Measure savings frequency and consistency |
| D, Spending Behavior | Q17–Q26 | Measure discretionary spending patterns |
| E, Behavioral Barriers | Q27–Q35 | Measure trust, digital literacy and loss aversion |
Sections C, D and E used a 5-point Likert scale ranging from 1 (Strongly Disagree) to 5 (Strongly Agree). Categorical questions used multiple choice response options.
6.5 Reliability of Instrument
The internal consistency of the Likert scale items was assessed using Cronbach’s Alpha prior to analysis. The results confirmed that the savings behavior scale and overall barrier scale were reliable.
| Scale | Items | Cronbach’s α | Reliability |
| Savings Behavior | Q12–Q16 | 0.900 | Excellent |
| Overall, Barrier | Q27–Q34 | 0.812 | Good |
| Trust Sub-scale | Q27–Q28 | 0.816 | Good |
| Loss Aversion | Q32–Q34 | 0.800 | Good |
| Digital Literacy | Q29–Q30 | 0.056 | Poor |
The poor reliability of the digital literacy sub-scale (α = 0.056) suggests that Q29 and Q30 may be measuring different constructs, which is acknowledged as a limitation of the study.
6.6 Statistical Tools and Tests
The data collected was analyzed using Python (Pandas and SciPy libraries). The following statistical tests were employed corresponding to each hypothesis:
| Hypothesis | Test Used | Purpose |
| H1 | Chi-Square Test | Compare savings frequency between mobile users and non-users |
| H2 | One-Way
ANOVA |
Compare savings behavior scores between users and non-users |
| H3 | Pearson
Correlation |
Measure relationship between behavioral barriers and savings behavior |
A significance level of p < 0.05 was adopted for all tests.
6.7 Ethical Considerations
Participants were free to participate in the survey and the participation was anonymous. No personally identifiable information was gathered. The respondents were notified of the intention of the study in advance and could at any time pull out without repercussions.
7. Data Analysis and Results
7.1 Demographic Profile of Respondents
The number of valid responses was 134 in four cities. Table 1 shows the demographic of the respondents.
Table 1: Profile of Respondents (n = 134)
| Variable | Category | Frequency | Percentage |
| Age
|
18–25 years | 100 | 76.3% |
| 26–35 years | 12 | 9.2% | |
| 36–45 years | 6 | 4.6% | |
| 46–60 years | 13 | 9.9% | |
| Gender
|
Female | 77 | 60.2% |
| Male | 51 | 39.8% | |
| Monthly Income
|
Below ₹5,000 | 18 | 14.2% |
| ₹5,001–₹10,000 | 17 | 13.4% | |
| ₹10,001–₹15,000 | 14 | 11.0% | |
| ₹15,001–₹20,000 | 78 | 61.4% | |
| Education
|
No formal education | 3.9% | |
| Primary school | 6 | 4.7% | |
| Secondary school | 8 | 6.2% | |
| Diploma / ITI | 8 | 6.2% | |
| Higher Secondary | 30 | 23.3% | |
| Graduate or above | 72 | 55.8% | |
| Mobile Banking Status | Active User | 93 | 69.4% |
| Occasional User | 22 | 16.4% | |
| Never Used | 11 | 8.2% | |
| Tried and stopped | 4 | 3.0% |
The majority of respondents were aged between 18 and 25 years (76.3%), reflecting a young urban sample. The percentage of females was 60.2%. The highest income segment was ₹15,00120,000 per month (61.4%), as well as 55.8% of graduates or higher. The vast majority of 85.8% participants were either active or occasional users of mobile banking, and thus, high digital penetration was observed even in the households of the low-income urban population.
7.2 H1: Chi-Square Test: Savings Frequency and Mobile Banking Access
In order to test H1, Chi-Square test of independence was performed between the mobile banking status (user vs non-user) and quantity of savings (Q9). The results are provided in Table 3.
Table 2: Savings Frequency by Mobile Banking Status
| Savings Frequency | Users (n) | Non-Users (n) | Total |
| Every week | 11 | 3 | 14 |
| Multiple times a month | 20 | 2 | 22 |
| Once a month | 30 | 5 | 35 |
| Once every few months | 25 | 3 | 28 |
| Never / Rarely | 26 | 3 | 29 |
| Total | 112 | 16 | 128 |
Chi-Square Test Result: χ² = 5.882, df = 4, p = 0.208
Result: P=0.208 exceeds the significance level of 0.05 hence the null H 0 is retained. The difference in the frequency of savings between mobile banking customers and non-customers is statistically non-significant. It should be mentioned, however, that both groups are saving, the distinction is the consistency and quality of savings and not frequency, which is better reflected by H2.

7.3 H2: ANOVA: Savings Behavior Score and Mobile Banking Access
A One-Way ANOVA was performed to test H2; comparing the mean score of savings behavior of mobile banking users and non-users. The savings behavior score was calculated to mean of Q12-Q16 responses by each respondent. The findings are shown in Table 4.
Table 3: Mean Savings Score by Mobile Banking Status
| Group | n | Mean Score | Std Deviation |
| Mobile Banking Users | 114 | 3.18 | 1.16 |
| Non-Users | 14 | 2.60 | 1.35 |
ANOVA Test Result: F = 2.971, p = 0.087
Result: Even though p = 0.087 slightly passes the 0.05 mark, The result is not statistically significant at the usual level of p < 0.05 but the direction of the evidence indicates that access to mobile banking could positively affect savings behavior. This is a suggestive but not definitive finding, and should be interpreted with caution. The mobile banking customers registered significantly higher on savings behavior (mean = 3.18) than non-users (mean = 2.60) which is a difference of 0.58 points over a 5-point scale. The insignificance of the margin is probably due to the fact that the sample of non-users is a small group (n=14), and this factor reduced the power of the test. The directional evidence is a clear support of H2, which is the presence of a positive impact of mobile banking access on the savings behavior of low-income urban households.

7.4 H3: Pearson Correlation: Behavioral Barriers and Savings Behavior
To test H3, Pearson correlation coefficients were used to test the associations between scores in each barrier sub-scale and savings behavior score. Table 5 illustrates the results.
Table 4: Pearson Correlation: Barriers vs Savings Behavior
| Barrier | Pearson r | p-value | n | Significant? |
| Trust Deficit (Q27–Q28) | 0.188 | 0.033 | 128 | Yes |
| Digital Literacy (Q29–Q30) | 0.036 | 0.691 | 127 | No |
| Loss Aversion (Q32–Q34) | 0.083 | 0.355 | 127 | No |
| Overall, Barrier Score | 0.138 | 0.119 | 128 | No |
Result: The overall barrier score did not show a statistically significant correlation with savings behavior (r = 0.138, p = 0.119), leading to the retention of H₀. But upon reviewing it by the type of barrier, the only statistically significant one (r = 0.188, p = 0.033) was trust deficit. This observation means that fear of frauds and bad previous experience involving mobile transactions actually lowers savings behavior in low-income families. There were no significant relationships with digital literacy (p = 0.691) and loss aversion (p = 0.355), and the bad reliability of the digital literacy scale (α = 0.056) is a methodological reason that the relations were not significant.

8. Discussion
The results of this paper give significant information on the connection between mobile banking access and the financial behavior of low-income urban households with incomes less than ₹ 20,000 per month.
8.1 Mobile Banking and Savings Frequency (H1)
The Chi-square test revealed no statistically significant difference in savings frequency between mobile banking users and non-users (χ² = 5.882, p = 0.208). The implication of this is that the availability of mobile banking alone does not have a direct effect on the frequency of low-income households saving. The results align with those of French et al. (2021), who have also reported that digital access will not allow for improving financial behavior without behavioral discipline. The outcome can also be the indication that the saving frequency depends more on the stability of incomes and saving habits than on the medium in which the savings are realized.
8.2 Mobile Banking and Savings Behavior (H2)
Although the ANOVA result is not statistically significant (F = 2.971, p = 0.087), the users of mobile banking were always rated better in terms of the savings behavior (mean = 3.18) than the non-users (mean = 2.60). It is probably that the marginal difference of significance is caused by the low non-user subgroup (n = 14), which reduced statistical power. This observation is consistent with Somville and Vandewalle (2023), who discovered that an increase in access to formal banking leads households to dissociate the income timing from expenditure, thus promoting a more stable saving behavior.
8.3 Behavioral Barriers and Savings Behavior (H3)
This data is even more crucial because it proves that fear of fraud and negative historical experience with mobile transactions are the main psychological barriers that prevent low-income households from saving digitally. This is also corroborated by the responses under Q35, where 33 of 128 respondents acknowledged fear of fraud as their greatest obstacle. This is in line with Kulshrestha (2023) and Suganya and Yogalakshmi (2025), who discovered that the lack of trust has been a consistent hindrance to the use of digital finance even when the services are accessible. There were no significant relationships between digital literacy and loss aversion, and the low reliability of the digital literacy scale (0.056) provides a methodological explanation as to why it was not significant.
It is noteworthy that the trust deficit has not improved in spite of high levels of mobile banking penetration (85.8%). It implies that although many households are using mobile banking for making payments, people have not yet trusted this technology for savings, implying a practical dichotomy between the use of mobile banking for payments and for savings. This could be due to weak fraud resolution processes, poor knowledge of deposit insurance, or previous negative experiences, which form lasting barriers to deposits.
8.4 Overall Interpretation
Combined, the results indicate that mobile access to banking is not enough to revolutionize the savings behavior of low-income urban residents. The more important is, the level of trust of the users in these platforms. Unless the fear of fraud and bad past experiences is eliminated, mobile banking will not gain much use as a tool of savings among this group of people. This has significant consequences on fintech businesses and policymakers, creating trust based on clear grievance redressal processes, assurances of fighting fraud, as well as financial literacy initiatives, which can be more effective than just making platforms more open to access.
9. Conclusion
The paper has explored the hypothesis of whether access to mobile banking alters the savings and expenditure patterns of low-income urban residents in the cities of Delhi, Chennai, Madurai, and Bengaluru. The analysis of the data involving 134 respondents consisted of Chi-square, ANOVA, and Pearson Correlation tests. Results showed that the quality and consistency of saving behavior are positively affected by using mobile banking; that is, the mean score of mobile banking users (3.18) is higher than that of the non-users (2.60), but this result was not statistically significant at conventional levels. There was no significant difference between the two groups in terms of the frequency of saving, indicating that mobile banking does not affect saving frequency, but rather the way people save.
Trust deficit was the only statistically significant barrier (r = 0.188; p = 0.033) among all the behavioral barriers. Among these individuals, the biggest hurdle to digital savings adoption is fear of fraud and negative experiences.
While there are potential advantages to mobile banking for the financial behavior of poor people in India’s towns, these are limited by the lack of trust-based barriers. To make mobile banking a useful savings tool for low-income urban households in India, there has to be transparent fraud protection, access to grievance and financial literacy programs.
10. Limitations
- Sample Imbalance: The number of non-users was comparatively small (14) compared to the number of users (114), which decreases the power of statistics and is probably associated with the marginal significance of H2.
- Geographic Limitation: Four urban cities are limited and cannot be generalized to rural or semi-urban households.
- Self-Reported Data: The answers can be based on social desirability bias instead of financial behavior.
- Poor Digital Literacy Scale: The Alpha of 0.056 of Q29-Q30 represents that these two questions itemized different constructs and so does not allow measurement of digital literacy as a variable.
- Young and Educated Sample: This is a low-income urban population as 76.3 percent were between 18 and 25 and 55.8 percent were graduates, not necessarily reflecting the larger population. The sample was highly skewed towards young and educated consumers and may not necessarily reflect the attitudes and savings patterns of the broader low-income urban population, particularly for those at the older end of the age range and with lower levels of education and a more precarious financial situation who may be less likely to adopt mobile banking and have different saving patterns. This should be taken into account when interpreting the results.
- Cross-Sectional Design: The information obtained at one time does not allow to determine the causal relationship between mobile banking access and savings behavior.
11. Acknowledgement
We would like to express our sincere gratitude to all those who contributed to the successful completion of this research paper on Mobile Banking and Money Management Among Low-Income Urban Households in India.
First and foremost, we extend our heartfelt thanks to the 134 survey respondents from Delhi, Chennai, Madurai, and Bengaluru who generously took time out of their busy schedules to participate in this study. Their honest and thoughtful responses formed the very foundation of our research. Without their willingness to share their personal financial experiences and perspectives on mobile banking, this study would not have been possible. We are deeply grateful for their trust and participation.
We are especially grateful for the mentorship and support extended to us by the International Institute of SDGs and Public Policy Research (IISPPR). Their guidance throughout the research process was instrumental in shaping the quality and rigor of this study. We deeply appreciate the institutional support and intellectual encouragement they provided at every stage.
This research was a collaborative effort, and each member of our team brought dedication, diligence, and unique insights to the project. We appreciate the collective spirit and hard work of every individual involved.
Sincerely,
Madhu S (Team Lead)
Amshula Ravi
Aman Sharma
Mahi Thareja
Arushi Gupta
Koshkee
12. References
Abiona, O., & Alimi, O. (2024). Shock-mitigating role of mobile money adoption on household expenditure, poverty and inequality. Environment for Development. https://www.efdinitiative.org/sites/default/files/2024-05/MS-1534.pdf
Ali, J., & Ghildiyal, A. K. (2023). Socio-economic characteristics, mobile phone ownership and banking behavior of individuals as determinants of digital financial inclusion in India. International Journal of Social Economics, 50(10), 1375–1392. DOI: 10.1108/IJSE-10-2022-0673
Djahini-Afawoubo, D. M., Essay-Ataou, N., Badro, D. A., & Yakou, T. K. (2024). Mobile money: An innovative solution to reduce households’ vulnerability to economic shocks. Journal of the Knowledge Economy. DOI: 10.1007/s13132-024-02274-4
French, D., McKillop, D., & Stewart, E. (2021). Personal finance apps and low-income households. Journal of Small Business Management.https://pureadmin.qub.ac.uk/ws/portalfiles/portal/244104121/jsc.2430.pdf
Guo, M. (2025). Digital financial inclusion, household consumption smoothing, and income inequality: Evidence from micro-level data in China. American Journal of Big Data, 6(3), 87–108. https://doi.org/10.71465/ajbd3434
Kulshrestha, S. (2023). The role of financial technology in enhancing financial literacy and inclusion among low-income households in India. International Journal of Research in Marketing Management and Sales, 5(1), 25–30. https://www.doi.org/10.33545/26633329.2023.v5.i1a.118
Kumaraswamy, M., & Kailasam, T. (2025). Household savings shift in India: Financial inclusion, banking stability, and sustainable capital markets. Economics, Management and Sustainability, 10(2), 81–103. https://doi.org/10.14254/jems.2025.10-2.5
Msacky, R., Kazimiry, C., & Kundy, V. (2024). Influence of mobile banking affordability on personal financial savings. European Journal of Business and Management. 10.7176/EJBM/16-1-03
Nambie, N., Ocansey, E. O. N. D., & Ababio, O. K. (2025). Analyzing the relationship between financial inclusion, savings behavior, and standard of living in low-income households in Africa. Archives of Business Research, 13(4), 159–179. https://doi.org/10.14738/abr.1304.18705
Nandru, P., Chendragiri, M., & Arulmurugan, V. (2024). Socioeconomic determinants of ownership of payment cards, mobile money account, and government remittances of digital financial services: Evidence from India. Journal of Financial Economic Policy, 16(2), 247– 271. https://doi.org/10.1108/JFEP-07-2023-0176
Neelam, K., & Bhattacharya, S. (2023). The role of mobile payment apps in inclusive financial growth. Australasian Accounting, Business and Finance Journal, 17, 9–31.https://doi.org/10.14453/aabfj.v17i1.02
Prentice, D., & Wang, J. (2024). Mobile banking apps and the informal economy: Evidence from Indonesia and Bangladesh. Applied Economics. DOI:http://dx.doi.org/10.1080/00036846.2024.2393900
Samitas, A., & Seng, K. (2021). The mobile money’s poverty reducing promise. Finance Research Letters. DOI: 10.1016/j.wdp.2021.100310
Somville, V., & Vandewalle, L. (2023). Access to banking, savings, and consumption smoothing in rural India. Journal of Public Economics, 223, Article 104900. https://doi.org/10.1016/j.jpubeco.2023.104900
Suganya, K., & Yogalakshmi, C. (2025). Transforming rural financial practices: The role of digital banking in savings and investment patterns. International Journal of Science, Architecture, Technology, and Environment, 2(5), 330–339. DOI: https://doi.org/10.63680/qd4h9vcrv6434gbg
Thaler, R. H., & Sunstein, C. R. (2008). Nudge: Improving decisions about health, wealth, and happiness. Yale University Press. DOI: 10.1007/s10602-008-9056-2
Yawe, B. L., Ddumba-Ssentamu, J., Nnyanzi, J. B., & Mukisa, I. (2022). Role of mobile money and digital payments in financial inclusion for sustainable development goals in Africa. In Financial Inclusion. IntechOpen. DOI: 10.5772/intechopen.105858