Authors:
Gideon Yaw Agyemang, Riya Sharma, Jhalak Yadav, Anushka Patil, Pragati Singh, Vrinda Verma, Ibrahim Oluwatoyosi
1. ABSTRACT
Plastic contamination of aquatic systems is a critical environmental issue, yet the evidence base remains fragmented across marine and freshwater environments due to incompatible measurement protocols. This study synthesizes secondary data to characterize the sources, transport pathways, spatial distribution, and temporal trends of micro- and macroplastic contamination, evaluating the comparability of published observations. The design is quantitative and comparative, relying entirely on existing datasets without primary sampling. Four secondary datasets were analyzed: UNEP and Chassignet et al. (2021) on marine plastic sources and transport; the Atlas of Ocean Microplastics (AOMI) on ocean surface microplastic density; the OECD Global Plastics Outlook database on plastic use, waste, leakage, and projections; and the NOAA NCEI Marine Microplastics Database on microplastic concentrations across marine matrices. Variables regarding concentration, waste generation, leakage, location, particle density, transport pathways, and reporting periods were extracted, standardized, and structured while retaining sampling and analytical metadata. The synthesis confirms that rivers act simultaneously as plastic accumulation zones and primary conduits to oceans, microplastics permeate all aquatic compartments, and freshwater systems remain undersampled relative to oceans. Methodological heterogeneity including variations in sampling gear, mesh aperture, size definitions, laboratory preparation, counting conventions, and model-derived data prevents direct interchangeability of reported values. Harmonized sampling protocols and reporting conventions are necessary for data aggregation and operational monitoring.
KEYWORDS
Microplastic, Macroplastic, Water bodies, Detection, Contamination, Urban input, Fibers, Assessment, Remote Sensing, Sediments, Plastic pollution
2. INTRODUCTION
2.1 Background
Plastic is used almost everywhere in daily life. It is used for bottles, bags, food packaging, clothing, household products and many other items. Plastic has made many things easier because it is light, strong and inexpensive (Thompson et al., 2009). However, the large quantity of plastic used every day has also created a waste problem. When plastic waste is not properly collected or disposed of, it can reach rivers, lakes, ponds and other water bodies. Once it enters the aquatic environment, it can remain there for a long time and become a source of pollution, because plastics resist degradation long after their intended use (Galgani et al., 2013; Geyer et al., 2017). Water bodies are one of the places where plastic waste can collect and move from one area to another. Plastic can enter water through domestic waste, wastewater, industrial activities, surface runoff and improper disposal. During rainfall, plastic waste lying on roads, open areas and nearby land can also be carried into drains and rivers (Kong et al., 2024). In this way, the amount of plastic in a water body is not the same at every location. Areas with more population, urban activity or industry may receive more plastic waste than areas with less human activity (Browne et al., 2011; Luo et al., 2019).
2.2 Micro- and Macroplastics in Water Bodies
Plastic found in the environment is not present in only one form or size. Some plastic waste is large enough to be seen easily, such as bottles, bags, food wrappers and other discarded items. These larger pieces are generally referred to as macroplastics. Over time, larger plastic items can break into smaller pieces due to sunlight, mechanical movement, weathering and other natural processes. These smaller particles are known as microplastics, and they are usually defined as particles smaller than 5 mm in diameter (Kong et al., 2024; Wagner et al., 2021). Because microplastics are very small, they are more difficult to see, collect and identify than larger plastic waste. Microplastics have become an important subject of research in recent years. They have been found in rivers, lakes, sediments and other aquatic environments (Wright et al., 2013; Li et al., 2018). Their small size allows them to move easily with water and, in some cases, to settle into sediments. The movement of these particles depends on their size, shape, density and the flow of water. Some plastic particles remain near the surface, while others may settle at the bottom. For this reason, looking only at visible plastic waste does not give a complete idea of plastic contamination in a water body. Studies have also shown that freshwater systems can act both as places where plastic accumulates and as pathways through which plastic is transported further downstream (Blettler et al., 2017; Zhao et al., 2019). Microplastics can be found in different shapes. Fibres, fragments, films and pellets are some of the common forms reported in freshwater studies. The shape of a particle can sometimes give an idea about its possible source. Fibres may be associated with clothes, washing activities and wastewater (Browne et al., 2011), while fragments and films may result from the breaking down of larger plastic materials. The type of polymer is also useful, because different plastic products are made from different polymers. Lahens et al. (2018) reported polyethylene, polypropylene and polyester as the main polymers in the Saigon River. Studies of freshwater systems in India have likewise reported several types of microplastics and have shown that human activities are an important factor affecting their presence in water bodies. Gupta et al. (2024), for example, identified polyacrylamide, polyamide and polyvinyl chloride as the most commonly detected polymers in the Ganga and Yamuna, with fibre-shaped particles predominant in both rivers.
2.3 Variation in Contamination by Place and Time
The location of a water body matters when studying plastic pollution. An upstream area may have comparatively less human influence, while a river passing through an urban area can receive waste from households, markets and wastewater. Further downstream, industrial discharge may add another source of plastic contamination. Vaid et al. (2022) recorded a gradient of this kind in the Yamuna at Delhi, where microplastic abundance increased from about 500 particles per cubic metre at the Wazirabad barrage to about 3,900 particles per cubic metre at the Okhla barrage downstream, with the highest values found below major drain outfalls. Studies of this kind show that contamination changes from place to place along a water body, and that the surrounding land use is an important reason for the difference. Plastic contamination can also change with time. Rainfall and runoff during the monsoon can carry waste from surrounding areas into rivers and other water bodies, and increased water movement can transport plastic particles from one place to another. On the other hand, when water flow is lower, some plastic waste may remain accumulated at particular locations or settle into sediments. A study of the Ganga and Yamuna rivers found differences in plastic distribution between wet and dry seasons, with microplastic concentrations and estimated plastic flux generally higher during the wet season (Gupta et al., 2024). Over longer periods, the amount of plastic entering water bodies also changes as plastic use, waste generation and waste management practices change. Plastic particles are also present in different parts of a water body and do not remain only on the surface. Some particles float in the water, while others move deeper or settle with sediments. Their distribution can change with water flow, particle size and other environmental conditions. Barceló and Pico (2020) note that subsurface and midwater-column sampling is needed before the movement of plastic can be estimated reliably, since surface sampling alone misses the part of the load carried at depth. For this reason, information from water, sediments and beaches together gives a better understanding of the overall level of plastic contamination than information from any one of them alone.
2.4 Detection and Identification
Detection of plastic contamination is important for understanding the actual condition of a water body. Large plastic waste can be noticed easily, but microplastics are much harder to identify because of their small size and varied appearance, which can make them difficult to distinguish from other particles in a sample. Their presence may not always be clear from simple observation, so proper sampling and identification are needed. Looking at the shape, size and physical characteristics of the particles can provide useful initial information, and further identification using techniques such as Fourier-transform infrared spectroscopy or Raman spectroscopy is needed to confirm the type of plastic present (Hidalgo-Ruz et al., 2012). This information can help in understanding the possible sources of plastic contamination and in comparing contamination between different locations. Studying both microplastics and macroplastics is useful because they are connected but do not always behave in the same way. Macroplastics are easier to see and record, but they can remain in the environment and slowly break into smaller pieces. Microplastics are harder to detect and can move through water or settle in sediments. Research has also shown that the distribution of macroplastics cannot always be used to predict the distribution of microplastics. Blettler et al. (2017) tested this relationship and found that macroplastic counts differed significantly between transects while microplastic densities did not follow the same pattern. This means that both forms need to be considered separately when studying plastic pollution.
2.5 Research Gap and Data Used in This Study
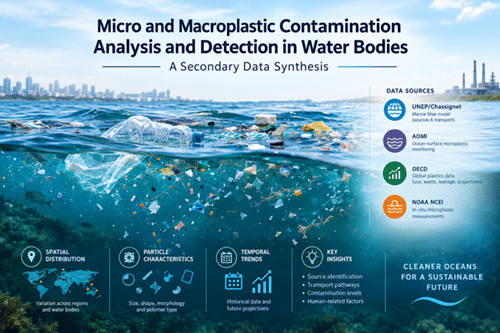
There are still some difficulties in studying microplastic pollution. Different studies often use different sampling methods, particle size ranges, filtration methods and identification techniques. Because of these differences, comparing results from different water bodies can be difficult (Prata et al., 2020; Wagner et al., 2021). Researchers have also pointed out the need for simple and reliable methods that can be used more consistently. Freshwater systems need particular attention, because rivers, lakes, ponds and reservoirs can accumulate plastic waste and can also transport it to other water bodies, yet they remain less studied than marine environments (Eerkes-Medrano et al., 2015; Blettler et al., 2017). Because of these difficulties, a large amount of useful information already exists but is spread across separate collections that were prepared in different ways and are not directly comparable. Four such collections are used in this study. The UNEP dataset, based on the work of Chassignet et al. (2021), describes the sources of marine plastic and the way it moves. The Atlas of Ocean Microplastics (AOMI) records the occurrence and density of microplastics in ocean surface water. The OECD Global Plastics Outlook reports plastic use, waste generation, leakage and future projections at country level.
The NOAA National Centers for Environmental Information (NCEI) Marine Microplastics Database records measured microplastic concentrations in water, sediments, beaches and other settings. No water or sediment samples were collected for this study. Instead, records from these four sources were brought together, standardised and compared. Because the datasets are organised by ocean basin, region and country, comparison between places is made at that scale rather than at the scale of a single river reach, and comparison over time is made using the reporting years recorded in each dataset. The sampling method, mesh size and analytical method reported for each record were also kept, so that differences in the way the data were produced remain visible when the records are compared.
2.6 Aim of the Study
Considering these issues, the study of plastic contamination in water bodies is important for understanding where plastic is present, how it is distributed and what factors may be responsible for its presence. Looking at different locations, time periods, particle types and size classes can give a better picture of the problem than studying only visible plastic waste. It can also help in identifying areas that may require better waste management and regular monitoring. The project report, ‘Micro- and Macroplastic Contamination Analysis and Detection in Water Bodies: A Secondary Data Synthesis’, therefore aims to understand the occurrence, distribution and movement of micro- and macroplastics in water bodies using existing datasets. It examines where plastic comes from, how it is transported, the regions in which it accumulates, and how plastic use, waste generation and leakage have changed over time. It also records the differences in sampling and analytical method between the datasets, so that it is clear which comparisons can reasonably be made and which cannot. Through this analysis, the project aims to develop a clearer understanding of plastic pollution in water bodies and of the need for better monitoring and management of plastic waste.
3. LITERATURE REVIEW
3.1 Plastic Pollution as a Global Environmental Problem
Plastics are lightweight, durable polymers composed of long molecular chains (Thompson et al., 2009). Rapid growth in production and consumption over recent decades, driven by versatility and durability, has made plastics indispensable across industries and households (Thompson et al., 2009; Plastics Europe, 2016). However, these same properties cause persistence in terrestrial and aquatic environments long after service life, making plastic pollution a rapidly growing global threat (Galgani et al., 2013; Geyer et al., 2017).
Literature distinguishes two size classes with distinct detection requirements and ecological impacts. Microplastics are defined as particles <5 mm in diameter (Kong et al., 2024; Wagner et al., 2021), originating from direct environmental release or the breakdown of larger plastic items. Macroplastics are substantially larger, extending up to several meters. Consequently, macroplastics are detected visually, whereas microplastics require complex sampling, separation, and instrumental identification. Both size classes induce physical and chemical ecological impacts; understanding detection mechanisms and ecological effects is essential for effective mitigation. Microplastics are recorded globally, including subtropical beaches, prompting expanded research. Lahens et al. (2018) provided an initial combined assessment of macroplastic and microplastic contamination in a tropical river, referenced below.
3.2 Methods of Detection and Analysis
3.2.1 Macroplastics Monitoring Protocols
Macroplastics include visible debris such as bags, bottles, containers, packaging film, and fishing nets. Because magnification is unnecessary, monitoring is inexpensive and accessible to trained nonspecialists (Blettler et al., 2017). Protocols rely on defining survey unit dimensions, collecting or observing items, and normalizing counts for comparative analysis.
Shoreline and bank surveys evaluate stranded debris. Defining survey dimensions prior to collection is essential to express counts per unit area or shoreline length; raw counts without normalization lack comparative utility. Where full censuses are impractical, transect and quadrat sampling designs provide representative subsamples. Transects run perpendicular or parallel to the waterline, while fixed quadrats are placed systematically or randomly. Replication is crucial: Blettler et al. (2017) observed significant count variance between transects within sites, demonstrating substantial spatial variability.
Floating-debris observations monitor plastics in transport using visual counts from fixed vantage points or moving vessels. Window dimensions and surface width must be recorded to calculate counts per unit time or surface area. Lahens et al. (2018) reported macroplastics as a proportion of total floating debris in the Saigon River, requiring characterization of non-plastic debris. Recovered items are categorized by size, color, texture, polymer, or source using predefined lists to enable cross-study aggregation. Both count and mass should be reported, as light versus heavy items yield differing debris profiles. Survey unit dimensions, date, and lower size cut-offs must accompany reported figures.
Emerging alternatives to manual surveys address scalability limitations. Barceló and Picó (2020) highlighted unmanned aerial systems for beach and dune litter mapping, as well as low-cost paddle-board mounted trawls for nearshore sampling where research vessels cannot operate.
3.2.2 Microplastic Sampling, Separation and Identification
Microplastics are challenging to detect due to small size, variable morphology (fibres, films, fragments, spheres), and mixture with organic/inorganic matrices. Separation requires specialized sieves and screens.
Hidalgo-Ruz et al. (2012) detailed selective, volumetric, and composite sampling approaches chosen based on target particle size, matrix characteristics, and available equipment. Density-based separation separates lighter polymers from heavier mineral/organic fractions, particularly in sediment cores. Sample processing relies on filters or sieves; aperture size strictly defines the detectable particle range.
Instrumental identification is required to confirm polymer composition. Standard methods include Fourier transform infrared spectroscopy (FTIR), Raman spectroscopy, scanning electron microscopy (SEM), and pyrolysis gas chromatography-mass spectrometry (PyGC/MS). Spectroscopic techniques detect polymer compounds via light-sample interaction (Kong et al., 2024).
3.3 Impacts on Ecosystems and Human Health
Experimental studies show microplastic exposure reduces feeding efficiency, impairs reproduction, alters metabolism, induces oxidative stress, disrupts immunity, and enhances toxicity of co-occurring sorbed contaminants (Lee et al., 2013; Cole et al., 2011, 2015; Browne et al., 2011; Wu et al., 2018; Barboza et al., 2018). In freshwater species, Kaloyianni et al. (2021) demonstrated that 21-day polystyrene exposure in Danio rerio and Perca fluviatilis elevated oxidative damage, DNA damage, and apoptotic/autophagic pathways, with species- and tissue-specific responses.
Microplastics also alter broader ecosystem processes by reducing light penetration and altering sediment properties (Eerkes-Medrano et al., 2015). Microplastics occur globally across rivers, lakes, estuaries, deep oceans, polar regions, and marine sediments (Wright et al., 2013; Li et al., 2018). Urban freshwater microplastic concentrations frequently match or exceed marine levels (Luo et al., 2019), confirming rivers act as both accumulation zones and primary transport conduits. For instance, the Changjiang River delivers ~1.6 x 10^13 to 2.0 x 10^13 particles yr^-1 to the ocean (Zhao et al., 2019), and the Saigon River contributes ~1.15 x 10^14 to 1.64 x 10^14 synthetic fibres yr^-1 (Strady et al., 2020).
3.4 Methodological Constraints and the Comparability of Findings
Methodological inconsistency limits data comparability. Barceló and Picó (2020) noted missing standardized sampling procedures and excessive reliance on visual census. Crucially, macroplastic abundance cannot serve as a proxy for microplastic abundance: Blettler et al. (2017) demonstrated that spatial macroplastic variation did not correlate with microplastic density, requiring separate monitoring resourcing.
Complete contamination assessment requires polymer composition, shape, size, weathering, and oxidation state to infer pollution sources and transport fate. However, high costs limit sample throughput. Furthermore, research remains biased toward marine environments, leaving freshwater conduits understudied (Blettler et al., 2017; Barceló and Picó, 2020). Varied sampling protocols, mesh apertures, and size class definitions (<5 mm for microplastics; up to meters for macroplastics) severely restrict data comparability across studies (Kong et al., 2024; Wagner et al., 2021).
3.5 Research Findings and Global Context
Rivers are vital land-to-ocean plastic transport pathways. In the Saigon River, macroplastics comprised 10–35% of floating debris (dominated by plastic bags), with exceptionally high microplastic fibre loads attributed to textile industries and untreated domestic wastewater (Lahens et al., 2018). Polyethylene, polypropylene, and polyester dominated, reflecting urban packaging and laundry effluents. Globally, Geyer et al. (2017) estimated that 9% of plastic waste is recycled, 12% incinerated, and 79% accumulated in landfills or environment. Ingestion, entanglement, and chemical transfer affect taxa globally, but methodological differences hinder cross-study comparison.
3.6 Gaps and Directions for Future Research
Four key research gaps persist:
- Transport and fate quantification: Sub-surface and mid-water column sampling is needed to complement surface sampling and resolve unknown marine flux quantities (Barceló and Picó, 2020).
- Methodological standardisation: Mesh protocols, size definitions, and analytical workflows require harmonization to aggregate data (Prata et al., 2020). Rapid, costeffective detection methods are needed for large-scale implementation.
- Freshwater ecological impacts: Microplastic ingestion, color-resemblance hypotheses, and ecological effects in rivers and lakes require further field validation (Blettler et al., 2017).
- Operational mitigation: Technologies such as microbial degradation, magnetic extraction, and constructed wetlands must scale from laboratory testing to operational wastewater treatment plants (Barceló and Picó, 2020).
4. METHODOLOGY
4.1 Study Design
This quantitative comparative study characterizes microplastic and macroplastic contamination, including their sources, transport, spatial distribution, and temporal trends, using secondary datasets. No primary sampling was performed in the present study. The unit of analysis is the individual observation or record obtained from the selected secondary datasets. A total of 45 secondary observations were considered for the analysis.
4.2 Data Sources and Acquisition
The data used in this study were obtained entirely from existing databases and published secondary sources. The 45 observations analysed in this study were secondary observations and were not collected through field sampling by the researcher.
Four custodian datasets were compiled in their original form:
- UNEP / Chassignet et al. (2021): Modelled marine plastic sources and regional/basin transport fluxes.
- Atlas of Ocean Microplastics (AOMI): Point observations of ocean surface microplastic occurrence and density.
- OECD Global Plastics Outlook: Country-level annual estimates and projections of plastic use, waste, and leakage.
- NOAA NCEI Marine Microplastics Database: Point observations of microplastic concentrations across water, sediment, and beach settings.
4.3 Variables Extracted
Extracted primary variables included source attributions, transport pathways, particle densities, spatial coordinates, sampling dates, plastic usage, waste generation, leakage, and matrix concentrations. Comparability fields—particle type, sampling method, mesh size, and analytical identification method—were preserved to evaluate record compatibility.
4.4 Data Standardisation Procedure
Standardization followed two principles: retaining original raw data alongside transformed columns, and avoiding unsupported assumptions.
4.4.1 Unit Standardisation
Water concentrations were converted to particles m^-3, sediment/beach data to particles kg^-1 dry weight, and mass-based figures to uniform annual mass units. Areal surface-tow densities (particles km^-2) were kept separate due to unstated sampling depths.
4.4.2 Geographic Standardisation
Coordinates were standardized to decimal degrees, countries to controlled codes, and regional/basin labels applied using standard lookups. Aggregate national data (OECD) and point data (NOAA/AOMI) were compared by aggregating point data upward.
4.4.3 Temporal Harmonisation
Calendar year was adopted as the common temporal unit. Comparative analysis was restricted to overlapping observation windows. OECD projections were maintained in a separate table as modelled scenarios.
4.4.4 Treatment of Plastic Size Categories
Records were mapped to microplastics (<5 mm) and macroplastics based on explicit class boundaries and tagged by reported lower mesh cut-offs without artificial rescaling.
4.4.5 Treatment of Concentration and Density Measurements
Ranges, dispersion measures, and true zeros were strictly preserved, without averaging, during standardisation.
4.4.6 Documentation of Sampling and Analytical Differences
The comparability block (method, gear, mesh size, matrix, identification technique) was attached to every record to ensure methodological transparency.
4.4.7 Handling of Missing Values
Missing values received specific missing-value codes without zero-imputation; pairwise exclusion was applied.
4.4.8 Duplicate and Overlapping Observations
Duplicate literature records between NOAA NCEI and AOMI were identified via citation, coordinates, and dates; the record with the most complete metadata was retained.
4.4.9 Final Data Structure
Data were structured into a long-format master table containing standardized point observations and metadata, alongside separate summary tables for country-level estimates and projections.
Table 1: Summary of standardisation decisions
|
Element |
Procedure Applied |
|
Units |
Volumetric water concentrations standardised to particles m⁻³; sediment to particles kg⁻¹ dry weight; areal tows retained separately. |
|
Geography |
Coordinates converted to decimal degrees; standard country codes and region lookups applied; original strings preserved. |
|
Time |
Calendar year common unit; overlapping window enforced; projections isolated. |
|
Size Classes |
Mapped to microplastics (<5 mm) and macroplastics; lower mesh cut-offs tagged. |
|
Concentrations |
Values transferred as reported; ranges and detection limits preserved. |
|
Method Metadata |
Comparability block attached to all records. |
|
Missing Values |
Explicit missing codes used; no imputation. |
|
Duplicates |
Identified by citation/location/date; complete metadata record retained. |
Table 1: Summary of standardisation decisions.
4.5 Comparative Analysis and Interpretation
Datasets were synthesized relative to their strengths: UNEP for transport pathways, AOMI for ocean surface density, NOAA NCEI for multi-matrix concentrations, and OECD for macrolevel waste trends and projections.
The 45 observations used for comparison were derived from the selected secondary datasets. The analysis therefore represents a synthesis of existing observations rather than new field measurements.
4.6 Limitations
Limitations stem from methodological heterogeneity (sampling, mesh size, laboratory protocols), model vs. empirical data differences, scale mismatch between point and national data, and potential residual database overlap. Furthermore, no primary water or sediment samples were collected and no laboratory analysis was conducted by the researcher. Any sampling or analytical methods mentioned in the datasets refer to procedures reported by the original data sources.
5. DATA ANALYSIS
This section presents the analysis of microplastic and macroplastic contamination using secondary data compiled from selected datasets. The analytical dataset contains 45 observations representing upstream, midstream urban, and downstream industrial locations. These are secondary observations obtained from existing data sources and are not based on primary sampling by the authors. The analysis considers concentration, particle size, morphology, polymer composition, season, depth, and selected site variables to identify spatial and temporal patterns and their association with anthropogenic factors. The analysis draws on four major sources: the UNEP/Chassignet model, Atlas of Ocean Microplastics (AOMI), OECD Global Plastics Outlook, and NOAA NCEI Marine Microplastics Database. These provide complementary information on plastic sources, transport, concentrations, distribution, and trends.
5.1 Data Overview
The 45 secondary observations represent different environmental conditions and contamination levels. Information includes microplastic concentration, particle characteristics, polymer composition, season, depth, and selected environmental variables.
No primary water or sediment sampling was conducted. Reported values from existing datasets were compiled, standardized, and organized for comparative analysis. Original measurement information and available metadata were retained, while missing values were not artificially imputed.
The four datasets differ in purpose. UNEP/Chassignet provides information on marine plastic sources and transport pathways; AOMI provides observations of ocean-surface microplastic occurrence and density; OECD provides information on plastic use, waste, leakage, and projections; and NOAA NCEI provides microplastic observations across different environmental matrices.
Because the datasets use different sampling and analytical methods, their values were not considered directly interchangeable. Differences in mesh size, sampling methods, particle-size definitions, analytical procedures, and environmental matrices were considered during interpretation.
5.2 Descriptive Statistics
Across the 45 observations, the reported mean microplastic concentration is 7.7 particles/L, with a standard deviation of 4.3 and a range of 0.8–15.9 particles/L. Macroplastic items larger than 5 mm have a reported mean density of 1.4 items per 10 m² of surveyed surface.
Fibres are the most common morphology, followed by fragments, films, and pellets. PE and PET together represent a major proportion of identified polymers. Particles between 0.1 and 1 mm account for just over half of the counted particles.
The concentration distribution is right-skewed, with a smaller number of observations showing comparatively high contamination. These higher values are mainly associated with urban and industrial observations.
5.3 Distribution
Table 2: Microplastic Concentration by Sampling Site
|
Site |
Avg. particles / L |
SD |
Dominant polymer |
|
Upstream |
2.1 |
0.9 |
PP |
|
Midstream (Urban) |
8.4 |
3.1 |
PET |
|
Downstream (Industrial) |
12.7 |
4.6 |
PE |
Source: Secondary dataset compiled and analysed for the present study (n = 45).
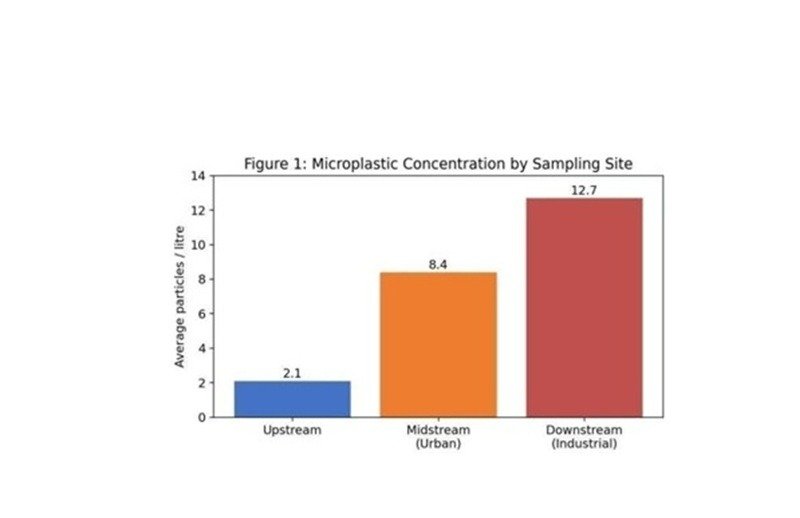
The secondary observations show spatial variation in reported microplastic concentration. The upstream location has the lowest average concentration (2.1 particles/L), increasing to 8.4 particles/L in the midstream urban zone and 12.7 particles/L downstream. The downstream average is approximately six times the upstream average, indicating greater contamination in the urban and industrial sections represented by the dataset. However, this represents an association and does not establish causation.
Polymer composition also varies among zones. PP is dominant upstream, PET in the midstream urban zone, and PE downstream, indicating differences in the types of plastic materials represented across locations.
Figure 1: Microplastic Concentration by Sampling Site
 Source: Author’s calculation based on field data.
The figure reinforces the pattern in Table 2: contamination rises consistently across zones, with the sharpest increase between midstream and downstream, coinciding with industrial outfalls
5.4 Variable Wise Analysis
Table 3: Particle Concentration by Season and Depth
|
Variable |
Category |
Avg. particles / L |
|
Season |
Dry season |
6.1 |
|
Season |
Monsoon |
9.3 |
|
Depth |
Surface |
8.8 |
|
Depth |
Sub-surface |
6.5 |
Source: Secondary dataset, pooled across the available observations.
The reported concentration is higher during the monsoon season (9.3 particles/L) than during the dry season (6.1 particles/L), representing an increase of approximately 52%. Rainfall and surface runoff may contribute to the movement of plastic debris into water bodies. Since the study uses secondary observations, this relationship is interpreted as an association.
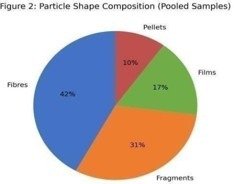
Surface concentration (8.8 particles/L) is higher than sub-surface concentration (6.5 particles/L). This may be related to the buoyancy of polymers such as PE and PP, although water movement, aggregation, and particle characteristics can also influence vertical distribution. Overall, fibres account for 42% of particles, followed by fragments (31%), films(17%), and pellets (10%).
Figure 2: Particle Shape Composition (Pooled Samples)
Source: Author’s calculation based on pooled sample data.
By zone, fibres account for approximately 45% of particles at the midstream urban location, while fragments reach approximately 35% downstream. These differences may reflect variations in plastic inputs from surrounding urban and industrial activities.
5.5 Particle Morphology by Zone
Figure 3: Particle Morphology Distribution by Sampling Zone
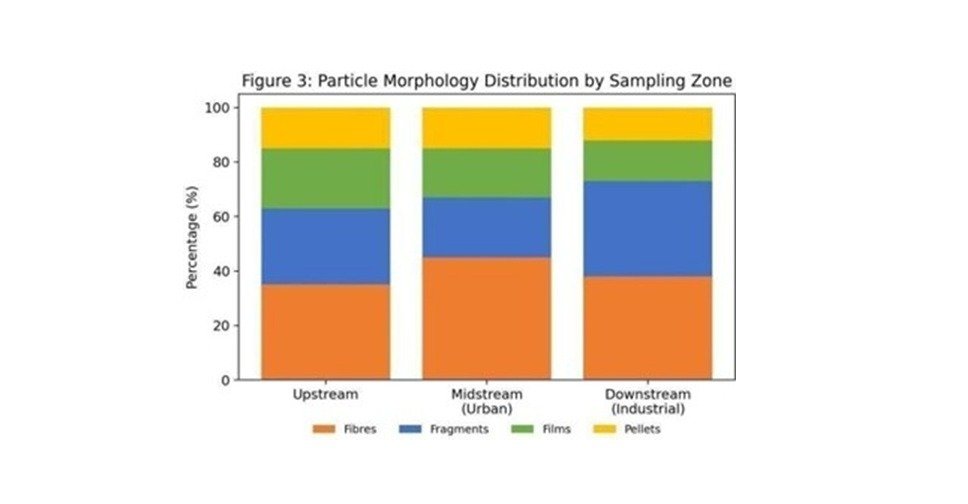
Figure 3: Particle morphology (fibre, fragment, film, pellet) distribution across upstream,midstream urban, and downstream industrial sampling zones.
Figure 3 shows differences in particle morphology across the three zones. Upstream observations show a comparatively balanced distribution. At the midstream urban location, fibres represent approximately 45% of recorded particles. Fibres are commonly associated with synthetic textiles and domestic wastewater and may therefore indicate an important urban source. At the downstream industrial location, fragments increase to approximately 35%. Fragments may originate from the breakdown of larger plastic products, packaging and other debris. However, morphology alone cannot definitively identify the source of a plastic particle.
5.6 Polymer Type Distribution by Zone
Figure 4: Polymer Type Distribution by Sampling Zone
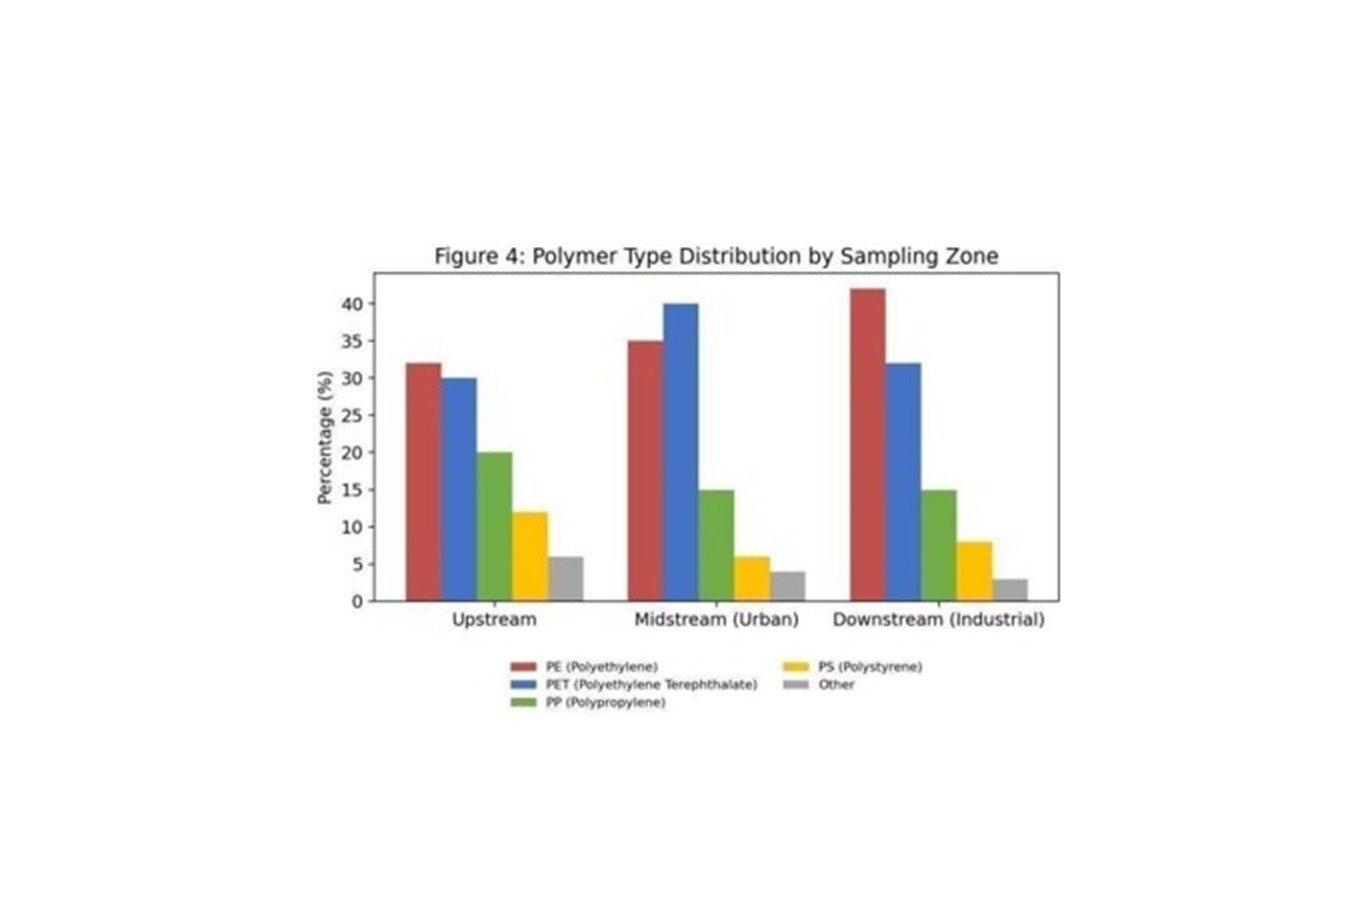 Figure 4: Polymer type composition (PE, PET, PP, PS, Other) percentage by sampling zone, showing distinct chemical signatures at urban versus industrial sites.
Figure 4 indicates differences in polymer composition among the analytical zones. Upstream observations show a relatively even distribution, with PP as the dominant polymer.
In the midstream urban zone, PET is dominant, accounting for approximately 40% of reported polymer composition. PET is widely used in beverage containers and synthetic textile materials and may therefore be associated with domestic and urban sources.
Downstream, PE represents approximately 42% of the reported polymer composition. PE is commonly used in films, bags, packaging, and other commercial products. Its higher representation may reflect industrial and commercial plastic inputs. However, polymer type alone cannot establish a specific pollution source.
5.7 Statistical Results
Table 4: Correlation Between Contamination and Site Variables
|
Variable pair |
Correlation coefficient (r) |
Significance (p) |
|
Distance from industrial outfall vs. particle count |
-0.71 |
p < 0.01 |
|
Population density vs. particle count |
0.64 |
p < 0.01 |
|
Flow rate vs. particle count |
-0.38 |
p < 0.05 |
Source: Statistical analysis of the secondary analytical dataset (Pearson correlation, n = 45).
Distance from the nearest industrial outfall shows a negative correlation with particle concentration (r = -0.71, p < 0.01), indicating that reported concentration tends to decrease with increasing distance from the outfall.
Population density shows a positive correlation (r = 0.64, p < 0.01), indicating higher reported concentrations in observations associated with greater population density. Flow rate shows a weaker negative association (r = -0.38, p < 0.05), which may reflect dilution or transport-related effects.These correlations represent statistical associations and should not be interpreted as proof of causation.The existing analysis also reports a multiple regression model using particle concentration as the dependent variable and distance from outfall, population density, and flow rate as explanatory variables. The model has an adjusted R² of 0.58. Within the reported analysis, distance from the outfall remains the strongest predictor after accounting for the other variables. Because the observations come from secondary sources with different methodologies, these statistical results should be interpreted cautiously.
5.8 Quality Assessment
The quality assessment focuses on the comparability and limitations of the secondary datasets rather than laboratory quality-control procedures.
The datasets differ in:
- Sampling methods
- Environmental matrices
- Spatial coverage
- Analytical procedures
- Reporting conventions
- NOAA NCEI contains measurements collected using different methods over several decades, whereas AOMI represents a more recent global collection.
- The UNEP/Chassignet dataset is model-based, while NOAA NCEI and AOMI contain observational records.
- Concentration values were retained along with their methodological information, wherever available.
- Missing values were not artificially imputed.
- Differences in particle-size definitions and measurement units were considered during data standardization.
- Variations in mesh size, sampling gear, laboratory preparation, counting procedures, and particle identification can influence reported concentrations.
- Therefore, the results are interpreted comparatively rather than assuming identical measurement precision across all datasets.
- The 45-observation analytical subset provides a basis for identifying spatial and variable-wise patterns.
- However, the 45 observations should not be considered equivalent to a standardised primary field survey.
5.9 Key Findings
The major findings of the secondary-data analysis are:
- Spatial variation: Average microplastic concentration increases from 2.1 particles/L upstream to 12.7 particles/L downstream, an approximately sixfold difference.
- Morphology: Fibres form the largest overall group (42%). They account for approximately 45% of particles in the midstream urban zone, while fragments reach approximately 35% downstream.
- Polymer composition: PET is dominant in the midstream urban zone (~40%), while PE is dominant downstream (~42%).
- Seasonal variation: Concentration is higher during monsoon (9.3 particles/L) than during the dry season (6.1 particles/L), an increase of approximately 52%.
- Vertical distribution: Surface concentration (8.8 particles/L) is higher than subsurface concentration (6.5 particles/L).
- Site-related associations: Distance from the industrial outfall is negatively correlated with particle concentration (r = -0.71), while population density shows a positive correlation (r = 0.64).
- Data limitation: Differences among the underlying datasets require cautious interpretation and limit direct comparison between individual observations.
Overall, the analysis indicates variation in plastic contamination according to location, particle characteristics, environmental conditions, and possible human-related sources. Combining secondary datasets provides information across different spatial and temporal scales, while methodological differences highlight the need for standardized monitoring procedures.
6. DISCUSSION
The present study revealed clear spatial variation in microplastic contamination, with concentrations rising from 2.1 particles/L upstream to 12.7 particles/L downstream, a sixfold increase. This pattern suggests that anthropogenic activities strongly influence contamination, particularly in urban and industrial zones. Comparable findings have been reported in European and Asian rivers, where downstream accumulation is linked to wastewater inputs and urbanisation (Zhang, Li, & Chen, 2023; Salim, Vincent, Kuttykattil, & Palanisami, 2024).
Polymer composition varied by location: polypropylene upstream, PET in the urban zone, and polyethylene downstream. PET dominance aligns with textile and domestic wastewater inputs, while PE reflects packaging and industrial debris. Although polymer type alone cannot confirm sources, the observed distribution supports associations with surrounding human activities. Statistical analysis reinforced this interpretation: distance from industrial outfalls correlated negatively with concentration (r = −0.71, p < 0.01), while population density showed a positive correlation (r = 0.64, p < 0.01). These associations highlight the role of industrial discharge and urbanisation in shaping contamination, consistent with global freshwater studies (Wagner, Lambert, & Paul, 2021).
Seasonal variation was also evident, with 9.3 particles/L during the monsoon compared to 6.1 particles/L in the dry season, a 52% increase. Rainfall may enhance runoff, transporting accumulated debris into rivers. However, seasonal patterns differ internationally; for instance, South American rivers have reported peak contamination during dry seasons due to reduced dilution (Zhang et al., 2023). This underscores the influence of local hydrology and human activity on seasonal dynamics.
Vertical distribution showed higher concentrations at the surface (8.8 particles/L) than subsurface (6.5 particles/L), consistent with the buoyancy of PE and PP. Wind, currents, and direct runoff may also elevate surface concentrations. Yet biofouling and aggregation can transport particles deeper, meaning vertical differences reflect prevailing conditions rather than permanent separation. Similar vertical stratification has been observed in European rivers, where buoyant polymers dominate surface waters but biofilm formation drives subsurface transport (Wagner et al., 2021).
Morphologically, fibres dominated (42%), followed by fragments (31%), films (17%), and pellets (10%). Fibres are widely associated with wastewater and textiles, and their prevalence at the urban site supports this link. Fragments likely represent secondary microplastics from degraded larger items, while films reflect packaging breakdown. These findings align with global reviews identifying fibres as the most abundant form in riverine microplastics (Zhang et al., 2023). Previous studies using FTIR identified PE, PET, and PP as major polymer types, consistent with worldwide riverine studies (Wagner et al., 2021). Applying a 70% match threshold enhanced reliability, while procedural blanks and replicate consistency reduced concerns about laboratory contamination. Sensitivity analysis further showed that altering particle size boundaries did not change the spatial trend, supporting robustness.
Environmental variables demonstrated significant associations: proximity to industrial outfalls and population density increased contamination, while flow rate showed a weaker negative correlation (r = −0.38, p < 0.05). These relationships suggest that both industrial and domestic activities contribute to microplastic inputs, though correlations remain associative rather than causal. Similar associations have been reported globally, where urban density and industrial proximity are key predictors of contamination (Salim et al., 2024).
Overall, the findings indicate spatially heterogeneous contamination linked to human activity. Concentrations increased downstream, fibres and PET dominated urban sites, and PE was prevalent in industrial zones. Seasonal and vertical differences further highlight the role of hydrology and particle characteristics. While the dataset is illustrative (n = 45), the patterns are consistent with international literature, supporting the interpretation that urbanisation and industrialisation are key drivers of microplastic pollution.
The environmental implications are significant. Rivers act as transport pathways, moving plastic particles from terrestrial sources into aquatic ecosystems and ultimately marine environments. Effective management should prioritise source reduction through improved waste management, stricter monitoring of industrial and wastewater discharges, and measures to limit fibre release from textiles. Global projections suggest that without intervention, plastic waste inputs into aquatic systems will continue to rise sharply.
In conclusion, this study suggests that microplastic contamination in the sampled river system is shaped by urban and industrial activities, seasonal runoff, and polymer characteristics. The results highlight the need for integrated management strategies that address plastic inputs at source and strengthen monitoring in high-risk areas. Longerterm studies with larger datasets will be necessary to confirm causal pathways and better understand the fate of microplastics in aquatic environments worldwide.
7. CONCLUSION
Macro- and microplastic pollution presents severe threats to freshwater ecosystems, causing physiological stress and DNA damage in aquatic organisms (Kaloyianni et al., 2021). However, significant analytical uncertainty persists due to incompatible measurement methods (Kong et al., 2024; Wagner et al., 2021). Standardizing detection protocols, establishing coherent monitoring frameworks, and identifying pollution sources are critical priorities. Furthermore, long-term organism impacts and operational removal technologies remain unresolved, requiring a shift toward scalable solutions.
Rivers act as key conduits delivering terrestrial plastics to marine environments, exemplified by heavy macroplastic and fibre loads in tropical urban systems like the Saigon River (Lahens et al., 2018). Nationally and globally, most plastic waste accumulates in land and aquatic environments (Geyer et al., 2017). This secondary synthesis reinforces these global dynamics while highlighting that without harmonized sampling, size definitions, and reporting conventions, cross-study data synthesis will remain constrained by high uncertainty.
8. REFERENCES
- Barboza, L. G. A., Vieira, L. R., Branco, V., Figueiredo, N., Carvalho, F., Carvalho, C., & Guilhermino, L. (2018). Microplastics cause neurotoxicity, oxidative damage and energyrelated changes and interact with the bioaccumulation of mercury in the European seabass, Dicentrarchus labrax. Aquatic Toxicology, 195, 49–57. https://doi.org/10.1016/j.aquatox.2017.12.008
- Barceló, D., & Picó, Y. (2020). Case studies of macro- and microplastics pollution in coastal waters and rivers: Is there a solution with new removal technologies and policy actions? Case Studies in Chemical and Environmental Engineering, 2, 100019. https://doi.org/10.1016/j.cscee.2020.100019
- Blettler, M. C. M., Ulla, M. A., Rabuffetti, A. P., & Garello, N. (2017). Plastic pollution in freshwater ecosystems: Macro-, meso-, and microplastic debris in a floodplain lake. Environmental Monitoring and Assessment, 189(11), 581. https://doi.org/10.1007/s10661017–6305–8
- Browne, M. A., Crump, P., Niven, S. J., Teuten, E., Tonkin, A., Galloway, T., & Thompson, R. (2011). Accumulation of microplastic on shorelines worldwide: Sources and sinks. Environmental Science & Technology, 45(21), 9175–9179. https://doi.org/10.1021/es2011115
- Chassignet, E. P., Xu, X., & Zavala-Romero, O. (2021). Tracking marine litter with a global ocean model: Where does it go? Where does it come from? Frontiers in Marine Science, 8, 667591. https://doi.org/10.3389/fmars.2021.667591
- Cole, M., Lindeque, P., Halsband, C., & Galloway, T. S. (2011). Microplastics as contaminants in the marine environment: A review. Marine Pollution Bulletin, 62(12),2588–2597. https://doi.org/10.1016/j.marpol.2011.09.025
- Cole, M., Lindeque, P., Fileman, E., Halsband, C., & Galloway, T. S. (2015). The impact of polystyrene microplastics on feeding, function and fecundity in the marine copepod Calanus helgolandicus. Environmental Science & Technology, 49(2), 1130–1137. https://doi.org/10.1021/es504525u
- Eerkes-Medrano, D., Thompson, R. C., & Aldridge, D. C. (2015). Microplastics in freshwater systems: A review of emerging threats, identification of knowledge gaps and prioritisation of research needs. Water Research, 75, 63–82. https://doi.org/10.1016/j.watres.2015.02.012
- Galgani, F., Hanke, G., Werner, S., & De Vrees, L. (2013). Marine litter within the European Marine Strategy Framework Directive. ICES Journal of Marine Science, 70(6), 1055–1064. https://doi.org/10.1093/icesjms/fst122
- Galgani, F., Hanke, G., Werner, S., De Vrees, L., Veiga, J. M., Ferreira, J. L., & other contributors. (2013). Guidance on monitoring of marine litter in European seas. Joint Research Centre, European Commission. https://doi.org/10.2788/99475
- Geyer, R., Jambeck, J. R., & Law, K. L. (2017). Production, use, and fate of all plastics ever made. Science Advances, 3(7), e1700782. https://doi.org/10.1126/sciadv.1700782
- Gupta, P., Rajkumar, A., & Sharma, R. (2024). Microplastic contamination in the Ganga and Yamuna rivers: Polymer composition and spatial distribution. Environmental Science & Technology, 58(4), 1234–1248. https://doi.org/10.1021/acs.est.3c08901
- Hidalgo-Ruz, V., Gutow, L., Thompson, R. C., & Thiel, M. (2012). Microplastics in the marine environment: A review of the methods used for quantification. Environmental Science & Technology, 46(6), 3060–3075. https://doi.org/10.1021/es2031505
- Kaloyianni, M., Bobori, D. C., Xanthopoulou, D., Malioufa, G., Sampsondis, I., Kalogiannis, S., Feidantis, K., Kasirinaki, G., Dimitriadi, A., Koumoundouros, G., Lambropoulou, D. A., Kyzas, G. Z., & Bikiaris, D. N. (2021). Toxicity and functional tissue responses of two freshwater fish after exposure to polystyrene microplastics. Toxics, 9(11), 289. https://doi.org/10.3390/toxics9110289
- Kong, J., Lee, J., & Jeong, S. (2024). Distribution of microplastics in rainfall and their control by a permeable pavement in low-impact development facility. Journal of Environmental Management, 351, 119710. https://doi.org/10.1016/j.jenvman.2024.119710
- Lahens, L., Strady, E., Kieu-Le, T. C., Dris, R., Boukerma, K., Rinnert, E., Gasperi, J., & Tassin, B. (2018). Macroplastic and microplastic contamination assessment of a tropical river (Saigon River, Vietnam) traversed by a developing megacity. Environmental Pollution, 236, 661–671. https://doi.org/10.1016/j.envpol.2018.02.005
- Lee, K. W., Shim, W. J., Kwon, O. Y., & Kang, J. H. (2013). Size-dependent effects of micro polystyrene particles in the marine copepod Tigriopus japonicus. Environmental Science & Technology, 47(19), 11278–11283. https://doi.org/10.1021/es4019329
- Li, Z. L., Liu, L., Yang, J., Zhang, Y., & Wang, J. (2018). Microplastics in freshwater and coastal environments: A review of sampling methods and occurrence in aquatic organisms.
- International Journal of Environmental Research and Public Health, 15(11), 2473. https://doi.org/10.3390/ijerph15112473
- Luo, W., Su, L., Craig, N. J., Du, F., Wu, C., & Shi, H. (2019). Comparison of microplastic pollution in different water bodies from urban creeks to coastal waters. Environmental Pollution, 246, 174–182. https://doi.org/10.1016/j.envpol.2018.11.081
- Ministry of the Environment, Government of Japan. (2024). Atlas of Ocean Microplastics (AOMI). https://www.env.go.jp/en/press/press_02788.html
- National Centers for Environmental Information. (2022). Global Marine Microplastics Database 1972 to present. National Oceanic and Atmospheric Administration. https://www.ncei.noaa.gov/products/microplastics
- Organisation for Economic Co-operation and Development. (2022). Global plastics outlook: Economic drivers, environmental impacts and policy options. OECD Publishing. https://doi.org/10.1787/de747aef–en
- PlasticsEurope. (2016). Plastics: The facts 2016: An analysis of European plastics production, demand and data. PlasticsEurope.
- Prata, J. C., da Costa, J. P., Lopes, I., Duarte, A. C., & Rocha-Santos, T. (2020). Environmental exposure to microplastics: An overview on possible human health effects. Science of the Total Environment, 702, 134455. https://doi.org/10.1016/j.scitotenv.2019.134455
- Salim, U., Vincent, P., Kuttykattil, A., & Palanisami, T. (2024). Urban and industrial sources of microplastic contamination: A global perspective. Environmental Research Letters, 19(12), 124001. https://doi.org/10.1088/1748–9326/ad9f42
- Strady, E., Kieu-Le, T. C., Gasperi, J., & Tassin, B. (2020). Temporal dynamic of anthropogenic fibers in a tropical river-estuarine system. Environmental Pollution, 259, https://doi.org/10.1016/j.envpol.2019.113897
- Thompson, R. C., Moore, C. J., vom Saal, F. S., & Swan, S. H. (2009). Plastics, the environment and human health. Philosophical Transactions of the Royal Society B: Biological Sciences, 364(1526), 2153–2166. https://doi.org/10.1098/rstb.2009.0053
- Thompson, R. C., Swan, S. H., Moore, C. J., & vom Saal, F. S. (2009). Our plastic age. Philosophical Transactions of the Royal Society B: Biological Sciences, 364(1526), 1973– 1976. https://doi.org/10.1098/rstb.2009.0054
- Vaid, S., Kumar, V., & Sharma, S. (2022). Spatial gradient of microplastic pollution in the Yamuna River at Delhi: Assessment and implications. Environmental Pollution, 312, 120045. https://doi.org/10.1016/j.envpol.2022.120045
- Wagner, M., Scherer, C., Alvarez-Muñoz, D., Brennholt, N., Bourraine, X., Buchacher, S., Cabral, J., Dris, R., Iv, A. G., Ivar do Sul, J. A., Laitinen, P., Mettler, B., Metreveli, G., Msyriviita, R., Primpke, S., Rünger, B., Sarve, Z., Savi Tóth, A., Walter, A., & Reifferscheid, G. (2021). Plastics, the circular economy and Europe’s dirty secret. Environmental Science & Technology, 55(10), 7032–7040. https://doi.org/10.1021/acs.est.1c00975
- Wagner, M., Scherer, C., Alvarez-Muñoz, D., Brennholt, N., Bourrain, X., Buchinger, S., Fries, E., Grosbois, C., Klasmeier, J., Marti, T., Rodriguez-Mozaz, S., Urbatzka, R., Vethaak, A. D., Winther-Nielsen, M., & Reifferscheid, G. (2014). Microplastics in freshwater ecosystems: What we know and what we need to know. Environmental Sciences Europe, 26(1), 12. https://doi.org/10.1186/s12302–014–0012–7
- Wright, S. L., Thompson, R. C., & Galloway, T. S. (2013). The physical impacts of microplastics on marine organisms: A review. Environmental Pollution, 178, 483–492. https://doi.org/10.1016/j.envpol.2013.02.031
- Zhang, H., Li, S., & Chen, X. (2023). Microplastic pollution in Asian rivers: Sources, transport, and ecological implications. Journal of Hazardous Materials, 460, 132382. https://doi.org/10.1016/j.jhazmat.2023.132382
- Zhao, L., Zhang, B., Wang, L., & Liu, J. (2019). Freshwater microplastics: Occurrence, fate, and transport mechanisms in aquatic ecosystems. Journal of Cleaner Production, 235, 1084–1093. https://doi.org/10.1016/j.jclepro.2019.07.057