Authors: Bhadra A H, Anwesha Sengupta, Aliahad Altaf Melani, Sai Malavika, Chanchal Rathee, Chennaboina Komal Sai Siddardha, Rutuja Buchewad
ABSTRACT
Plastic pollution in freshwater systems is an escalating environmental concern, with implications for ecosystem integrity, water quality, and public health. This paper reviews research on microplastic and macroplastic contamination in aquatic environments and empirically examines how plastic waste generation and economic development relate to freshwater quality in Indian states from 2016 to 2021. Using an unbalanced state-level panel of 75 observations, the study applies a fixed-effects regression model with Biological Oxygen Demand (BOD) as the dependent variable, state-level plastic waste generation as a proxy for plastic contamination, and Gross State Domestic Product (GSDP) as an indicator of economic development. The findings show a statistically significant negative association between GSDP and BOD, suggesting that higher economic development is associated with improved freshwater quality, likely through better wastewater treatment and regulatory capacity. In contrast, plastic waste generation is not significantly associated with BOD, indicating that conventional water-quality indicators such as BOD may not adequately capture the environmental effects of plastic pollution. The study highlights the need for more comprehensive monitoring frameworks, including plastic-specific indicators, and finer-grained spatial analysis to better understand the distribution and impacts of plastic contamination across Indian freshwater systems.
Keywords: Microplastics, Macroplastics, Wastewater Treatment, Drinking Water, Plastic Waste Management, Freshwater quality; Plastic waste generation.
INTRODUCTION
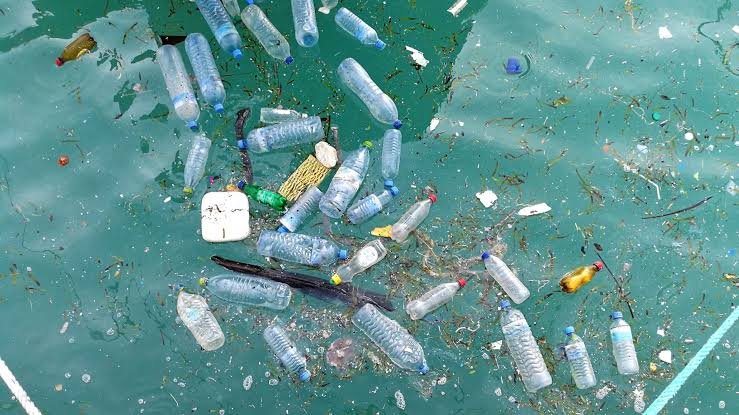
Plastic is a material that is essential in today’s society due to its light weight, durability, and low cost (Wagner et al, 2014, as cited by Yang et al, 2021). It is used widely in many industries, including packaging, construction, healthcare, agriculture, textiles, and more. But the growing amount of plastic waste accumulated and disposed of in an improper way has posed serious environmental risks globally. Every year, tons of plastic waste are dumped into rivers, lakes, groundwater, and oceans, where plastics persist for extended periods of time because they break down very slowly. The plastic pollution in aquatic environments is typically divided into macroplastics (larger than 5mm) and microplastics (smaller than 5mm).
Macroplastics are made up of larger plastic products like bottles, bags, food containers and fishing gear, while microplastics are either fragments of larger plastic products or manufacturing products like cosmetic microbeads and synthetic textile fibers. Plastic pollution in all forms pose a risk to water quality and aquatic ecosystems. Water bodies are important vectors for pollution coming from urban, industrial, and agricultural sources to larger water bodies. Plastics can end up in sediments, and then be transferred to the food chain as they travel through rivers and lakes. Plastic contamination is not just a problem, but recent studies depict that microplastic presence is indicated in groundwater and drinking water (Duan et al, 2021). These results have led to implications posed about ecological sustainability and potential human health risks.
In addition to surface water and sediments, microplastics have also been found in packaged and bottled drinking water (Marin et al, 2023), which means that direct concerns have been about human ingestion via the food chain as well as through the consumption of drinking-water-safety problems, rather than just an ecological one. Thus, the purpose of this literature review is to explore the current research on microplastic and macroplastic contamination in water bodies. It highlights the main sources of pollution, transport pathways, contamination of various aquatic environments, the effects of urban land-use and usage patterns, environmental and human health impacts, and existing management and removal strategies and identifies areas where further research is needed.
THEORETICAL FRAMEWORK
To explain the observed relationships, this study relies on three theoretical ideas-the Environmental Kuznets Curve (EKC), the source-pathway-receptor model of pollution, and the ecological sustainability/ecosystem-services paradigm. First, the EKC hypothesis suggests a particular income-environment relationship according to which environmental degradation rises until a given level of aggregate income is surpassed and begins converging downwards as income keeps growing (Grossman and Krueger, 1995). This is a reasonable explanation for the negative and statistically significant association between SGDP and BOD found in this study because the latter is a measure of organic waste and municipal sewage.
The turning point income level could be considered the threshold beyond which increased urbanization, regulatory oversight, and capital intensity counteract the polluting pressures of growth. Thus, the phenomenon driving the association between SGDP and BOD in this study aligns with the EKC in that the former partially offsets the negative implications of the latter for water quality.
Next, in terms of the source-pathway-receptor (SPR) conceptualization of pollution, the present findings indicate that the SPR in which receptor organisms are freshwater macro- and meiofauna is responsible for the association between BOD and SGDP found in this study. The fact that a similar SPR with plastics as the source, pathway, and receptor failed to show a comparable association suggests that the BOD test is only sensitive to organic waste as the receptor part of the SPR. Therefore, the lack of a similar relationship for plastic waste in this study is explained by the BOD’s insensitivity to the latter’s presence in water.
Finally, the ecological sustainability/ecosystem-services approach emphasizes the importance of freshwater bodies as regulators, providers, and supports of life and biodiversity (Millennium Ecosystem Assessment, 2005). From this viewpoint, both plastic waste and organic sewage represent stressors with varying modes of action that diminish the regulating and supporting capacity of freshwater ecosystems. Thus, with regard to the findings of this study, the EKC-driven association between SGDP and BOD fits within this theoretical framework in that both are negative influencers of freshwater ecosystem integrity. Meanwhile, the SPR framework is also compatible with the results in that both plastic waste and BOD represent three different parts of an SPR – in this case, acting as a source, pathway, and receptor. Overall, the study’s findings are compatible with all three theoretical frameworks used for this study.
REVIEW OF LITERATURE
All reviewed studies report several sources of aquatic exposure for plastics. One of the key contributors is urban areas where plastic accumulation takes place, and where municipal waste is not disposed ethically and end up dumped in water bodies through storm water run-off. Industrial production is a major source of plastic pollution, as plastic pellets, synthesis fibers and untreated discharge of wastewater with microplastic particles are released. Tourism also often contributes to excessive pollution of rivers and beaches (Varsha and Sushil, 2025). Moreover, landfill leachate has been identified as one of the major sources through which microplastic enters into solid and groundwater. The literature also lays emphasis on how macroplastic debris slowly degrades into secondary microplastic products due to long exposure to sunlight, and weathering processes.
This is depicted by a study done in the Balasore district in the coastal villages where it was found that solid waste dumping sites, landfill sites and near shipping activity areas are direct and measurable sources of microplastic pollution in surrounding aquatic ecosystems if the disposal is inappropriate. The study also confirms the presence of plastic-derived contaminants in solid waste collected from several coastal sites by using the spectroscopic characterization, foregrounding the rapid connection between shortcomings of the local solid waste management system and aquatic pollution in coastal environments. Moreover, reviews revolving around the Ganga River imply that ineffective solid waste management, agricultural runoff facilitate the transportation of microplastic pollution in of the worlds most utilized river systems (Varsha and Sushil, 2025). The outcomes of both instances collectively depict that sources of plastic pollution across smaller water bodies at the regional level are similar to those found in transboundary rivers and how the sources of microbial contamination are multiple and overlapping, and require intensive coordination and care. This poses implications on the instability which is caused in the ecosystem, because water bodies act as crucial carbon reservoirs but after contamination, these sources are hindered which increases CO2 contamination, hindering human health.
Microplastics (MP) contamination is generated from many urban sources, including urban run-off, and land use has a major influence on the distribution of MPs within watersheds. There is a consistent increase in the concentration of MPs in the vicinity of rural-urban boundaries, and MP contamination in urban freshwater systems is significantly higher than in rural systems. The pattern is due to the increasing use of plastics in cities, and the greater rates of urban plastic waste and plastic wastewater generation compared to solid waste and wastewater management capacity, which creates unique urban MP signatures. Storm sewers are an especially significant pathway for MPs from the land to the urban rivers. This was shown directly by Werbowski et al. (2021) who were able to identify substantial human driven debris in stormwater runoff, with almost 85% of the particles being fibers and black rubbery fragments which are presumably tire and road wear particles.
Another point of contamination is landfills, where MPs can be released to groundwater as a result of particles travelling large distances before reaching the subsurface systems. In addition to concerns about MP pollution in groundwater, air, and soils, disposal practices are common in urbanized areas including open burning and uncontrolled dumping.
In line with the wider literature on MP sourcing, the marine environment is a significant end-of-pipe sink for MPs, but the vast majority of MPs are sourced from the land, via plastic production, consumption and mismanagement. Vaid et al. (2024) estimated that ~80% of microplastics are from land sources. This control of the terrestrial environment is important as it highlights the central role of urbanization in MP contamination pathways because MP generated by urban activities inevitably end up in soils (resulting in succession), surface waters and importantly groundwater.
In addition to physical and environmental factors, the world’s distribution of microplastics. The density of human population and activity is closely related to contamination. Currently, the Asia region comes out as the area with the highest concentration of microplastic pollution according to literature. Also, micro-plastic pollution is more pronounced in developing countries than in Ghana’s electrical and electronic waste management practices are deemed inadequate. The waste management practices in the developed countries (Siyuan et al.,2021) indicate that the EEWMS practices in Ghana are unethical, tidal inundation and industry.
Eutrophication is the over-fertilization of lakes, rivers, ponds, and reservoirs and coastal waters by excess nutrients, especially nitrogen and phosphorus. The primary sources of these nutrients are agricultural fertilizers, untreated sewage, industry effluents, animal wastes and urban runoff. Nutrients are needed for aquatic plants and algae to grow, but too many nutrients input to aquatic ecosystems can upset the balance (Smith et al., 1999; Conley et al., 2009). Algal/cyanobacteria blooms, which are the most visible effect of eutrophication, are prevalent. These flowers prevent light from reaching submerged aquatic vegetation which causes a decrease in photosynthesis and death of aquatic plants. Algae are decomposed by bacteria which uses up a lot of the dissolved oxygen in the water as the algae decompose. This leads to hypoxic (low oxygen) or anoxic (no oxygen) areas that many aquatic organisms are unable to survive in, known as “dead-zones” (Diaz and Rosenberg, 2008). The reduction in dissolved oxygen is severely impacting the ecology. Many aquatic organisms, such as fish, molluscs, crustaceans, amphibians and others; suffer stress, growth inhibition, sterility, migration, or even death when their oxygen levels drop. Some species are more sensitive than others and they are wiped out first, followed by a few pollution-tolerant species which can survive, resulting in a drastic loss of biodiversity. A loss of biodiversity affects food chains, the relationship between predators and prey, the strength of ecosystems, and the ability of aquatic ecosystems to withstand environmental changes. HABs can also release toxins that pose hazards to fish, birds, domestic animals, wildlife, and human health either by drinking contaminated water or eating seafood contaminated by HABs (Paerl and Offen, 2013). Eutrophication also impacts ecosystem services of aquatic ecosystems. It pollutes water, creates foul smells and tastes, decreases the recreational and tourism value, makes water treatment more expensive, and harms fisheries and the local economy. Climate change can also exacerbate eutrophication through an increase in water temperature and/or changes in precipitation patterns that favor the growth of algae and the influx of nutrients to water bodies. Appropriate management of eutrophication involves reduction in the nutrient load, via better wastewater treatment and/or responsible use of fertilizers, sustainable farming practices, wetland restoration, buffer zone vegetation, regular monitoring of water quality and robust enforcement of environmental regulations. These measures will contribute to the recovery of ecological balance, water quality and aquatic biodiversity, which will be beneficial to future generations (Conley et al., 2009).
Microbial contamination is a significant problem for aquatic organisms and aquatic ecosystems. Large plastic debris and microplastics are often mistaken for food by fish, turtles, seabirds, crustaceans and other aquatic organisms. After irrigation, these plastics can clog digestive systems, interfere with nutrient uptake and lead to a false sense of fullness, which can result in starvation, stunted growth, and decreased reproductive capacity. Moreover, plastic particles can absorb toxic chemicals from the surrounding water and transfer these chemicals to the bodies of aquatic organisms. Large predators eat microplastics, and the particles are passed on through the food chain, a process known as bioaccumulation and trophic transfer. This impacts the survival and biodiversity of aquatic species, and also raises the risk to humans by eating contaminated seafood.
In addition to the threats at the individual and consumer level, plastic pollution is actively changing the ecological landscape by fundamentally altering resource availability and species behavior. Microplastics decrease the availability of uncontaminated prey and affect the quality of pristine habitats, which leads to increased resource scarcity and intraspecific and interspecific competition in aquatic environments. Intraspecific competition is intense within a species and individuals must compete for the remaining uncontaminated food or suitable nesting sites, often leading to density-dependent stress, localized starvation or lowered individual fitness. At the same time, the resource degradation distorts interspecific competition between different species sharing an ecological niche, giving the less affected species a clear competitive advantage, leading to dramatic changes in population dynamics and the overall structure of the food web (Yildiz et al., 2022).
To fully understand the broader issue of plastic pollution, researchers need to take into account the ecological feedback and human socioeconomic indicators by comparing a biological indicator such as the Mussel Condition Index with a macroeconomic indicator such as the Human Development Index. The Mussel Condition Index is a measure of structural changes and health effects within an ecosystem, as filter-feeding bivalves absorb microplastics, their energy is redirected to detailing with the toxicity of the microplastics, providing a precise, biological warning of localized food web degradation (Bajt, 2021). The HDI, on the other hand, is a comprehensive measure of a country’s health, education and living standards. The HDI, when combined with pollution data, exposes a socio-economic paradox; high HDI countries have more waste management infrastructure, but their high consumption patterns have historically produced vast amounts of micro and nanoplastic waste that have crossed borders to disproportionately affect the food security, public health, and seafood-dependent economies of developing regions (UNDP,2024; Valencia-Marin et al., 2023). The human development indicator highlights the systematic, global inequality of the Anthropocene, showing that planetary pollution and human progress are in a zero-sum game, with environmental degradation directly threatening long term human security and global well-being.
RESEARCH GAP
Current research on microplastic and macroplastic pollution in Indian freshwater systems mainly investigates determining the pathways of plastics and their environmental concentrations, as well as legal frameworks and technical mitigation options. The works speak on sources like regular consumption, wastewater, industry, tourism, religions and more. Further, they highlight progressive policy instruments like the Plastic Waste Management Rules, banning single-use plastic, removal technologies, etc. Yet, the social and governance aspects of microplastic risk specifically, how waste and wastewater infrastructures, policies, and exposure risks differ across regions and social groups remain weakly studied through systematic quantitative analysis. This is despite recurrent qualitative references to inequality and informal sector marginalization and under-researched geographies such as small towns, peri-urban areas, and Himalayan catchments. This study applies secondary data analysis to existing national datasets to impact of plastic waste generation and economic growth on fresh water quality in Indian states from 2016 to 2021. The study empirically documents how microplastic risks and mitigation capacities are unevenly distributed across Indian contexts. The analysis aims to fill a gap in our understanding of the extent of the world’s most plastic-polluted country, as per volume of plastic waste generated.
The study period of 2016-2021 is chosen because consistent, comparable state-level data on BOD, plastic waste generation and GSDP are available for these years from CPCB and MoSPI, allowing construction of a balanced panel. This interval also coincides with major developments in Indian plastic-waste governance, including the implementation and revision of the Plastic Waste Management Rules and rising public concern about microplastic contamination, making it analytically relevant for examining links between economic activity, plastic waste and freshwater quality. Using multiple consecutive years enables the model to capture short-run within-state dynamics rather than relying on a single cross-section.
RESEARCH OBJECTIVE
1. To investigate the impact of plastic waste generation and economic growth on fresh water quality in Indian states from 2016 to 2021.
RESEARCH QUESTION
1. What is the impact of plastic waste generation and economic growth on fresh water quality in Indian states from 2016 to 2021?
METHODOLOGY
Building on the patterns and gaps identified in the literature review, the methodology sets out the empirical fixed-effects panel-data design used to analyze state-level BOD, plastic waste and GSDP. The study is based on secondary data collected for Indian states over the selected study period. Data on Biological Oxygen Demand (BOD), which serves as the indicator of water quality, are obtained from the Central Pollution Control Board (CPCB), while data on Gross State Domestic Product (GSDP) and plastic waste generation are compiled from the Ministry of Statistics and Programme Implementation (MoSPI). A fixed-effects panel model is employed because Indian states differ systematically in hydrological conditions, industrial composition, policy enforcement and institutional capacity, which are difficult to observe directly but are relatively stable over time. By allowing each state to have its own time-invariant intercept, the fixed-effects specification controls for this unobserved heterogeneity and focuses on how changes in plastic waste generation and economic activity within states over 2016-2021 are associated with changes in freshwater quality (BOD). In the Indian context, it is unlikely that such state-specific characteristics are uncorrelated with economic growth or waste generation, making the assumptions of random-effects and pooled OLS less plausible than those of a fixed-effects model. Model comparison tests (e.g. Hausman, Durbin Watson, etc.) support the use of fixed effects over random effects, indicating that coefficients differ systematically when unobserved state effects are treated as uncorrelated. Descriptive statistics are first used to summarize the data and identify broad trends. This is followed by the estimation of the fixed effects regression model, along with relevant diagnostic tests to assess issues such as multicollinearity and to ensure the robustness of the empirical results. The findings are then interpreted to examine the relationship between plastic waste generation, economic growth, and water quality across Indian states.
Model assumptions
This analysis relies on a linear fixed-effects panel regression linking Biochemical Oxygen Demand (BOD) to state-level plastic waste generation, Gross State Domestic Product (GSDP), and time-varying controls, under several standard assumptions. First, the relationship between BOD and the explanatory variables is assumed to be linear and additive, so that effects are constant at all levels of the regressors and interaction or threshold dynamics are not explicitly modelled. Second, time-invariant state-specific factors that influence water quality – such as geography, river systems, long-standing industrial structure, and institutional capacity – are assumed to be constant over the study period and are captured by the fixed effects, which control for unobserved heterogeneity across states. Third, identification relies on sufficient within-state variation in BOD, plastic waste generation, and GSDP over time, a condition supported by the descriptive statistics that show substantial dispersion and non-constant variation in these variables. Finally, the idiosyncratic error term is assumed to have zero mean and to be uncorrelated with the regressors conditional on the fixed effects; robust, cluster-adjusted standard errors are used to mitigate concerns about heteroskedasticity and serial correlation in the panel errors.
Limitations of the model and data
Several limitations qualify the interpretation of the results. First, BOD is a standard indicator of organic pollution and freshwater quality but does not fully capture the physical and chemical pathways through which plastic pollution affects aquatic ecosystems, which may help explain the absence of a statistically significant association between plastic waste and BOD in the fixed-effects estimates. Second, the panel is unbalanced, with 75 state-year observations for 19 states over a maximum of five years, and the relatively short study period of 2016-2021 may not be sufficient to capture long-term structural changes in infrastructure, governance, or pollution dynamics. Third, the analysis is conducted at the aggregate state level, which inevitably obscures intra-state variation between urban and rural catchments, industrial corridors and less-developed regions, and upstream and downstream segments. Fourth, the current specification omits potentially important determinants of water quality, such as population density, degree of urbanisation, rainfall and hydrological events, industrial effluent loads, and the coverage and performance of sewage treatment infrastructure, which are identified as priorities for future research.
Possible sources of bias
Within this framework, the estimates may still be affected by several sources of bias. Omitted-variable bias remains a concern, as unobserved time-varying factors – for example, changes in regulatory enforcement, informal waste-picking and recycling activities, or sudden policy interventions may influence both economic activity, plastic waste generation, and BOD levels. Measurement error in the state-level plastic waste series, particularly under-reporting of informal or illegal dumping and differences in reporting practices across states, could attenuate the estimated effect of plastic contamination on BOD. Endogeneity is also possible: economically stronger states may both invest in wastewater treatment and monitoring and improve data quality, generating a non-causal association between higher GSDP and lower observed BOD. In addition, missing or unreliable data for particular states and years result in an unbalanced sample; if these gaps are systematically related to environmental performance or administrative capacity, sample-selection bias may arise. Taken together, these limitations mean that the findings should be interpreted as indicative of associations rather than definitive causal effects, and they underscore the value of extending the analysis with richer datasets, alternative water-quality indicators, and complementary research designs in future work.
DATA ANALYSIS

This study employs a Fixed Effects panel regression model to examine the association between Biochemical Oxygen Demand (BOD), State Gross Domestic Product (SGDP), and plastic contamination across 19 Indian states. Biological Oxygen Demand (BOD) is used as the dependent variable because it is a standard indicator of organic pollution and freshwater quality in Indian monitoring frameworks and CPCB reporting. State-level plastic waste generation captures the scale of mismanaged plastic inputs into terrestrial and aquatic environments and serves as a proxy for broader waste-management performance, even though plastics affect water quality through physical and chemical mechanisms that are not fully reflected in BOD. Gross State Domestic Product (GSDP) is included as a measure of economic development and industrial activity, recognizing that higher levels of development can both intensify pollution (through industrialization, urbanization) and improve water quality (via investments in wastewater treatment, solid-waste infrastructure and regulatory capacity).
The dataset is unbalanced and consists of 75 state-year observations spanning a maximum period of five years. The Fixed Effects specification was selected on the basis of the F-test, the Breusch-Pagan LM test, and the Hausman test, all of which indicated that it is the most appropriate model for the data.
The model is statistically significant overall, with an F-statistic of 3.302 and a p-value of 0.044, suggesting that the explanatory variables jointly influence BOD after controlling for state-specific fixed effects. The Within R² value of 0.109 indicates that the model explains approximately 10.9 percent of the within-state variation in BOD. Although this explanatory power is limited, such results are not unusual in environmental studies, where water quality is shaped by a wide range of physical, climatic, and institutional factors not fully captured in the model.
SGDP is negatively associated with BOD, with a coefficient of -0.000229. This relationship is statistically significant, as shown by a t-value of -2.272 and a p-value of 0.027. The result suggests that higher economic output at the state level is associated with lower BOD levels, implying improved water quality. One plausible explanation is that economically stronger states may have greater capacity to invest in wastewater treatment infrastructure, pollution control mechanisms, and environmental regulation.
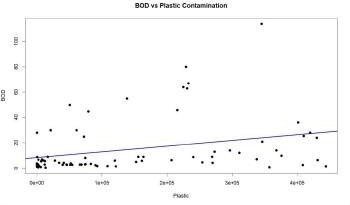
Plastic contamination, by contrast, also has a negative coefficient (-0.000006), but the relationship is not statistically significant, with a t-value of -0.292 and a p-value of 0.771. Accordingly, the study does not provide sufficient evidence to conclude that changes in plastic contamination are associated with changes in BOD once state-specific effects and SGDP are controlled for. This finding should be interpreted cautiously, since BOD measures biodegradable organic pollution, whereas the environmental effects of plastic pollution may operate through pathways not directly reflected in BOD.
The Fixed Effects estimator accounts for time-invariant state characteristics such as geography, river systems, historical industrialization, and institutional quality. As a result, the coefficients capture within-state variation over time rather than cross-state differences. This approach reduces omitted variable bias arising from unobserved state-level characteristics that remain constant during the study period.
The model selection process further supports this specification. The F-test rejected the pooled OLS model, indicating the presence of significant state-specific effects. The Breusch-Pagan LM test confirmed that panel estimation is preferable to pooled regression. The Hausman test rejected the Random Effects model, demonstrating that the Fixed Effects estimator is both consistent and appropriate.
These findings suggest that economic development is associated with improvements in water quality, as measured by BOD. At the same time, the absence of a statistically significant relationship between plastic contamination and BOD does not imply that plastic pollution is environmentally insignificant; rather, it indicates that BOD may not adequately capture its effects. Future research could incorporate additional explanatory variables such as rainfall, population, urbanization, industrial discharge, and sewage treatment capacity, or employ alternative water quality indicators, to develop a more comprehensive understanding of the determinants of water pollution.

Data Analysis of Descriptive Statistics
The analysis is based on an unbalanced panel dataset comprising 75 observations from 19 Indian states over a period of up to five years. The mean BOD is 14.84 mg/L, with values ranging from 0.50 mg/L to 114.00 mg/L, indicating substantial variation in water quality across states and across time. The median BOD is 6.00 mg/L, which is well below the mean, suggesting a positively skewed distribution in which a small number of very high observations elevate the average.
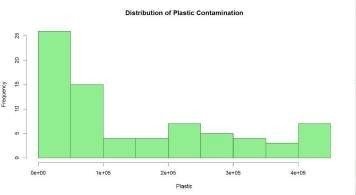
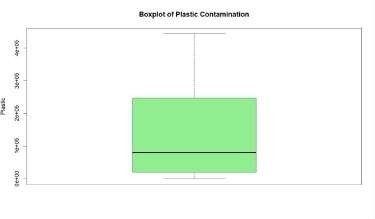
Plastic contamination shows a mean value of 144,604 units and a range from 24 to 443,724, reflecting considerable variation in plastic waste generation across the sampled states. Its median value, 79,115, is lower than the mean, indicating a right-skewed distribution and the presence of a few states with substantially higher contamination levels.
The mean SGDP is 141,275, with values ranging from 34,045 to 355,798, demonstrating pronounced differences in economic performance among the states included in the sample. The median SGDP, 138,299, is close to the mean, suggesting a relatively more balanced distribution than that observed for BOD and plastic contamination. The difference between the first and third quartiles for all variables indicates moderate to substantial dispersion, confirming adequate variability for panel regression analysis.
Overall, the descriptive statistics reveal marked heterogeneity among Indian states with respect to water quality, plastic contamination, and economic development. This pattern supports the use of a Fixed Effects panel model, since it helps control for unobserved state-specific characteristics that may influence the dependent variable.
POLICY IMPLICATIONS AND DIRECTIONS FOR FUTURE RESEARCH
The findings of this study have several implications for water quality management in India. First, the association between SGDP and BOD found in this study suggests that ongoing efforts to build wastewater treatment and regulatory infrastructure are a worthwhile area of investment for the Indian economy, especially among low-income states. The investment should be directed towards these states more intensely than in high-income states because the empirical regularity associated with the EKC hypothesis has not manifested beyond the level of aggregate income.
In other words, the improvements in water quality observed thus far under the rising income levels in India are primarily the result of investment in treatment works and oversight capacity. Therefore, these factors should be priorities for Indian policymakers even as their overall economic development continues. With regard to another key finding of this study, the lack of an association between plastic waste and BOD suggests that the current suite of water-quality indicators, notably those used by CPCB, is not fit for measuring the cumulative impact of plastics on freshwater ecosystems. The same applies to the policy-relevance of the findings in terms of the spatial analysis conducted at the level of India’s states.
With regard to this study’s limitations discussed earlier, future water-quality assessments should attempt to collect more data at the municipal level, especially in smaller urban centers and mountainous areas. This would allow for more nuance in policy design, namely in terms of differentiated approaches to waste management at various geographic levels. Additionally, future studies expanding upon the findings detailed in this article should endeavour to include other variables beyond the ones used in this study when building regression models.
The next step in this line of research would be to utilize water-quality indicators beyond BOD, including those related to microplastics (e.g., presence and abundance), to fully capture the impact of plastics on freshwater ecosystems. Finally, the timeframe of this study could be expanded to include more years of observations while also balancing the number of high- and low-income states included.
These recommendations emanate from this study’s findings and limitations and, accordingly, have important policy implications. The former suggests that economic development is a lever of indubitable importance to freshwater ecosystem integrity in India. However, the findings also indicate that the current policy tools to manage the threat posed by plastic waste (notably, BOD testing) are inadequate in terms of capturing the cumulative impact of plastics on freshwater ecosystems. Therefore, it is crucial for future assessments to use a more comprehensive set of water-quality indicators, some of which should pertain specifically to plastics. Additionally, the findings suggest that future assessments should utilize a more fine-grained spatial lens when analysing municipal plastic waste management and its implications for freshwater ecosystem integrity.
REFERENCES
- Bajt, (2021). From plastics to microplastics and organisms. FEBS Open Bio, 11(9), 954-966. https://doi.org/10.1002/2211-5463.13120
- Belioka, P., & Achilias, D. S. (2024). How plastic waste management affects the accumulation of microplastics in waters: A review for transport mechanisms and routes of microplastics in aquatic environments and a timeline for their fate and occurrence. Water Emerging Contaminants, 2024. https://www.oaepublish.com/articles/wecn.2024.09?to=comment
- Bulletin of the National Research (2024). Effect of inappropriate solid waste on microplastic contamination in Balasore district and its aquatic environment. Bulletin of the National Research Centre, 2024. https://link.springer.com/article/10.1186/s42269-024-01278-z
- Carr, A., Liu, J., & Tesoro, A. G. (2016). Transport and fate of microplastic particles in wastewater treatment plants. Water Research, 2016. https://www.sciencedirect.com/science/article/abs/pii/S0043135416300021
- Central Pollution Control (n.d.). CPCB. https://cpcb.gov.in/
- Conley, J., Paerl, H. W., Howarth, R. W., Boesch, D. F., Seitzinger, S. P., Havens, E., & Morgan, E. J. (2009). Controlling eutrophication: Nitrogen and phosphorus. Science, 323(5917), 1014-1015. https://www.researchgate.net/publication/216768923_Controlling_Eutrophication_Nit rogen_and_Phosphorus
- Diaz, J., & Rosenberg, R. (2008). Spreading dead zones and consequences for marine ecosystems. Science, 321(5891), 926-929. https://pubmed.ncbi.nlm.nih.gov/18703733/
- Duan, , Zhao, Y., & Wang, J. (2021). Weathering of microplastics and interaction with other coexisting constituents in terrestrial and aquatic environments. Water Research, 196, 117011. https://doi.org/10.1016/j.watres.2021.117011
- Dusaucy, , Gateuille, D., Perrette, Y., & Naffrechoux, E. (2021). Microplastic pollution of worldwide lakes. Environmental Pollution, 2021. https://www.sciencedirect.com/science/article/abs/pii/S0269749121006576
- Grossman, M., & Krueger, A. B. (1995). Economic growth and the environment. The Quarterly Journal of Economics, 110(2), 353-377. https://doi.org/10.2307/2118443
- Horton, A., & Dixon, S. J. (2018). Microplastics: An introduction to environmental transport processes. WIREs Water, 2018. https://wires.onlinelibrary.wiley.com/doi/abs/10.1002/wat2.1268
- Hossain, M. B., Yu, J., Banik, P., Noman, M. A., Nur, A.-A. U., Haque, M. R., Rahman, M., Albeshr, M. F., & Arai, T. (2023). First evidence of microplastics and their characterization in bottled drinking water from a developing country. Frontiers in Environmental Science, 2023. https://www.frontiersin.org/journals/environmental-science/articles/10.3389/fenvs.2023.1232931/full
- Marin, M., Castro-Rodríguez, A., & Cortina-Januchs, G. (2023). Micro- and nanoplastics current status: Legislation, gaps, limitations and socio-economic prospects for future. Frontiers in Environmental Science, 11, 1241939. https://doi.org/10.3389/fenvs.2023.1241939
- Millennium Ecosystem Assessment. (2005). Ecosystems and human well-being: Synthesis. Island Press. https://www.researchgate.net/publication/297563785_Millennium_Ecosystem_Assess ment_Ecosystems_and_human_well-being_synthesis
- Ministry of Statistics and Programme (n.d.). MoSPI. https://www.mospi.gov.in/
- Nene, A., Sadeghzade, , Viaroli, S., Yang, W., Uchenna, U. P., Kandwal, A., Liu, X., Somani, P., & Galluzzi, M. (2025). Recent advances and future technologies in nano-microplastics detection. Environmental Sciences Europe, 2025. https://enveurope.springeropen.com/articles/10.1186/s12302-024-01044-y
- Padervand, , Lichtfouse, E., & Robert, D. (2020). Removal of microplastics from the environment: A review. Environmental Chemistry Letters, 2020. https://link.springer.com/article/10.1007/S10311-020-00983-1
- Paerl, W., & Otten, T. G. (2013). Harmful cyanobacterial blooms: Causes, consequences, and controls. Microbial Ecology, 65(4), 995-1010. https://pubmed.ncbi.nlm.nih.gov/23314096/
- Singh, K., Singh, A., Srivastava, A. K., Chauhan, R., Basniwal, R. K., & Chauhan, (2025). Microplastic pollution in the Ganga River: A state-of-the-art review of pathways, mechanisms, and mitigation. Water Supply, 25(2), 249. https://iwaponline.com/ws/article/25/2/249/107037/Microplastic-pollution-in-the-Ganga-River-A-state
- Smith, H., Tilman, G. D., & Nekola, J. C. (1999). Eutrophication: Impacts of excess nutrient inputs on freshwater, marine, and terrestrial ecosystems. Environmental Pollution, 100(1-3), 179-196. https://www.sciencedirect.com/science/article/abs/pii/S0269749199000913
- The Urban Footprint on Aquatic Ecosystems: Comparison of microplastic dynamics in water bodies with divergent usage patterns. (2026). Aquatic Sciences, 2026. https://link.springer.com/article/10.1007/s00027-026-01295-2
- United Nations Development Programme. (2024). Human Development Report 2023/2024: Breaking the gridlock: Reimagining cooperation in a polarized UNDP. https://hdr.undp.org/content/human-development-report-2023-24
- Valencia-Marín, , Castro-Rodríguez, A., & Cortina-Januchs, G. (2023). Micro- and nanoplastics current status: Legislation, gaps, limitations and socio-economic prospects for future. Frontiers in Environmental Science, 11, 1241939. https://doi.org/10.3389/fenvs.2023.1241939
- Viaroli, S., Lancia, M., & Re, V. (2022). Microplastics contamination of groundwater: Current evidence and future perspectives. A review. Science of The Total Environment, 2022. https://www.sciencedirect.com/science/article/abs/pii/S0048969722009433
- Werbowski, L. M., Bittner, R. , Williams, N. N., & Burch, M. L. (2021). Urban stormwater runoff: A major pathway for anthropogenic particles, black rubbery fragments, and other types of microplastics to urban receiving waters. ACS ES&T Water, 1(6), 1420-1428. https://doi.org/10.1021/acsestwater.1c00017
- Yang, , Zhang, Y., & Liu, J. (2022). A comparative review of microplastics in lake systems from different countries and regions. Chemosphere, 286, 131806. https://doi.org/10.1016/j.chemosphere.2021.131806
- Yıldız, , Yalçın, G., Jovanović, B., Boukal, D. S., Vebrová, L., Riha, D., Stanković, J., Savić-Zdraković, D., Metin, M., Akyürek, Y. N., Balkanlı, D., Filiz, N., Milošević, D., Feuchtmayr, H., Richardson, J. A., & Beklioğlu, M. (2022). Effects of a microplastic mixture differ across trophic levels and taxa in a freshwater food web: In situ mesocosm experiment. Science of The Total Environment, 836, 155407. https://doi.org/10.1016/j.scitotenv.2022.155407
- Varsha, & Singh, K. (2025). Seasonal dynamics of microplastic pollution in the River Ganga: A case study from Bihar. International Journal of Plant and Environment, 11(1), 205-212. https://doi.org/10.18811/ijpen.v11i01.22
APPENDIX