Authors: Huma Khan , Kritika Khorwal , Refah Sohail , Sanchi Gaikwad , Shikha Rai , Shruti Adhav, Soumya Donawade
Abstract
Plastic pollution has become one of the primary environmental hazards in aquatic ecosystems, with micro- and macroplastics being frequently detected in water environments. Indian aquatic ecosystems are particularly vulnerable to increased levels of plastic pollution because of insufficient waste management, high levels of plastic consumption and urbanization, and seasonal river flooding. Despite the number of studies concerned with microplastics, macroplastics, their fragmentation, and pollution indices, there is a lack of comprehensive data on the sources, patterns, and impacts of plastics. This study aims to analyze the current state of plastic contamination of India’s freshwater and coastal waters through the synthesis of prior original research. The review covers studies of freshwater and coastal aquatic systems across India, with recent evidence and datasets primarily covering the period from 2016 to 2026.
The study incorporates qualitative review and synthesis of published articles concerned with the prevalence of plastics in environmental samples. Additionally, the current study employs quantitative comparison of the abundance of plastics, polymer composition, and pollution and hazard indices across the reviewed studies. The review identified the factors affecting the distribution of plastics in India’s water environments, as well as the major types of plastics that constitute the threat. Fibres and fragments were found to be the most prevalent types of plastic particles in India’s aquatic environments, while macroplastic debris was suggested to be a major source of secondary plastics. Furthermore, the review found that natural sediment serves as a major reservoir of microplastics.
The comparative analysis revealed discrepancies in polymer abundance, size, and isolation procedures across the reviewed studies, which complicate quantitative comparisons of plastic pollution. Hazard indices were found to differ significantly from pollution indices because of differences in the abundance of various polymer types across different studies. In conclusion, the review highlighted research gaps in India’s aquatic environments, including the identification of sources, monsoon season effects, macroplastic fragmentation, standardization of analytical procedures, and human health impact assessment.
The findings of this study contribute to the existing body of knowledge by summarizing the characteristics of plastic pollution in India’s aquatic environments.
Keywords:
Microplastics; Macroplastics; Plastic Contamination; Indian Aquatic Systems; Transport Pathways; Detection and Characterization; Methodological Standardization
1. Introduction
Water is necessary for all life forms and an essential element for a sustainable aquatic environment. Yet, there has been increased pressure on water due to human activities and fast growth in industry and technology. One of the latest environmental issues is plastic pollution that endangers both freshwater and marine ecosystems. The mass production of plastics began after World War II and now they are inseparably connected with our life as plastics are widely used in various industries like medicine, aerospace engineering, automotive and water purification. Nevertheless, their extensive production and misuse caused huge amount of pollution in the aquatic environment.
Every year around 14 million tons of plastic are disposed into the oceans thus causing pollution and endangering aquatic organisms from ingestion and entanglement (Jaikumar et al., 2024). Plastics are presently so pervasive that they may function as notable techno-fossils, mirroring the enduring impact of human activities on the planet. Their continued accumulation in rivers, lakes, seas, and coastal settings has rendered plastic pollution a profound ecological crisis, comparable to climate change in terms of its potential effects on biodiversity and human health (Blettler et al., 2017).
Plastics have become the driving force behind modern society, offering unmatched functional properties at a relatively low cost. With a population exceeding 1. 2 billion; India has emerged as one of the world’s leading consumers of plastic. However; due to inadequate infrastructure and management; 40% of the country’s 9. 4 million tonnes of annual plastic waste ends up in the environment (Vanapalli et al., 2021)). Various research studies have reported that inland waters in India are highly susceptible to plastic pollution.
Plastics are synthetic materials and are ubiquitous in daily human life as the most versatile synthetic product: Over the past five decades, global plastic production has surged dramatically, reaching as high as 300 million tons. In the Anthropocene epoch, inefficient solid waste management has led to a manifold increase in plastic production, ushering in what is termed a “plastic era’ Bharath et al.)., 2021).
The Indian plastics sector has experienced exponential growth. According to the 2014 FICCI report; the western region is the largest consumer of plastics, accounting for 47% of total consumption. According to the Centre for Science and Environment (201%).
India’s per capita plastic consumption is estimated at 11 kilograms per year: Thus, this adds to the 26 million tons of plastic waste generated in the country (Law et al.), 2020).
The weathering and degradation of plastic waste produce microplastics, a phenomenon that has been the subject of extensive research by numerous scientists.
According to the study by Ajith et al. since 2010, research on MPs in India has intensified, yet given their significant ecological threats, further exploration is still required. Currently, microplastics (MPs) have infiltrated aquatic ecosystems, posing a threat to aquatic organisms through ingestion and functional disruption, while also contributing to soil degradation. They may enter the food chain through trophic transfer and pose a hazard to humans as a potential source of ingestion or inhalation. MPs tend to accumulate hazardous pollutants, including heavy metals, pesticides, and pathogens (Vaid et al. 2021).
Despite extensive research on plastic pollution significant knowledge gaps remain regarding freshwater systems in India. First, although the majority of freshwater research focuses on microplastics; there is significant gap in knowledge regarding macroplastics, their transport mechanisms, and their role in generating secondary microplastics. Second, although studies exist regarding the sources of plastics, detailed information on how to apportion these sources remains scarce. Third, the mechanisms by which plastics fragment under monsoonal conditions remain poorly understood. Fourth; the lack of reporting on advanced analytical techniques for characterizing plastics in freshwater systems hinders the ability to compare studies. Fifth; although further research is needed to determine plastic abundance across various regions, studies evaluating the impact of these plastics on the environment and human health remain scarce.
To address these challenges, the main objective of this study is to synthesize and compare existing evidence on microplastic and macroplastic contamination in Indian aquatic systems. The study aims to examine their abundance, distribution, and composition; compare the sampling and identification methods used across studies; and identify major research gaps related to plastic sources, transport, fragmentation, and potential environmental and human health impacts.
To address these objectives, the study poses a central research question:
What are the occurrence patterns, methodological variations, and key research gaps in micro- and macroplastic contamination across Indian aquatic systems?
The study employs a critical synthesis research design combining a qualitative literature review with a quantitative comparative approach. The information from the reviewed studies is organized and compared based on plastic abundance, composition, hazard indices, and the methodologies used, providing an overview of the available evidence and key differences across studies.
2. Literature Review
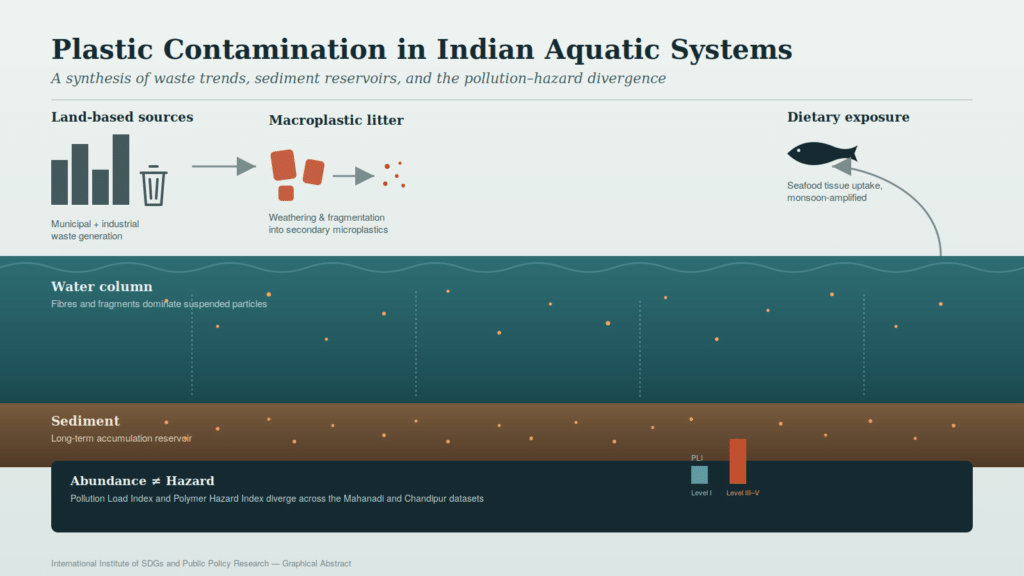
Three findings recur consistently across the studies reviewed here. Fibres and fragments dominate recovered microplastic samples regardless of water body type, appearing at proportions as high as 91% in Ganges surface water (Napper et al., 2021) and as the leading particle type in the Mahanadi estuary (Patidar et al., 2023). Sediment functions as a long-term accumulation zone, consistently carrying higher concentrations than the water column above it (Patidar et al., 2023; Laju et al., 2022). Abundance-based and hazard-based pollution metrics also frequently diverge. Patidar et al. (2023), for example, reported a low overall pollution-load score while some individual polymers were rated at maximum toxicity, showing that particle count alone may not fully represent environmental risk. This evidence indicates that the distribution of microplastics is dependent on both their physical properties as well as environmental factors. However, variation in sampling sites, seasonality, and analytical techniques makes it hard to compare data from various studies. Such methodological variations are a significant limitation in understanding plastic pollution in India.
Researchers broadly agree that population density, tourism, fishing activity, and monsoon timing influence where and how much plastic accumulates (Vanapalli et al., 2021; Neelavannan & Sen, 2023). However, regional patterns are not always consistent. Southern rivers generally show higher sediment-bound plastic concentrations than northern rivers, whereas high-altitude Himalayan lakes may carry higher loads than southern lakes ( Neelavannan & Sen, 2023) and the field still lacks shared sampling and analytical protocol which limits how directly any two studies can be compared (Neelavannan & Sen, 2023).
Collectively, the literature establishes that microplastic contamination in Indian water bodies is widespread and geographically variable, while also indicating a connection between macroplastic disposal and the formation of smaller plastic particles (Liro et al., 2023; Mladenov et al., 2025; Youngblood et al., 2022). However, a methodologically consistent evidence base combining macroplastic and microplastic contamination, detection, and risk remains limited.
2.1 Classification, Sources, and Production of Plastics
Plastics are synthetic polymers valued for durability, low cost, and resistance to degradation, properties that also make them persistent environmental contaminants once discarded (Thompson et al,, 200%). Global production has risen nearly 200-fold since 1950, reaching 335 million tonnes annually by 2017 (PlasticsEurope, 2018), with a substantial share disposed of improperly and entering aquatic systems through informal dumpsites and inadequate waste infrastructure (Barnes et al,, 200%).
Within aquatic environments, plastic debris is conventionally classified by size into macroplastics (greater than 5 mm) and microplastics (less than 5 mm), reflecting differences in how each fraction behaves, persists, and is detected Barnes et al,, 200%; Thompson et al,, 200%). A second, origin-based classification distinguishes primary microplastics, manufactured at microscopic scale for cosmetics and personal-care products, from secondary microplastics, which form through the mechanical, photolytic, chemical, and biological breakdown of larger items over time (Veerasingam et al., 2020). This distinction matters analytically: primary and secondary microplastics imply different intervention points, the former addressable through product-level regulation and the latter requiring macroplastic litter management further upstream:
The link between macroplastic litter and the microplastics it eventually becomes is addressed only indirectly by most of the literature, which tends to describe macroplastic sourcing in general terms without offering the sizefractionated litter counts needed to compare macroplastic input directly against downstream microplastic datasets. Youngblood et al. (2021) have described substantial plastic debris pollution in Indian and Bangladeshi locations, with plastics making up 75.0–87.7% of total recorded debris and being predominantly represented by packaging materials. Napper et al. (2021) and Patidar et al. (2023), on the other hand, describe fibres and fragments as the most common types of microplastics in the Ganges and Mahanadi. In combination, these data indicate that macroplastic debris, such as low-durability plastic packaging materials, may break down into smaller microplastics due to weathering and fragmentation.
Direct observation regarding the relationship between macroplastic fragmentation and microplastic accumulation downstream in Indian waters is still scarce. This is significant since establishing such a relationship is key to understanding the dynamics of plastic waste pollution in aquatic environments. Direct observation regarding the relationship between macroplastic fragmentation and microplastic accumulation downstream in Indian waters is still scarce. This is significant since establishing such a relationship is key to understanding the dynamics of plastic waste pollution in aquatic environments.
Quantitative fragmentation-rate data exist, though not yet for Indian conditions specifically. Liro et al. (2023) established that a macroplastic item’s breakdown rate depends primarily on polymer type, surface area-to-mass ratio, and prior weathering, with polystyrene fragmenting fastest and polyethylene, polypropylene, and PET considerably more resistant: Mladenov et al. (2025) directly measured fragmentation-rate constants for riparian litter under controlled wet and dry weathering, finding that high surface-area items such as thin plastic bags began visibly fragmenting within 8% to 233 days under dry conditions, generating on the order of 10% fragments per square metre within a year:
A further complication concerns the lower boundary of what current methods can reliably detect. Most Indian studies define microplastics as particles between 5 mm and roughly 20 to 300 micrometers, a range set largely by the optical resolution of visual sorting and FTIR rather than by any ecological threshold, meaning nanoplastics, and the smallest fraction of secondary microplastics, are systematically underrepresented in the reported literature regardless of how much of the total particle mass they actually constitute (Veerasingam et al., 2020). This detection ceiling matters for the continuum argument above: if fragmentation genuinely proceeds toward ever smaller particle sizes, as Mladenov et al.’s (2025) exponential fragment-generation model implies, then studies confined to the visually detectable range are likely undercounting the true downstream product of macroplastic breakdown rather than capturing it in full: Taken together, this literature suggests macro- and microplastic contamination should be treated as single continuum driven by production volume, disposal practice, and weathering, framing carried through the remainder of this review.
2.2 Distribution and Occurrence in Indian Aquatic Systems
Studies of Indian rivers, lakes, and coastal waters reads disconnected local findings in isolation, but two patterns emerge when compared directly: First, fibres dominate recovered particles almost everywhere: Napper et al. (2021) found fibres comprised 91% of particles across ten Ganges sites, and Patidar et al. (2023) reported sub-1 mm fibres as the most abundant form in the Mahanadi estuary: Second, sediment consistently holds more microplastic than the water column above it; Patidar et al. (2023) observed this directly, and Laju et al. (2022) , using sediment cores from Kodaikanal Lake, showed particle size and abundance declining with depth, consistent with finer particles migrating downward over time compositional finding adds further texture Maheswaran et al. (2022), analysing Kaveri River fragments, detected adsorbed silicon, magnesium, copper, and aluminium on particle surfaces, evidence that microplastics accumulate other material as they weather, a point relevant again to the health discussion below.
Seasonality complicates the picture further: Napper et al. (2021) recorded higher Ganges concentrations premonsoon than postmonsoon, attributing this to rainfall dilution despite likely higher total plastic input during monsoon runoff, while Youngblood et al. (2022) found no significant seasonal difference in macroplastic litter density at transect sites on the same river. Together, these findings suggest the monsoon primarily redistributes and dilutes microplastic material already present rather than changing the rate of new litter entering the system, consistent with treating macro- and microplastic contamination as linked but mechanistically distinct stages.
Two broader syntheses help explain the resulting geographic variation. Vanapalli et al. (2021) tie source variation to local socio-economic activity, with fishing and tourism dominant in Tamil Nadu and Puducherry and population density, transport, and port activity dominant in Mumbai and Chennai, and identify monsoon timing and tidal position as further drivers, with pronounced monsoon influx along the western coast. Neelavannan and Sen (2023), synthesising eighteen studies nationally, identify a north- south split: non-perennial southern rivers such as the Kaveri accumulate higher sediment concentrations than perennial northern systems such as the Ganges because extended low-flow periods allow settling rather than continuous flushing:
This pattern curiously reverses for lakes, where high-altitude Himalayan lakes carry heavier loads than southern lakes such as Kodaikanal, divergence neither synthesis fully explains and that Laju et al.’s (2022) single-site dataset cannot resolve. Collectively, these studies indicate that microplastic distribution in Indian waters is influenced by an interaction of hydrology, season, geography, and human activity rather than population density alone. However, the difference between river and lake patterns remains insufficiently explained. Most available studies also cover single sampling periods or limited annual cycles, making it difficult to distinguish long-term trends from seasonal variation. Future research therefore needs longer-term and comparable sampling across different aquatic systems.
2.3 Detection and Analytical Methods
Detection and characterization methods vary considerably across the literature, and this methodological heterogeneity is itself an important analytical thread rather than a background detail. Most studies follow broadly similar pipeline: sample collection via net or sediment coring; density separation using saline solutions such as NaCl or ZnCl₂, and digestion of organic matter with H₂O₂, followed by polymer identification (Vanapalli et al,, 2021; Patidar et al,, 2023). Where studies diverge is in the identification step. Manual sorting under microscope, based on visual shape and colour; remains common but is acknowledged to be error-prone and a source of inter= study inconsistency. Fourier-transform infrared (FTIR) spectroscopy is the dominant confirmatory technique used in an estimated 90% of the Indian microplastic studies reviewed by Neelavannan and Sen (2023). Raman spectroscopy offers higher discriminatory accuracy than FTIR, particularly for smaller particles, but at a substantial time cost that limits sample throughput. Higher-resolution techniques scanning electron microscopy with energy-dispersive X-ray spectroscopy (SEM-EDS) and atomic force microscopy (AFM) were applied by Maheswaran et al (2022) to characterize both particle morphology and adsorbed elemental content; but these methods require specialized equipment and expertise that limit their routine use.
The variation in methodology may lead to differences in contamination measurements. Since various studies apply different sampling methodologies, size criteria, and identification techniques, their results may vary in terms of the number and nature of particles detected. Consequently, particle abundance measurements made in various studies may not be comparable. Additionally, Patidar et al. (2023) have demonstrated that various indicators of contamination could lead to diverse conclusions. In the case of the Mahanadi data, the low pollutionload index did not correspond to high hazard levels of certain polymers. This demonstrates that abundance and toxicity are two separate issues in the case of plastic pollution.
One method conspicuously absent from the literature reviewed here is pyrolysis-gas chromatography mass spectrometry (Py-GC/MS), now fairly standard elsewhere for mass-based polymer quantification and for detecting particles below the size threshold that visual sorting or FTIR can reliably catch. Its absence from the Indian studies surveyed is taken up again in the research-gap discussion that follows this review.
2.4 Methodological Standardization Challenges
The inconsistency documented above is compounded by variation in field and laboratory protocol more broadly, a problem the literature repeatedly names but has not resolved. Sampling parameters such as mesh size and tow duration materially change reported concentrations independent of any real contamination difference, and choice of density-separation reagent introduces a related bias, since sodium chloride, the cheapest and most common reagent; cannot recover denser polymer types, pointing toward sodium iodide as a costlier but more complete alternative. Contamination from airborne fibres during sample handling is a further, comparatively neglected source of error: few of the studies reviewed here report the use of procedural blanks or laboratory-air controls, which are now standard practice in the international microplastics literature and would allow researchers to distinguish fibres genuinely present in a water sample from fibres shed by clothing or ambient air during processing: Neelavannan and Sen’s (2023) national synthesis states the underlying concern plainly: what limits comparison across India’s microplastic literature is not a shortage of studies but a shortage of studies using comparable methods.
2.5 Environmental and Health Implications
These standardization problems carry directly into the human-health literature, which remains considerably less developed than the environmental-occurrence literature. Mitra et al. (2024) shift the discussion from environmental presence to physiological consequence, citing clinical evidence of microplastic detection in human blood, cirrhotic liver tissue, and blood clots — findings that establish the presence of microplastics in human tissue but not any causal health effect. Their argument that plastic surfaces adsorb heavy metals including lead, cadmium, and chromium — a mechanism consistent with the elemental adsorption Maheswaran et al. (2022) measured directly on Kaveri fragments — remains a potential risk pathway rather than an established health outcome, since it rests on a single editorial rather than primary toxicological or epidemiological data. No study reviewed here links measured exposure levels to actual clinical harm, and macroplastic-related physical hazards are absent from the literature entirely. Given that methodological inconsistency already limits confidence in the underlying concentration data, extending health-risk claims from that same evidence base calls for particular caution.
3. Research Gap
Several specific gaps emerge from this literature review and directly motivate the present study. First, while major river systems like the Ganga, Indus, and Brahmaputra carry significant plastic loads to coastal environments, empirical research quantifying specific land-based sources—such as industrial effluent, or domestic municipal waste,—remains minimal. Only limited sub-catchment or town-level models currently exist, mostly restricted to select stretches of the Ganga basin, with virtually no comparative source-apportionment studies available for major river systems such as the Godavari or Brahmaputra tributaries. To address this, the present study details the contributions of land-based plastic sources across Indian freshwater systems.
Second, most existing studies on plastic contamination in Indian water bodies focus overwhelmingly on microplastics, leaving macroplastic contamination (visible plastic waste >5 mm) comparatively understudied. Systematic data detailing macroplastic flux, transport dynamics, and seasonal loading in major rivers like the Ganga and Yamuna remains scarce, and simple, low-cost monitoring protocols such as visual bridge counting, track-line surveys, and citizen-science frameworks have not yet been widely standardized or implemented across Indian watersheds. To fill this limitation, this study compiles available evidence on the occurrence and monitoring methodologies for macroplastics.
Third, the mechanistic link between macroplastic litter and downstream microplastic concentrations remains inferential rather than empirically measured for regional conditions. While studies such as Liro et al. (2023) and Mladenov et al. (2025) have quantified fragmentation rate constants for common litter items, this work was conducted under Mediterranean or temperate conditions rather than monsoonal hydrodynamics, leaving real-time fragmentation rates and hydrological transit times—the period between initial litter deposition and downstream microplastic detection—unmeasured within Indian river networks.
Fourth, analytical methodology remains unstandardized across sampling protocols, density separation media (NaCl versus denser alternatives ZnCl₂ or NaI), and polymer identification methods. Pyrolysis–gas chromatography–mass spectrometry, remains virtually unapplied in the reviewed regional studies, limiting crossstudy concentration comparisons. In response, this study systematically compares the sampling, extraction, and identification methods used across existing literature to highlight key discrepancies and emphasize the need for standardization.
Fifth, human health risks are currently represented primarily by theoretical reviews rather than primary toxicological or epidemiological investigations, with macroplastic-associated physical hazards left unaddressed and the chemical vector hypothesis regarding heavy metal adsorption (e.g., Mitra et al., 2024) remaining largely untested in field environments.
Finally, geographical assessments identified by Neelavannan and Sen (2023) remain heavily clustered around select southern rivers and high-altitude Himalayan lakes, leaving densely populated central river basins such as the Godavari unexamined, while practical connections to circular-economy policy interventions remain largely unaddressed. Consequently, this study maps catchment-scale source-apportionment pathways across understudied Indian freshwater basins.
4. Research Methodology
4.1 Research Design
The methodology of this critical synthesis involves the use of a qualitative-narrative literature review combined with a quantitative comparative literature review involving the analysis of reported concentrations, composition percentages, and pollution/hazard indices. Sources for relevant studies have been identified using systematic searches within Scopus, Web of Science, and Google Scholar databases using key terms including “riverine macroplastics,” “microplastic pollution,” “Indian rivers,” “plastic hazard index,” and “aquatic plastic contamination” for the period of 2017-18 to 2022-23. The selection of the sources was done using certain inclusion criteria, such as being peer-reviewed, having empirical information about Indian riverine or aquatic systems, and the presence of quantitative concentration/composition or index data. Studies that did not contain primary data, non-English articles, and duplicates have been excluded from the review. Following the framework for harmonization of riverine macroplastic monitoring suggested by Hurley et al. (2023), every article has been cross-classified based on sampling technique, separation medium, and identification method used. This allowed for the comparison of the studies by means of the standardization of the reported data and their methodological comparability instead of considering them as equal. The review focuses on four main themes: plastic classification and sources; distribution in Indian aquatic systems; detection and analytical methods; and standardization challenges with environmental implications.
4.2 Nature of Research
The current study adopts a descriptive research design, using secondary data with a mixed-methods approach. No primary sampling process was performed, but only the secondary synthesis of available data at two levels – that is, at the level of the quantitative data (such as abundance, composition percentages, pollution hazards and index), and the metadata of methodology (such as monitoring method, separation method, and identification technique). In the case of the quantitative analysis, the use of a descriptive comparative method was adopted, including the percentage composition comparison between the various studies, the concentration and hazard index value comparisons, and the trend in the 2017-18 to 2022-23 period.
4.3 Sample & its Technique
Purposive sampling was used, guided by defined inclusion criteria. The core sample comprises fifteen peerreviewed sources spanning global/foundational studies, India-specific field studies, regional-synthesis reviews, fragmentation-rate research, and health-focused studies, extended with recent Indian quantitative studies covering additional major river systems, a harmonisation framework for cross-study comparability, and updated global production baselines. Sources were drawn from peer-reviewed journal databases — including ScienceDirect, Springer Nature, ACS Publications, the Royal Society, and Frontiers — and supplemented with institutional reports from bodies such as the National Centre for Coastal Research (NCCR), the Central Pollution Control Board (CPCB), and The Energy and Resources Institute (TERI).
4.4 Data Collection Tool
A structured extraction template recorded, for each source: study location, monitoring approach, and quantitative findings (concentration, percentage composition, and hazard index).
Table 1. Plastic Monitoring and Identification Methods by Plastic Type
|
Plastic Type |
Method Category |
Methods/Techniques Recorded |
|
Macroplastics |
Monitoring approach |
Classified using Hurley et al. (2023) fivecategory taxonomy: (1) visual observation; (2) non-human observation/UAV; (3) nets; (4) booms; (5) waste-collection activity |
|
Microplastics |
Separation medium |
NaCl, ZnCl₂, NaI |
|
Identification method |
Visual sorting, FTIR, Raman, SEM-EDS/AFM |
|
Note. Macroplastic monitoring taxonomy adapted from Hurley et al. (2023).
In order to ensure consistency of extracted data, each source was documented in the same template, and each piece of data was verified by comparing it with the table, figure, or body of the source. The reported values were standardized to uniform units (for example, number of items/m³, number of items/kg, and percentage composition) to allow for comparisons between the studies, and the studies were coded using identical categories: the taxonomy proposed by Hurley et al. (2023) for monitoring approach; and separation medium and identification methods for microplastics.
Conflicting or missing data were presented honestly and did not receive any estimates. If the sources cited various values for the same river or the same parameter (as the result of different sampling seasons or sampling methods), then the values were preserved as such and compared according to the difference between these methodologies, but not averaged. In case some parameters were not provided (hazard index or identification methodology, for example), they were considered “not reported” and omitted only from the comparison requiring this particular parameter, but not from the review at all. The missing data were not substituted. Where the same data occurred in multiple sources, the peer-reviewed source was used, while others were excluded according to the exclusion criteria.
4.5 Variables Used
Independent variables include study location, water-body type, and methodological category ( monitoring approach; separation medium; identification method). Dependent variables include microplastic/macroplastic abundance, polymer type, particle size, composition percentage, hazard index scores, and reported environmental or health impact.
4.6 Ethical Considerations
No human participants were involved. Ethical rigour centred on academic integrity: accurate representation of source findings; transparent inclusion/exclusion criteria, proper citation, and acknowledgement of contradictory evidence.
4.7 Limitations
Key limitations include reliance solely on secondary, English-language sources; geographic skew toward southern and western India; partly offset by new Godavari and upper-Himalayan data; the harmonisation framework exposes methodological heterogeneity but cannot correct it, So cross study figures stay indicative rather than strictly comparable; microplastic literature outweighs macroplastic; and health – impact evidence rests on a single editorial rather than primary toxicological research:
5. Data Analysis & Interpretation
This section synthesizes quantitative findings from national plastic-waste records, a freshwater lake study, national coastal monitoring, and a primary seafood-exposure survey, interpreting each against the four themes established in the Literature Review: classification and sources, distribution and occurrence detection methods, and standardization/health implications.
Section 1: National Plastic Waste Generation (2016-17 to 2022-23)
Table 1. Annual plastic waste generation in India (CPCB, 2021; PIB, 2026a)
|
Year |
Waste Generated (TPA) |
YoY Change |
|
2016–17 |
1,568,714 |
— |
|
2017–18 |
660,787 |
−57.9 % |
|
2018–19 |
3,360,043 |
+408.7 % |
|
2019–20 |
3,469,780 |
+3.3 % |
|
2020–21 |
4,126,808 |
+18.9 % |
|
2021–22 |
3,901,802 |
−5.5 % |
|
2022–23 |
4,136,188 |
+6.0 % |
Figure 1. National plastic waste generation trend, 2016–17 to 2022–23.
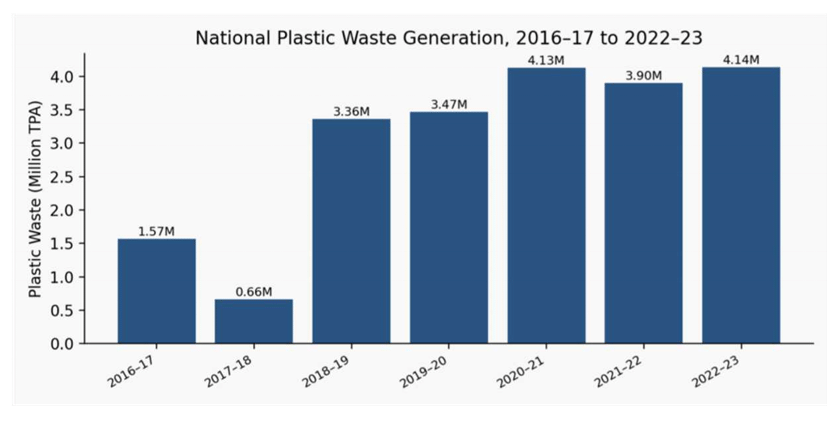
Generation rose sharply from 2018-1% onward, peaked at 4.13 million TPA in 2020-21, dipped in 2021. 22 , and recovered to a near-identical peak in 2022-23. The plateau across the final three years, rather than continued escalation, coincides with the single-use plastic prohibition (July 2022) and Extended Producer Responsibility guidelines (February 2022) reported by the Ministry of Environment; Forest and Climate Change (PIB, 2026a). By July 2026, roughly 232 lakh tonnes of packaging waste had been recycled under EPR (ETV Bharat; 2026) , suggesting regulatory pressure may be tempering upstream generation. This supports the Literature Review’s framing of macroplastic output as the entry point into the broader contamination continuum Barnes et al.,200%; Liro et al,, 2023.
Section 2: National State-wise Variation in Plastic Waste Generation
Table 2. Selected state/UT plastic waste generation, 2020–21 (CPCB, 2021)
|
State/UT |
Waste ( TPA ) |
|
Telangana |
472,675 |
|
Tamil Nadu |
430,107 |
|
West Bengal |
417,925 |
|
Uttar Pradesh |
375,950 |
|
Karnataka |
368,080 |
|
Delhi NCR |
345,000 |
|
Maharashtra |
311,254 |
Figure 2. Selected state/UT plastic waste generation, 2020–21
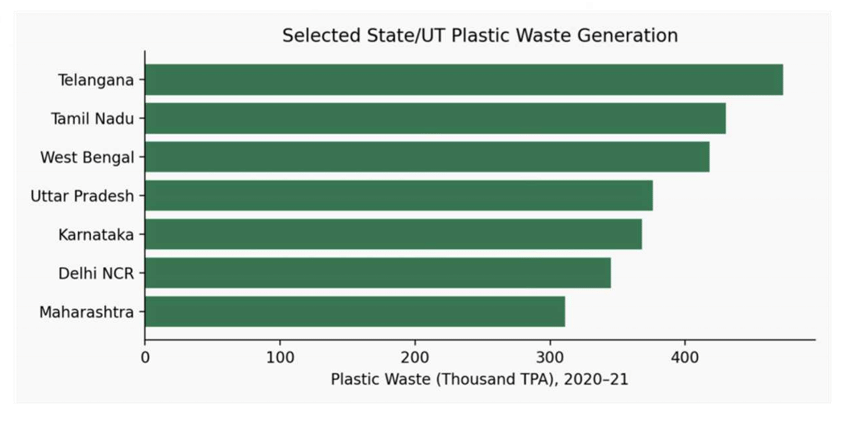
Telangana reports the highest generation among the selected states, followed by Tamil Nadu and West Bengal, with all seven states exceeding 300,000 TPA. Subsequent reply to notes: Delhi’s generation rose a further 9.5% to approximately 377,596 TPA in 2021-22 (PIB, 2026a), the only comparable year-on-year update currently available. Because the dataset is selective rather than exhaustive, these figures illustrate substantial regional disparity rather than a definitive national ranking: The pattern is consistent with the literature’s emphasis on population density, urbanisation, and industrial activity as drivers of regional plastic accumulation (Vanapalli et al., 2021), reinforcing that Indian contamination is geographically uneven. Higher waste generation may increase local contamination pressure, although the Veeranam data cannot establish a direct state- level relationship.
Section 3: Microplastic Contamination in Veeranam Lake
Table 3a. Microplastic concentration by compartment, Veeranam Lake (Bharath et al., 2021)
|
Compartment |
Range |
Mean |
|
Surface water |
13–54 items/km² |
28 items/km² |
|
Sediment |
92–604 items/kg |
309 items/kg |
Table 3b. Polymer composition, Veeranam Lake (Bharath et al., 2021)
|
Polymer |
Share |
|
Nylon |
39 % |
|
Polyethylene |
23 % |
|
Polystyrene |
19 % |
|
Polypropylene |
15 % |
|
PVC |
4 % |
Microplastics were detected in both compartments; although units differ and preclude direct statistical comparison, sediment shows a far wider concentration range, consistent with its role as Jong-t term reservoir (Patidar et al,, 2023; Laju et al,, 2022). Nylon and polyethylene dominate the polymer profile, indicating multisource contamination rather than single dominant input: These results corroborate previous findings that fibres and fragments recur across Indian freshwater systems and that sediment, not the water column, accumulates the bulk of measurable contamination.
Section 4: National Coastal Monitoring: NCCR Survey Data (2022–2026)
Table 4. NCCR/MoES coastal microplastic monitoring (PIB, 2025; ETV Bharat, 2026)
|
Metric |
Detail |
|
West-coast transects |
19 ( Porbandar–Kanyakumari ) |
|
East-coast transects |
~25 ( Puri–Tuticorin ) |
|
Predominant sources |
Riverine input; abandoned/lost fishing gear |
|
Standardisation tool |
Clean Coast Index (methodology undisclosed) |
|
Cumulative EPR recycling |
~232 lakh tonnes (July 2026) |
National-scale coastal data independently corroborates the river-to-coast transport pathways previously observed in systems like the Ganges and Kaveri. Furthermore, identifying riverine discharge and fishing gear as primary marine sources expands Vanapalli et al.’s (2021) socio-economic framework to a national scale While NCCR’s Clean Coast Index attempts to address critical analytical and methodological standardisation gaps, its undisclosed procedures hinder verification against external peer-reviewed metrics. Seafood Exposure Risk:Chandipur
Table 5. Microplastic risk-assessment metrics in commercial seafood (Nayak et al., 2026)
|
Metric |
Value |
|
Mean MP, muscle tissue |
4,628 ± 11,702 particles/g |
|
Mean MP, GIT tissue |
4,296 ± 9,687 particles/g |
|
Monsoon peak |
11,309 ± 15,448 particles/g |
|
Dominant polymers |
PVC, PET, cellulose acetate |
|
Pollution Load Index |
<10 (Level I – minor) |
|
Polymer Hazard Index |
Level III–V ( moderate–extreme ) |
|
Est. annual intake per capita |
~82–92 million particles |
Figure 3. Divergence between Pollution Load Index and Polymer Hazard Index, Chandipur seafood.
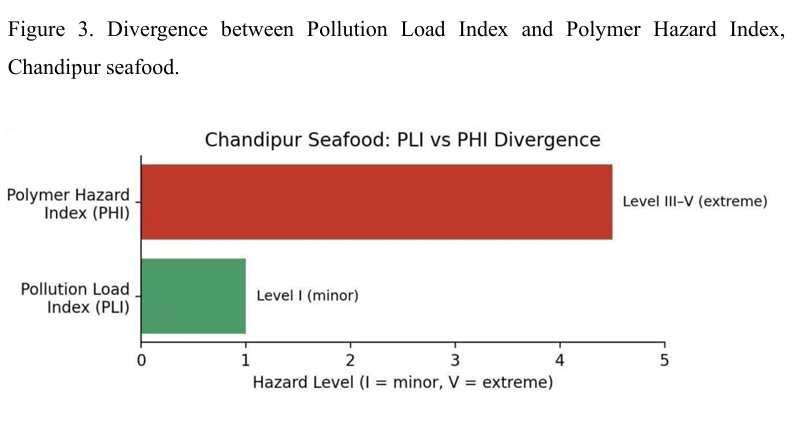
Microplastics were detected in every sampled specimen (n=3/species), with monsoon retention roughly 20-25 times higher than other seasons, a larger seasonal swing than Napper et al. (2021) reported for the Ganges, and
driven by an opposite mechanism (runoff and trawling resumption rather than dilution). The stark PLI-PHI divergence reproduces, in a dietary context, the abundance-versus-hazard mismatch Patidar et al. (2023) identified in the Mahanadi, suggesting that particle count alone may understate chemical risk. As an Indiaspecific dietary estimate in this evidence base, this value directly bridges the gap regarding potential humanhealth impacts.
Section 5: Overview of Data Sources Used in This Chapter
Table 5b. Datasets analyzed in Sections 4.1–4.5, by scope and time period
|
Section |
Dataset |
Geographic Scope |
Time Period |
|
4.1 |
National Plastic Waste Generation |
National (India) |
2016-2017 to 2022-2023 |
|
4.2 |
State/UT plastic waste generation |
Seven selected states/UTs |
2020–21 ( with 2021–22 Delhi update) |
|
4.3 |
Veeranam Lake microplastics |
Single freshwater lake, Tamil Nadu |
2021 field survey |
|
4.4 |
NCCR coastal monitoring |
National coastline ( west + east) |
2022–2026 |
|
4.5 |
Chandipur seafood exposure |
Bay of Bengal, Odisha coast |
Three seasons, 2026 |
The five datasets differ substantially in geographic scope, temporal coverage, and sampling design, ranging from single-lake field survey to multi-year national coastal monitoring programme. This variation is deliberate: rather than seeking single spatially uniform dataset, the chapter draws on the most recent and most methodologically detailed source available for each stage of the macroplastic-to- microplastic-to-human-exposure pathway identified in the Literature Review, SO that generation freshwater occurrence, coastal transport, and dietary exposure can each be examined using the strongest available evidence at that sta
Section 5: Methodological Comparison across Datasets
Table 6. Detection and identification methods applied across reviewed datasets
|
Dataset |
Separation / Extraction |
Primary Identification |
Note |
|
Veeranam Lake (Bharath et al., 2021) |
Density separation (saline) |
Visual sorting / FTIR |
Baseline freshwater lake dataset |
|
NCCR Coastal Survey (PIB, 2025) |
Not disclosed |
Clean Coast Index field scoring |
Institutional methodology unpublished |
|
Chandipur Seafood (Nayak et al., 2026) |
Wet peroxide oxidation |
FTIR + Nile Red + SEM |
First tissue-based dataset reviewed |
|
Regional Indian synthesis (Neelavannan & Sen, 2023) |
NaCl common; ZnCl₂/NaI less common |
FTIR (~90% of studies); Raman rarer |
P y – G C / M S largely absent |
Figure 4. Cross-matrix concentration comparison (illustrative, log scale).
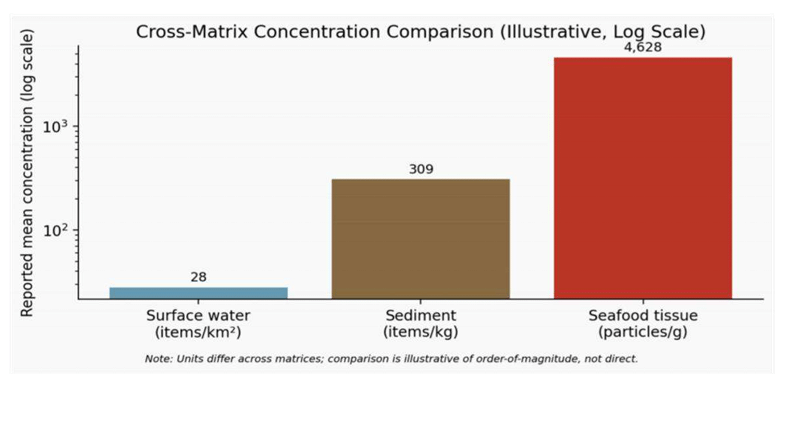
Method heterogeneity, not just site variation, plausibly drives much of the apparent difference in reported concentrations The Chandipur tissue counts (thousands of particles per gram) sit orders of magnitude above the Veeranam water and sediment figures ( items per km? or kg), but this reflects a different sample matrix and more sensitive wetoxidation protocol rather than Chandipur being categorically more contaminated ( Nayak et al. 2026). While FTIR is frequently reported in the reviewed studies, Py-GCMMS standard for subvisual polymer quantification remains largely unapplied (Neelavannan & Sen_ 2023); as result, reported abundances across these datasets reflect indicative patterns rather than a strictly comparable ranking:
Section 6: Integrated Findings and Research Gap
Table 7. Summary of key findings across the five datasets analysed
|
Dataset |
Key Metric |
Directional Finding |
|
National waste generation |
4.14M TPA (2022–23) |
Plateauing after 2020–21 peak, coinciding with EPR/SUP policy |
|
State-wise generation |
Telangana highest (472,675 TPA) |
Substantial regional disparity, incomplete national coverage |
|
Veeranam Lake |
309 items/kg (sediment) |
Sediment as long-term reservoir; nylon/PE dominant |
|
NCCR coastal survey |
44 transects nationally |
Riverine input + fishing gear as dominant marine sources |
|
Chandipur seafood |
PHI Level III–V vs PLI Level I |
Abundanceand hazard metrics diverge sharply |
Read together; the five datasets sketch a connected but not yet fully quantified pollution pathway: national plastic generation is levelling off under new regulation even as legacy waste continues moving downstream; freshwater and coastal monitoring confirm sediment and riverinelfishinggear pathways as the dominant accumulation and transport routes; and the Chandipur data close, for the first time in this evidence base, the loop between environmental contamination and measurable human dietary exposure. The recurring PLIPHI divergence across both the Mahanadi (Patidar et al, 2023) and Chandipur (Nayak et al., 2026) datasets suggests this is a general pattern rather than site-specific anomaly, reinforcing the Research Gap’s call for hazard-weighted, not just abundance-based, monitoring frameworks going forward.
Section 7: Limitations of the Present Analysis
Table 8. Key limitations affecting interpretation of the combined dataset
|
Limitation |
Implication |
|
2017–18 and 2021–22 anomalies unexplained |
Reporting coverage changes cannot be ruled out as a cause |
|
State-wise data selective |
Only Delhi has a directly comparable multiyear update |
|
Single-lake generalization risk |
Veeranam findings should not be extended to all Indian lakes |
|
Cross-matrix unit inconsistency |
Water, sediment, and tissue figures are not strictly comparable |
|
NCCR methodology undisclosed |
The Clean Coast Index cannot be independently verified |
|
Small Chandipur sample size (n = 3/species) |
High standard deviations limit statistical robustness |
These limitations constrain the extent to which figures across studies can be combined into a single national estimate, though they do not invalidate the broader directional patterns. The absence of a standardized, nationwide sampling and identification protocol remains the single largest barrier to robust quantitative synthesis and represents the most urgent methodological priority for future primary research.
6. Discuss and Conclusion
This study aimed to track the movement of plastic through Indian aquatic systems, from national generation statistics through freshwater and coastal presence to quantifiable human exposure, while also evaluating the reliability of the underlying evidence. Three findings stand out: plastic waste generation is plateauing nationally even as legacy waste continues moving downstream; sediment consistently functions as the main reservoir for microplastics across freshwater and coastal sites; and abundance-based and hazard-based risk metrics repeatedly diverge, indicating that particle counts alone understate chemical risk.
When combined with data from the Veeranam Lake and the NCCR coastal regions, statelevel statistics confirm that India’s plastic burden is unevenly distributed. Among the states examined, Telangana, Tamil Nadu, and West Bengal reported the highest generation. At Veeranam, the majority of measurable microplastic contamination is found in sediment rather than surface water, pattern consistent with previous findings on the Kaveri and Mahanadi rivers, while national coastal monitoring identifies river discharge and abandoned fishing gear as the two primary pathways for land-based microplastics entering the sea. While each of these findings is not new in isolation, their recurrence at a national level years after initial river studies indicates that they reflect inherent structural characteristics of plastic behavior within Indian water systems rather than being mere artifacts of specific sites.
The methodological gap that runs through this evidence base is not accidental. While FTIR is the dominant method for identification across nearly all reviewed datasets, Py-GC/MS more sensitive technique employed internationally for detecting trace-level polymers ~is almost entirely absent in domestic applications. Given the undisclosed separation protocol used by the national coastal monitoring body and the unique tissue-digestion method at Chandipur which differs from the saline separation techniques employed elsewhere this methodological inconsistency implies that an apparent order-of-magnitude difference, such as 28 items per square kilometer in surface water versus 4,628 particles per gram in seafood tissue, should not be interpreted as direct escalation in contamination levels. Part of that discrepancy is genuine, while the rest stems from different instruments measuring different properties across various media.
The Chandipur seafood data bridge a gap that the literature could only hint at previously. Mitra, Gupta, and Sharma (2024) used clinical evidence to argue that microplastics are present in the human body to the same extent as in the environment; their study on the Chandipur population quantified this claim by reporting a Polymer Hazard Index in the moderate-to-extreme range alongside a minor Pollution Load Index, estimating a dietary intake of 82 to 92 million particles per person annually. The same divergence between particle count and chemical hazard that Patidar et al. The 2023 finding regarding Mahanadi sediment, which resurfaces in this dietary context; stands as the study’s most compelling evidence that particle counting is an inadequate metric for assessing risk.
Collectively, the evidence outlines a pollution pathway that is qualitatively well understood but only partially quantified. Generation rates are high and may be stabilizing, and transport via rivers, sediment, and coastal waters is reasonably well understood. Human exposure has now been estimated for the first time within this evidence base, though on a single small-sample study, rather than remaining purely inferential.
7. Policy Recommendations
Three interventions are most directly derived from these findings. First, maintain and strengthen upstream enforcement Since the observed plateau in national waste generation aligns with the introduction of Extended Producer Responsibility (EPR) and single-use plastic regulations, enforcement capacity must be sustained in the highest-generating states identified in this review (Telangana, Tamil Nadu, and West Bengal), and annual state-level EPR compliance data should be published to extend the year-on-year comparisons currently available only for Delhi to a national scale. As highlighted during India’s 2025 WSDS policy dialogue, implementing regulations on toxic additives and establishing certification for recycled content would prevent recycled plastic from being downcycled into untraceable, lower-value products.
Second, allocate funding directly to methodological standardization instead of treating it as a secondary concern. A national plastic-monitoring database, loosely modeled on Australia’s National Plastics Plan, would consolidate river; lake, coastal and dietaryexposure data on comparable terms, enabling researchers and regulators to compare sites o common ground rather than reconstructing comparisons from scattered reports, as this study had to. All newly funded studies should be mandated to report the separation medium and identification method in a standardized format; including Py-GC/MS confirmation for at least a subsample of the results.
Third, prioritize fishing gear and river discharge as primary sources instead of treating them as general litter: The gear-marking and buy-back programs implemented near the Bay of Bengal sites studied, along with litter interception at the river mouths with the highest plastic volumes identified through transect surveys, focus on the two primary pathways indicated by the existing evidence, rather than on diffuse coastal cleanup efforts that merely address symptoms downstream of where plastic first enters the water.
8. Areas for Future Research
Four gaps require direct attention a standardized monitoring protocol encompassing the separation medium, identification method, and hazard-index calculation is a critical parallel priority, since it serves as the essential prerequisite for integrating both existing and future data into a unified national overview — without which new field surveys risk adding further methodologically incomparable data.
In contrast to southern India and the Himalayas, central river basins like the Godavari and Mahanadi have received comparatively less research attention: Recent Godavari data is a useful start but not sufficient on its own to close this regional gap. Conducting multiseason sampling that is directly comparable to existing datasets for the Ganga and Kaveri basins would allow researchers to test the already observed north-south hydrological pattern against a third major river basin.
This literature’s health dimension now has a single primary exposure study supporting it, which examined seven species at one site over three seasons. That is insufficient to transition from a plausible mechanism to a measured population-level risk: Expanding dietary exposure sampling to other fish-eating coastal and inland populations, combined with toxicological research on the heavy metals and microplastics they are known to ingest, would enable a hazard index to eventually be translated into actual health outcomes.
Finally, the currently available fragmentation-rate constants were derived under temperate wet_ dry weathering conditions rather than monsoonal ones. Specifically measuring the transit time between initial litter deposition and downstream microplastic detection under monsoon hydrodynamics would transform the qualitative macroplastic-to-microplastic argument running through this review into a quantified, India- specific model.
9. References
- Barnes, D. K. A., Galgani, F., Thompson, R. C., & Barlaz, M. (2009). Accumulation and fragmentation of plastic debris in global environments. Philosophical Transactions of the Royal Society B: Biological Sciences, 364(1526), 1985–1998. https://doi.org/10.1098/rstb.2008.0205
- Laju, R. L., Jayanthi, M., Jeyasanta, K. I., Patterson, J., Asir, N. G. G., Sathish, M. N., & Patterson Edward, J. K. (2022). Spatial and vertical distribution of microplastics and their ecological risk in an Indian freshwater lake ecosystem. Science of the Total Environment, 820, Article 153337. https://doi.org/10.1016/j.scitotenv.2022.153337
- Liro, M., Zielonka, A., & van Emmerik, T. H. M. (2023). Macroplastic fragmentation in rivers. Environment International, 180, Article 108186. https://doi.org/10.1016/j.envint.2023.108186
- Maheswaran, B., Karmegam, N., Al-Ansari, M., Subbaiya, R., Al-Humaid, L., Sebastin Raj, J., & Govarthanan, M. (2022). Assessment, characterization, and quantification of microplastics from river sediments. Chemosphere, 298, Article 134268 https://doi.org/10.1016/j.chemosphere.2022.134268
- Mitra, P., Gupta, S., & Sharma, P. (2024). Double trouble: Unravelling the health hazards of microplastics and heavy metals. Indian Journal of Clinical Biochemistry, 39(4), 447–449. https://doi.org/10.1007/s12291-024-01270-4
- Mladenov, N., Knight, E., Olney, A., Wakida, F. T., Piñon-Colin, T. de J., Youssef, G., & Kinoshita, A. M. (2026). Marine debris in river margins: Wet and dry weathering effects on the fragmentation and degradation of discarded plastic. Microplastics and Nanoplastics, 6, Article 5. https://doi.org/10.1186/s43591-02500164-3
- Napper, I. E., Baroth, A., Barrett, A. C., Bhola, S., Chowdhury, G. W., Davies, B. F. R., Duncan, E. M., Kumar, S., Nelms, S. E., Hasan Niloy, M. N., Nishat, B., Maddalene, T., Thompson, R. C., & Koldewey, H. (2021). The abundance and characteristics of microplastics in surface water in the transboundary Ganges River. Environmental Pollution, 274, Article 116348. https://doi.org/10.1016/j.envpol.2020.116348
- Neelavannan, K., & Sen, I. S. (2023). Microplastics in freshwater ecosystems of India: Current trends and future perspectives. ACS Omega, 8(38), 34235–34248. https://doi.org/10.1021/acsomega.3c01214
- Patidar, K., Ambade, B., Verma, S. K., & Mohammad, F. (2023). Microplastic contamination in water and sediments of Mahanadi River, India: An assessment of ecological risk along rural-urban area. Journal of Environmental Management, 348 , Article 119363. https://doi.org/10.1016/j.jenvman.2023.119363
- Centre for Science and Environment. (2020). Managing plastic waste in India: Challenges and agenda. Centre for Science and Environment.
- Chaudhary, M., Rawat, S., & Suthar, S. (2025). Microplastic in upper Himalayan Ganga river: Occurrence, seasonal dynamics and ecological risk. Science of the Total Environment, 967, Article 178824. https://doi.org/10.1016/j.scitotenv.2025.178824
- Gupta, P., Saha, M., Naik, A., Kumar, M. M., Rathore, C., Vashishth, S., Maitra, S. P., Bhardwaj, K. D., & Thukral, H. (2024). A comprehensive assessment of macro and microplastics from Rivers Ganga and Yamuna: Unveiling the seasonal, spatial and risk factors. Journal of Hazardous Materials, 469, Article 133926. https://doi.org/10.1016/j.jhazmat.2024.133926
- Hurley, R., Braaten, H. F. V., Nizzetto, L., Steindal, E. H., Lin, Y., Clayer, F., van Emmerik, T., Buenaventura, N. T., Eidsvoll, D. P., Økelsrud, A., Norling, M., Adam, H. N., & Olsen, M. (2023). Measuring riverine macroplastic: Methods, harmonisation, and quality control. Water Research, 235, Article 119902. https://doi.org/10.1016/j.watres.2023.119902
- Lebreton, L., & Andrady, A. (2019). Future scenarios of global plastic waste generation and disposal. Humanities and Social Sciences Communications, 5, Article https://doi.org/10.1057/s41599-018-0212-7
- Plastics Europe. (2020). Plastics—the facts 2020. Plastics Europe.
- Ramanamurthy, M. V., Mishra, P., & Vethamony, P. (2018). Marine litter in the South Asian Seas (SAS) region: Development of regional action plan on marine litter—India country report. United Nations Environment Programme, South Asia Co-operative Environment Programme, Ministry of Earth Sciences, Government of India.
- Sekar, V., & Sundaram, B. (2023). Occurrence, quantification and characterisation of microplastics in Godavari River, India. Case Studies in Chemical and Environmental Engineering, 8, Article 100542. https://doi.org/10.1016/j.cscee.2023.100542
- The Energy and Resources Institute. (2025). Study on microplastics in River Yamuna and groundwater in Delhi. Department of Environment, Government of National Capital Territory of Delhi.
- Bharath, M., Sridhar, V., & Jayaram, S. (2021). Microplastics as an emerging threat to the freshwater ecosystems of Veeranam Lake in South India: A multidimensional approach. Chemosphere, 264, Article 128522. https://doi.org/10.1016/j.chemosphere.2020.128522
- Blettler, M. C., Abrial, E., Khan, F. R., Sivri, N., & Espinola, L. A. (2018). Freshwater plastic pollution: Recognizing research gaps and identifying the way forward. Water Research, 143, 416–424. https://doi.org/10.1016/j.watres.2018.06.015
- Jaikumar, G., Kumar, R., & Rani, M. (2024). Quantification and ocean transport models of global plastic waste accumulation. Marine Pollution Bulletin, 198, Article https://doi.org/10.1016/j.marpolbul.2023.115820
- Nayak, B. K., Mohanty, S., & Sahoo, G. (2026). Assessment of microplastic contamination in seafood species along the Chandipur coast, Odisha, India. Environmental Monitoring and Assessment, 198(2), Article 112. https://doi.org/10.1007/s10661-025-12100-x
- (2018). Plastics – the Facts 2018: An analysis of European plastics production, demand and waste data. PlasticsEurope Market Research Group. https://plasticseurope.org/knowledge-hub/plastics-the-facts-2018/
- Thompson, R. C., Olsen, Y., Mitchell, R. P., Davis, A., Rowland, S. J., John, A. W., McGonigle, D., & Russell, A. E. (2004). Lost at sea: Where is all the plastic? Science, 305(5685), 838. https://doi.org/10.11229/science.1094559
- Vaid, M., Mehra, K., & Gupta, A. (2021). Microplastics as contaminants in Indian environment: A review. Environmental Science and Pollution Research, 28(48) , 68025–68052. https://doi.org/10.1007/s11356-021-16827-6
- Vanapalli, K. R., Sharma, H. B., Ranjan, V. P., Samal, B., Bhattacharya, J., & Goel, S. (2021). Challenges and strategies for effective plastic waste management during and post COVID-19 pandemic. Science of the Total Environment, 750, Article https://doi.org/10.1016/j.scitotenv.2020.141514
- Veerasingam, S., Ranjani, M., Venkatachalapathy, R., Bagaev, A., Mukhanov, V., Litvinyuk, D., Mugilarasan, M., Gurumoorthi, K., Guganathan, L., Aboobacker, V. M., & Vethamony, P. (2020). Microplastics in the marine environment of coastal India: A review. Marine Pollution Bulletin, 154, Article 111057. https://doi.org/10.1016/j.marpolbul.2020.111057
- Youngblood, K., Brooks, A. L., & Jambeck, J. R. (2021). Assessment of plastic waste generation and management leakage along river corridors. University of Georgia.
- Ajith, N., Arumugam, S., Parthasarathy, S., Manupoori, S., & Janakiraman, S. (2020). Global distribution of microplastics and its impact on marine environment— a review. Environmental Science and Pollution Research, 27(21), 25970–25986. https://doi.org/10.1007/s11356-020-09015-5