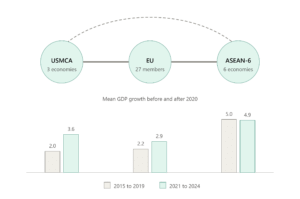
Authors: Vanshi, Vidhu, Mridul, Kashish, and Tanush
1. Introduction
The relationship between international trade policy, trade volumes, and national economic output is a central theme in modern macroeconomics, as trade agreements—ranging from regional pacts to broad multilateral frameworks—seek to reduce tariffs, lower non-tariff barriers (NTBs), facilitate foreign direct investment (FDI), and harmonize cross-border regulations. However, theoretical claims that trade openness automatically yields faster economic expansion face mixed empirical evidence. Instead, growth outcomes are highly conditional and asymmetric, heavily mediated by domestic institutional quality, economic development stage, technology adoption capacity, and regional integration structures.
To evaluate these dynamics, this research utilizes a mixed-methods design based on post-2000 cross-national secondary data and literature to examine how trade agreements (scope, depth, regional vs. multilateral) and physical trade volumes directly influence national GDP growth rates, while taking into account key mediating factors such as development levels, institutional properties, and modern digital or non-tariff barriers. Across five sub-themes—regional agreements, multilateral systems, physical trade volume, development-stage differences, and modern trade barriers—the empirical analysis reveals that trade openness alone does not reliably predict faster economic performance, as evidenced by a weak correlation (r = 0.205) and limited explanatory power (R² = 0.042) between trade openness and GDP growth across major regional blocs such as ASEAN-6, USMCA, and the EU. Ultimately, this paper demonstrates that international trade agreements and expanding trade volumes serve as critical enabling factors rather than automatic drivers of growth, with the real economic benefits depending heavily on individual countries’ development stages, institutional readiness, and broader structural conditions.
2. Literature Review
The effects of international trade agreements and trade flows on growth, productivity, and development constitute a well-studied academic field. This field is important because trade benefits are rarely distributed equally across partners, as they depend on the nature of the products traded, trade flows, development level, and the institutions of the trading partners. This literature review is therefore organized into five themes: regional trade agreements and economic growth, multilateral and global trade agreements, physical trade volume, developing versus developed countries, and non-tariff barriers and modern trade.
2.1 Regional Trade Agreements and Economic Growth
Regional trade agreements (RTAs) are anticipated to lower barriers to trade and promote trade, investment, and productivity growth among the involved countries. RTAs are expected to promote economic growth depending on the agreements’ openness, size, and the institutional properties of the involved countries. For example, Vamvakidis (1998) found that broad (nondiscriminatory) trade liberalization was generally associated with higher economic growth than participation in regional trade agreements, mainly because most regional trade agreements at the time were between small, closed developing economies.
Okoro et al. (2020) found that the regional trade agreements of ECOWAS had a positive and significant effect on economic growth. Sunge and Ngepah (2019/2020) argued that trade liberalization and regional trade agreements promote technical efficiency via technology transfer, especially in the agricultural sector of Africa, in the production of commodities such as rice and maize. On the other hand, Palit (2017) found that mega FTAs favored large developing economies over small ones, and that non-participating developing economies faced protectionism and regulatory hurdles. The review therefore finds that RTAs can promote economic growth depending on the agreements’ scope, coverage of goods, and institutional characteristics.
2.2 Multilateral and Global Trade Agreements
Trade agreements play a significant role in reducing trade barriers and uncertainties, promoting free trade, and, consequently, elevating economic activity. The impact of multilateral trade agreements depends on the extent to which tariffs are reduced, the level of trade openness achieved, and the state of international relations. Although global trade liberalization and reductions in trade barriers have amplified trade, protectionism and trade tensions in recent years have diminished the impact of multilateral trade agreements. Some authors found that convergence in trade barriers was significant throughout the period under study, and that trade diversion was limited despite recent trade tensions. Others found that multilateral reductions in tariff barriers led to trade creation by lowering trade costs and reducing trade-policy uncertainty. WTO-related literature revealed that recent trade negotiations have weakened the organization’s ability to enforce agreements, particularly regarding dispute settlement, and that unilateral tariff reductions have dampened trade growth. The review therefore finds that while multilateral trade agreements promote trade and international relations, their effectiveness has been undermined in recent years.
2.3 Physical Trade Volume and Economic Growth
The effect of trade volume on economic growth is of great importance, given that physical trade reflects the level of imports and exports between countries. Several studies demonstrate a positive association between trade volume and economic growth, although the strength of that association depends on how trade volume is measured and specified. For instance, Busse and Königer (2012) found that the ratio of exports and imports to GDP has a positive relationship with subsequent GDP growth rates per capita, especially in developing economies.
Wacziarg and Welch (2001) found that trade liberalization increased trade openness, investment, and, consequently, economic growth, with investment accounting for more than sixty percent of the effect. Similarly, Calderon and Cantu (2019) found that trade liberalization and diversification increased output per worker in Sub-Saharan Africa through capital deepening and total factor productivity. The review therefore finds that trade volume has a positive association with economic growth, depending on the indicators and specifications used.
2.4 Developing and Developed Countries
It is well documented that trade agreements affect developing and developed economies differently, with the latter generally benefiting more than the former. Developing countries are generally less prepared than advanced economies to lower institutional and policy barriers to trade, investment, and competition, leaving them more vulnerable to the negative economic effects of free trade. For instance, Gamso and Postnikov (2022) found that North-South trade agreements tend to be more comprehensive than South-South trade agreements, covering more investment, services, and intellectual-property provisions.
Díaz-Mora et al. (2024) found that trade agreements with greater coverage depth affect trade more intensively, especially when institutional capabilities are adequate, while Guillén et al. (2023) found that extended trade agreements have a positive effect on services trade, particularly for developed countries. The review therefore finds that trade agreements generally affect developing and developed countries differently, depending on countries’ institutional structures and the depth of the agreements.
2.5 Non-Tariff Barriers and Modern Trade
The literature on non-tariff barriers and trade mostly deals with the effects of non-tariff and technical trade barriers on trade, as well as the impact of digital-trade-related policies on trade, especially on services trade. For instance, Taglioni and Kee found that non-tariff barriers were rising, especially in developed economies, and that non-tariff barriers threatened to offset the benefits of tariff reductions for developing economies and small enterprises. Leonardi and Meschi found that non-tariff barriers helped protect the labor force in the United States against lower employment rates.
Peressotti (2025) found that more developed economies were more likely to impose stricter digital trade barriers, whereas Bekkers et al. (2025) expected that digitalization would increase international trade and prosperity, but that the benefits would accrue mainly to high-income countries. The review therefore finds that modern trade faces several barriers, including non-tariff barriers, with varying effects across different countries.
2.6 Literature Summary and Research Gap
Overall, the literature review reveals that trade agreements and trade volume generally have positive effects on economic growth, depending on the agreements’ openness, size, institutional properties, participants’ readiness, and the level of trade openness achieved. At the same time, the literature review did not reveal conclusive evidence on the effectiveness of trade agreements, trade volumes, and economic growth taken together.
While most articles highlight the effect of trade agreements and trade on economic growth individually, this review identifies a research gap in examining their overall, joint effect on economic growth. Future research could explore this gap further by assessing the combined effect of trade and trade agreements on economic growth, taking into account institutions, agreement coverage depth, and non-tariff barriers, and by examining how these effects differ between developed and developing countries.
3. Research Methodology
3.1 Research Design
A secondary analysis approach combining both quantitative analysis as well as descriptive approach is utilized to analyse the impact that international trade agreements and trade volumes have on the economic growth of countries. The reason for opting for such a approach is that the research question focuses on international trade, meaning that for the study to be objective, data from around the world would have to be collected, analysed, and correlated. With both a quantitative & qualitative approach, we utilize existing research papers, census & survey data sets to obtain a wider range of sample sizes, along with the authors’ own analyses, to examine different viewpoints in constructing our own analysis and conclusions.
3.2 Nature of Research
A quantitative & qualitative approach with secondary data was utilized, primarily focusing on results from research papers addressing sub-themes such as the level of economic development, institutional properties, non-tariff barriers, and regional trade agreements.
3.3 Sample and Sampling Technique
Once the method of research was decided, the focus shifted to selecting the best possible data set. For this, we made the decision to use data samples from previous research papers and organize them into five categories: Regional Trade Agreements and Economic Growth, Multilateral and Global Trade Agreements, Physical Trade Volume and Economic Growth, Developing and Developed Countries, and Non-Tariff Barriers and Modern Trade.
After the themes were chosen, the focus was on assembling a diverse set of research papers presenting both sides of the argument. The time period was set mostly from 2000 onward, as the period before this saw war and the heavy use of tariffs and other protectionist tools, whereas the period from 2000 onward, heading into the twenty-first century, was viewed as the modern era of trade. The papers had to be by reputable authors and institutions—including major organizations such as the World Bank and the WTO, national economic bodies, and universities, or otherwise credible independent economic experts—so that the secondary data was reliable enough to base a solid thesis on.
3.4 Data Collection Tools
Because a qualitative & quantitative approach was selected given the nature of the research question, we decided to employ secondary data—such as journals, research papers, articles, and books—to collect and collate our sample.
Given how vast the topic is and how many resources are available, it was important to set parameters for what counted as a good secondary source. Ideally, a secondary source draws on data from the twenty-first century, since that is when the modern trade era began. Research papers needed to be published, ideally by a recognized institution, so that the work had been reviewed and analyzed thoroughly. For books or journals, the source needed to be a credible name in the field of economics—for example, an article from a reputable outlet such as the Times of India, The Economist, or the Financial Times was treated as a credible source. Length requirements varied by source type: for books, anything above fifty pages was considered acceptable, while for research papers, ten to fifteen pages was treated as the minimum.
3.5 Variables Used
Independent variable: international trade agreements and trade volumes.
Dependent variable: economic growth of countries.
Key contextual factors: level of economic development, institutional properties, non-tariff barriers, and regional trade agreements.
International Trade Agreements and Trade Volumes was chosen as the independent variable because the study specifically sought to analyze the impact that changes in trade agreements and trade volumes have on a country’s economy. Economic Growth of Countries was set as the dependent variable, since this is what we used to assess whether changes in trade agreements and trade volumes affect a country’s GDP per capita, GDP, real GDP, GNI, and other metrics reflecting economic growth. During the research, we also examined factors such as the level of economic development, institutional properties, non-tariff barriers, and regional trade agreements, as they correlate with international trade growth.
3.6 Ethical Considerations
During the process of gathering secondary data, all relevant ethical considerations were kept in mind, including privacy, the responsible use of data, and the use of data drawn exclusively from published sources available online; ethical considerations were therefore followed throughout data collection.
3.7 Limitations
With research papers, articles, and books, a common problem is the introduction of bias: an author’s political leanings, or a country’s political stance, can shape how data is presented and analysed, leading to a lack of objectivity. This was present in some of the research reviewed, and although multiple viewpoints were included to guard against it, Western-hemisphere perspectives on trade liberalization tend to be over-represented relative to alternative Eastern-hemisphere views, partly because of limited data visibility.
Another significant limitation was the absence of a clearly defined time frame for the research; this made the research focus extremely broad, whereas narrowing the time frame would likely have produced more specific data and findings. The lack of a bounded time frame also means that anomalous events—such as proxy wars, terrorist attacks, and sudden financial shocks—enter the analysis and can skew the data and influence interpretation.
4. Data Analysis
4.1 Introduction
The section contains the findings gained from analyzing the association between international trade agreements, trade volumes, and economic development of various countries. It is based on secondary cross-country sourced statistics for the years 1995-2024, which were provided by the World Bank’s World Development Indicators (WDI) and the available trade and tariff statistics of WTO. The goal of this section is purely descriptive and focuses on creating a understanding of the existing differences, patterns, and relationships in the field of five topics (sub-themes); these topics include regional trade agreements, multilateral trade agreements, physical trade volumes, the divide between developing and developed countries, and the wider aspect of the non-tariff and modern trade measures. The research employing correlation and regression of the relationships is handled in Section 4.6.
The dataset consists of three types of series, which are purposely maintained at two separate levels of aggregation for two purposes. Since for country-level descriptive statistics and trade volume/growth comparisons (see Sections 4.3 and 4.4(d)) the unit of analysis is based on individual sovereign countries which are the USA, Canada and Mexico (three USMCA states), Germany, France and Italy (three largest states of the EU), and six ASEAN countries (Indonesia, Malaysia, the Philippines, Singapore, Thailand and Vietnam) between 2015 and 2024 which sums to twelve countries. To make comparison at the regional bloc level, the unit of analysis switches to the bloc level; which are USMCA, the EU being considered as one aggregate unit, and ASEAN-6 (an average of group), because the comparison is clearly related to whether being a member of the given agreement leads to a growth difference at the bloc level. The global multilateral indicators from the WTO such as the simple average MFN tariff and the ratio of world trade over GDP as well as the number of regional trade agreements reported to the WTO show GDP growth and openness to trade across three World Bank classification groups (high-income, low and middle-income, and low-income economies during the 2000-2024 period) for the purpose of assessing the multilateral system versus the developed/developing countries divide.
Following the golden rule of data quality, every table or figure described in the next pages are accompanied by an analysis that recognizes the underlying trend, compares different populations under consideration, indicates how important the observed gap is, interprets what the result means, and connects the answer to the research question rather than just repeating all the numbers.
4.2 Data Overview
This analysis relies on the use of secondary panel data instead of a primary survey, hence defining the “sample” in terms of countries, blocs and years rather than respondents. Information on the variables, coverage, sources, etc. is presented in Table 1.
Table 1: Sample Profile and Data Sources
|
Variable |
Definition |
Coverage |
Source |
|
GDP growth |
Annual % growth of real GDP |
12 countries, 2015-2024 (120 country-year observations) |
World Bank WDI, series NY.GDP.MKTP.KD.ZG |
|
Trade openness |
Exports + imports of goods and services, as % of GDP |
12 countries, 2015 / 2018 / 2020 / 2022 / 2024 |
World Bank WDI, series NE.TRD.GNFS.ZS |
|
Bloc-level GDP growth |
Annual % growth of real GDP, aggregated by trade bloc |
USMCA (3-country average); EU (aggregate); ASEAN-6 (6-country average), 2015-2024 |
World Bank WDI |
|
Income-group GDP growth |
Annual % growth of real GDP, by income group |
High-income; low- & middle-income; low-income groups, 2000-2024 (selected years) |
World Bank WDI |
|
Income-group trade openness |
Trade as % of GDP, by income group |
World; high-income; low- & middle-income groups, 2000-2024 |
World Bank WDI |
|
MFN tariff rate |
Simple average most-favoured-nation applied tariff |
World, 1995 and 2022 |
WTO World Tariff Profiles 2023 / WTO Data Blog |
|
World trade-to-GDP ratio |
World merchandise + services trade as % of world GDP |
World, 1995 and 2022 |
WTO Data Blog (Apr. 2024) |
|
RTAs in force |
Regional trade agreements notified to GATT/WTO |
1948-1994 vs 1995-present |
WTO, “Regional Trade Agreements – Facts and Figures” |
Point to be noted: “ASEAN-6” refers to the six ASEAN members with the longest continuous WDI series and excludes Brunei, Cambodia, Laos and Myanmar. Germany, France and Italy are used as the EU representatives in the country-level tables because, together, they account for roughly half of EU GDP and span a range of growth performance within the bloc.
Note about the analysis units: In the tables on country levels in sections 4.3 and 4.4(d) there is taken twelve separate nations as the analysis unit, including three EU countries instead of EU as a whole. This decision is taken instead of measuring EU as one 27- states block. Combining an aggregation (which averages without taking into account 27 states internal divergences) with separate countries (the divergences of which can be seen) does not allow for right comparisons of the level of EU divergence against all the other lines in the table because the EU would be overestimated if compared with it or any other row. In sections 4.3 and 4.4(d) the comparison of individual countries is successfully implemented. However, when comparing these with regard to the aggregations presented in section 4.4(a), the EU agglomerate is used.
The twelve countries in the primary panel have constituted a significant proportion of the world GDP and trade of the period and were selected specifically to correspond to the three regional trade agreements indicated in the sub-themes of the research. The income groups series expand the sample across all economies as classified by the World Bank so that the developing countries versus developed countries comparison could move beyond the twelve investigated countries in Section 4.4. The WTO multilateral series are global aggregates and thus correspond essentially to the entire WTO membership (166 members according to the data sources).
4.3 Descriptive Statistics
Descriptive statistics mean, median, standard deviation, minimum, and maximum about yearly GDP growth for all twelve countries from 2015 to 2024 (with ten yearly observations from each of the countries following 2020 COVID pandemonium) are given in Table 2. To maintain consistency with Section 4.2, Germany, France, and Italy are treated on an individual level in the table instead of aggregating their statistics as EU countries.
Table 2: Descriptive Statistics of Annual GDP Growth (%), 2015-2024
|
Country |
Mean |
Median |
Std. Dev. |
Min |
Max |
|
Vietnam |
6.14 |
6.96 |
1.91 |
2.55 |
8.54 |
|
Philippines |
4.79 |
6.23 |
4.81 |
-9.52 |
7.58 |
|
Indonesia |
4.22 |
5.03 |
2.14 |
-2.07 |
5.31 |
|
Malaysia |
4.01 |
4.64 |
3.50 |
-5.46 |
9.03 |
|
Singapore |
3.29 |
3.55 |
3.30 |
-3.61 |
10.14 |
|
United States |
2.51 |
2.69 |
1.88 |
-2.08 |
6.15 |
|
Thailand |
2.04 |
2.79 |
2.83 |
-6.09 |
4.22 |
|
Canada |
1.90 |
2.00 |
2.77 |
-5.04 |
5.95 |
|
Mexico |
1.38 |
1.92 |
3.61 |
-8.35 |
6.05 |
|
France |
1.25 |
1.54 |
3.33 |
-7.44 |
6.88 |
|
Italy |
1.16 |
0.91 |
4.19 |
-8.87 |
8.93 |
|
Germany |
0.90 |
1.40 |
2.15 |
-4.13 |
3.91 |
Source: Author’s calculations based on World Bank, World Development Indicators (NY.GDP.MKTP.KD.ZG), 2015-2024. Shaded rows: EU member states used in place of the EU aggregate.
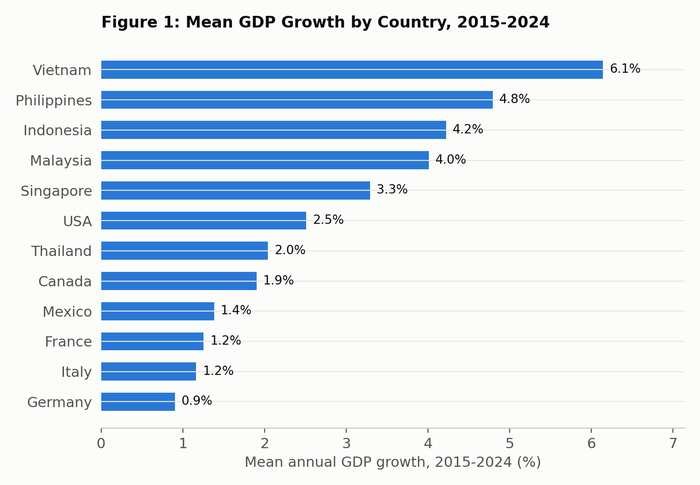
Figure 1: Mean GDP Growth by Country, 2015-2024
Source: Author’s calculations based on World Bank WDI data.
The twelve-country averages show a clear ordering: The six economies of ASEAN are at the top five positions and are led by Vietnam (with an average of 6.1% a year and a median of 6.96%), while countries in USMCA and EU are situated at the bottom of the ranking, with the least mean score being of Germany (0.9%). The average difference between the heteorgeneous economies in the sample is 5.2 percentage points a year (Vietnam 6.1% and Germany 0.9%). The EU reveals high dispersion amount that could have been hidden with an EU aggregate row,-where Italy stands out with the highest standard deviation (4.19) among the three countries that have been represented in the EU and which has been influenced by the bloc’s stand-alone peak drop (-8.87%) followed by the highest rise in numbers (+8.93% in 2021), while Germany’s mean growth rate (0.90%) is just a third of France’s (1.25%) and which is lower than the EU aggregate number in Section 4.4(a) (1.69%). In essence, the trend still conforms with the general finding that developing Southeast Asian economies have outpaced their developed counterparts in terms of growth rates over the past ten years despite experiencing a common global shock; however, the descriptive data does not shed light on how much of the ASEAN benefits may be ascribed to account for the benefits from trade deals, trade volume, or other structural factors like demographic shifts or catching-up growth.
Table 3 presents the trade openness – the sum of imports and exports as a share of GDP – for the same 12 countries on five occasions from 2015 to 2024.
Table 3: Trade Openness (Trade as % of GDP), Selected Years
|
Country |
2015 |
2018 |
2020 |
2022 |
2024 |
|
Singapore |
329.5 |
325.7 |
331.1 |
330.3 |
313.3 |
|
Vietnam |
144.9 |
164.7 |
163.3 |
183.2 |
173.9 |
|
Malaysia |
131.4 |
130.4 |
116.8 |
146.4 |
137.4 |
|
Thailand |
124.8 |
120.8 |
97.7 |
132.8 |
135.7 |
|
Germany |
77.8 |
79.1 |
72.9 |
88.8 |
79.1 |
|
Mexico |
70.4 |
80.2 |
76.9 |
88.8 |
75.4 |
|
France |
63.5 |
66.8 |
58.8 |
76.0 |
68.1 |
|
Philippines |
59.1 |
72.2 |
58.2 |
72.4 |
65.9 |
|
Canada |
66.2 |
66.6 |
61.2 |
67.0 |
65.1 |
|
Italy |
55.4 |
59.3 |
53.9 |
72.0 |
62.6 |
|
Indonesia |
41.9 |
43.1 |
33.0 |
45.5 |
42.8 |
|
United States |
27.7 |
27.5 |
23.1 |
26.9 |
25.0 |
Source: World Bank, World Development Indicators (NE.TRD.GNFS.ZS). Shaded rows: EU member states used in place of the EU aggregate.
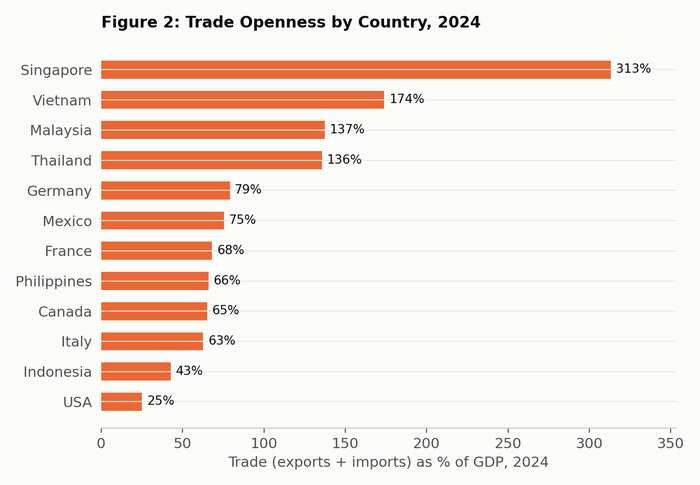
Figure 2: Trade Openness by Country, 2024
Source: World Bank WDI data.
The difference in the trade openness is far greater in the sample than is the case with the GDP growth. The economy of Singapore is heavily dependent on trade in comparison to the economy of the USA (313% of GDP against 25% of GDP by 2024). The economically developed ASEAN countries namely Singapore, Vietnam, Malaysia and Thailand all have a higher trade openness than any of the three EU member countries presented in the table. Among European Union countries, Germany is the most trade open (79% of GDP as of 2024) and Italy the least-open (63%). This shows 16% difference between the two countries, which the overall EU figure presented in this chapter does not show because EU-figures are calculated depending on the intra-EU trade. The USA is the least trade dependent economy among others. The decline seen in each row of Table 3 in 2020 refers to the pandemic-related slowdown in global trade, which is followed by a recovery in 2022 that has pushed trade volume for many countries higher than the levels seen in 2015. This is a clear indication of the fact that “trade volume” (Sub-theme 3) is not a single global trend, but rather a domestic structural characteristic, making it necessary to look at it in relation to the level of economic growth in individual countries, as done in Section. 4.4(d).
4.4 Distribution
In this part, comparisons are made between GDP growth and measures of trade among the different groups referred to as per five themes of the study. In the sub-section (a) below, the EU is treated at the level of trade bloc instead of the level of countries, thus changing the unit of analysis from the previous sections intentionally because the question analyzed there (does membership in a trade bloc correspond with the fact of economic growth?) is constructed at the level of trade bloc.
(a) Regional Trade Agreements: USMCA, EU and ASEAN-6
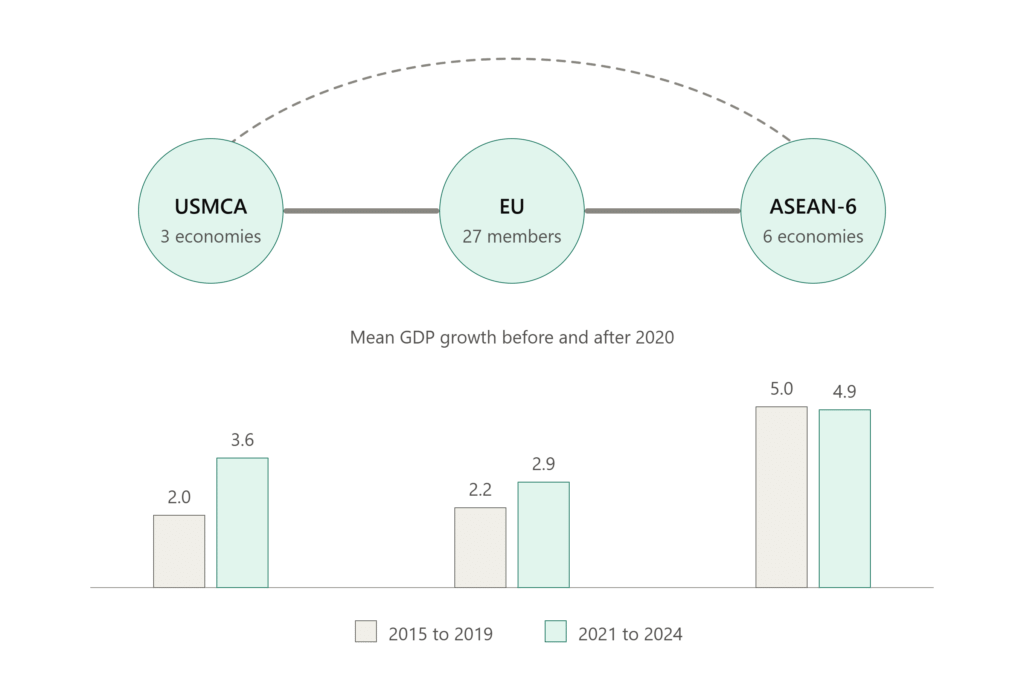
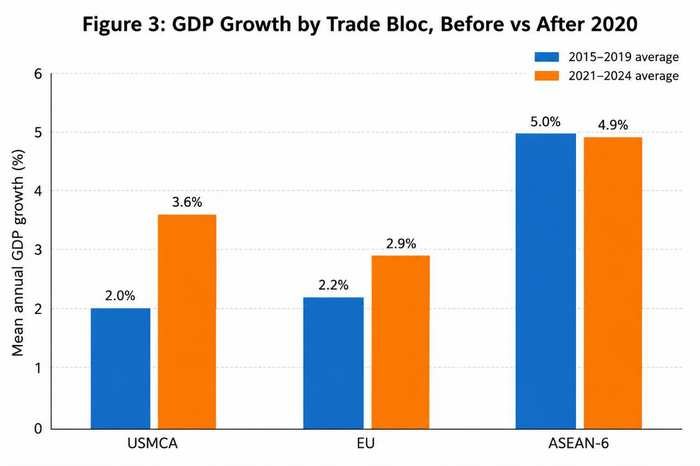
Table 4 highlights GDP growth averages for the three blocs prior and after 2020. It divides the panel into a pre-2020 period (2015-2019) and a post-2020 period (2021-2024) which doesn’t include the pandemic year. The GDP of each bloc includes a separate aggregate; for USMCA, the average of the GDPs of the three countries(US, Canada and Mexico) is used; the published figure for the EU is used; while ASEAN-6 is the average of GDP for the six countries in the bloc.
Table 4: GDP Growth by Trade Bloc, Before vs After 2020
|
Bloc |
Mean growth 2015-2019 (%) |
Mean growth 2021-2024 (%) |
Change (p.p.) |
|
USMCA (US, Canada, Mexico) |
2.00 |
3.60 |
+1.60 |
|
European Union |
2.21 |
2.87 |
+0.66 |
|
ASEAN-6 |
5.03 |
4.92 |
-0.11 |
Source: Author’s calculations based on World Bank WDI data. “Post” period excludes 2020 to isolate the change from the pandemic contraction itself.
Figure 3: GDP Growth by Trade Bloc, Before vs After 2020
Source: Author’s calculations based on World Bank WDI data.
Members belonging to the USMCA have experienced the largest rise in average growth among the three groups (+1.6 percentage points). This follows on from the implementation of the agreement in July of 2020. The average growth for members of the EU saw a smaller rise (+0.7 percentage points), while members of ASEAN-6 saw a minor decline (-0.1 percentage points) as the growth prior to 2020 had been so high that there was not much room for growth after the pandemic. The increase of 1.6 points in average growth is the largest change in this table. At first glance, this seems consistent with the claim that regional agreements boost growth. Nevertheless, it is impossible to conclude whether there is a causal relationship between the USMCA and the noticeable rise in GDP since the third phase had an effect on all the regions — the average growth in the “post” phase is known to have been influenced by the high growth rates in 2021 (the biggest rise was among members of the USMCA, which suffered more from the recession back in 2010). Hence, one cannot make conclusions about the USMCA effect, at least until this is duly accounted for.
(b) Multilateral and Global Trade Agreements
Table 4 highlights GDP growth averages for the three blocs prior and after 2020. It divides the panel into a pre-2020 period (2015-2019) and a post-2020 period (2021-2024) which doesn’t include the pandemic year. The GDP of each bloc includes a separate aggregate; for USMCA, the average of the GDPs of the three countries(US, Canada and Mexico) is used; the published figure for the EU is used; while ASEAN-6 is the average of GDP for the six countries in the bloc.
Table 5: Multilateral Trade Liberalisation, 1995 vs Present
|
Indicator |
1995 (or GATT era) |
2022/23 (or present) |
Change |
|
Simple average MFN tariff (world) |
13.1% |
8.8% |
-4.3 p.p. |
|
Trade-weighted average MFN tariff (world) |
7.1% |
3.8% |
-3.3 p.p. |
|
Trade-weighted applied tariff, incl. preferences |
6.9% (1996) |
2.0% |
-4.9 p.p. |
|
World trade-to-GDP ratio |
20% |
31% |
+11 p.p. |
|
RTAs notified to GATT/WTO |
124 (1948-1994) |
400+ additional (1995-present) |
> 3x |
Source: WTO, “Thirty years of trade growth and poverty reduction” (Data Blog, Apr. 2024); WTO, World Tariff Profiles 2023; WTO, “Regional Trade Agreements – Facts and Figures.”
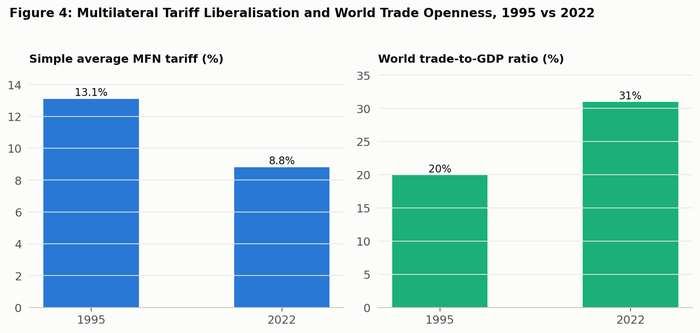
Figure 4: Multilateral Tariff Liberalisation and World Trade Openness, 1995 vs 2022
Source: WTO Data Blog (Apr. 2024); WTO World Tariff Profiles 2023.
Since the establishment of the World Trade Organization (WTO), the multilateral trading system has consistently gone through the process of liberalization: simple average tariffs nearly halved from 13.1% to 8.8%, while trade-weighted figures that take into consideration preferential access dropped even lower than that from 6.9% to 2.0%. During the same time frame, global trade indicators significantly outpaced global Gross Domestic Product (GDP) markers 5.8% compared to 4.4% respectively over the years making the global trade-to-GDP ratio rise from one-fifth to almost one-third of the world output. The same period saw the number of regional trade agreements reported to the WTO triple in comparison to the entire pre-1995 aesthetics of GATT. The depth of the tariff cut (a relative cut of 33% in terms of the simple average and 71% when accounting for preferential access) indicates that the liberalization is almost completely explained through preferential/regional agreements and not through the cut of MFN tariffs solely a quick glance at the RTA number reveals that it is the case: most of the world’s trade occurs in the conditions of preferential arrangements.
(c) Developing vs Developed Countries
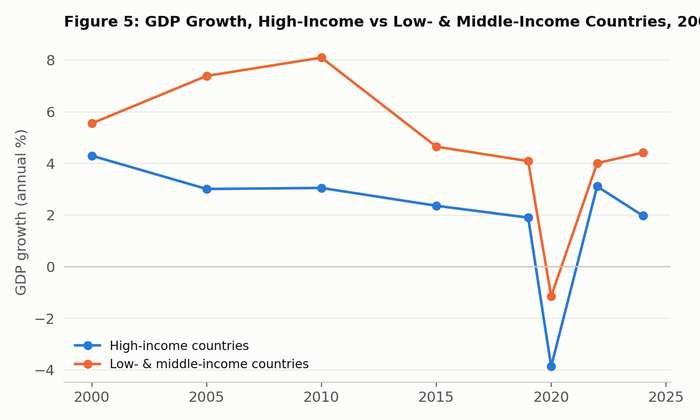
Table 6 compares GDP growth and trade openness across three World Bank income groups – high-income (developed), low- and middle-income, and low-income economies (developing) – over 2000-2024.
Table 6: GDP Growth and Trade Openness by Income Group
|
Income group |
Mean GDP growth (%) |
Median (%) |
Std. Dev. |
Mean trade openness (%) |
Openness change (p.p.) |
|
High-income (developed) |
1.98 |
2.68 |
2.32 |
56.9 |
+8.6 |
|
Low- & middle-income (developing) |
4.63 |
4.54 |
2.61 |
49.5 |
+2.6 |
|
Low-income (developing) |
3.49 |
3.57 |
2.48 |
— |
— |
Source: Author’s calculations based on World Bank WDI, years 2000, 2005, 2010, 2015, 2019, 2020, 2022, 2024.
Figure 5: GDP Growth, High-Income vs Low- & Middle-Income Countries, 2000-2024
Source: World Bank WDI data.
The economies that belong to the lower and medium class increases 2.65 percentage points each year as compared to the more developed countries during the interval cited in the chart (4.63% compared to 1.98%), a dinamic that applies to all years represented in the table with the only exception of the year 2020 (the year of the pandemic), which is when these two groups experienced a convergence (-1.15% versus -3.87%, that is, developing economies contracted less than developed nations). Nevertheless, it is evident that developed economies are still more open to trade in principle (on average, they trade around 57% of GDP since 2000, an increase by 8.6 points) than their lower and medium counterparts (50% in total, achieved with a smaller ratio, namely, the only growth by 2.6 points). Talking about the trends above mentioned in tandem indicates that the former were not of getting accompanied by trade openness and growth. Interestingly, one can conclude that developed countries deepened their trade integration during these years, which impacts the line of arguments within the topic.
(d) Physical Trade Volume and Economic Growth
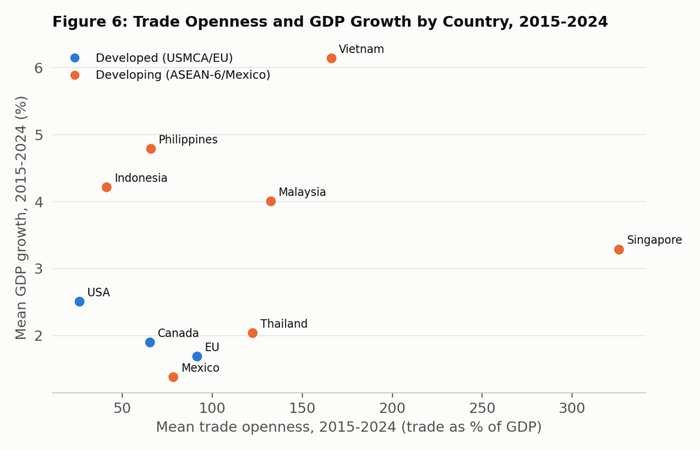
In Table 7 and Figure 6, the link between the average trade openness of each country from 2015 to 2024 and its average GDP growth is determined, making it possible to see if an important trade volume fosters economic growth. Similarly to what has been done in Section 4.3, this table works with the individual countries (Germany, France, and Italy representing the EU) rather than the EU as a single entity.
Table 7: Trade Openness and GDP Growth by Country, 2015-2024 Averages
|
Country |
Mean trade openness (% of GDP) |
Mean GDP growth (%) |
Group |
|
Singapore |
326.0 |
3.29 |
Developing (ASEAN-6) |
|
Vietnam |
166.0 |
6.14 |
Developing (ASEAN-6) |
|
Malaysia |
132.5 |
4.01 |
Developing (ASEAN-6) |
|
Thailand |
122.4 |
2.04 |
Developing (ASEAN-6) |
|
Germany |
79.5 |
0.90 |
Developed (EU) |
|
Mexico |
78.3 |
1.38 |
Developing |
|
France |
66.6 |
1.25 |
Developed (EU) |
|
Philippines |
65.6 |
4.79 |
Developing (ASEAN-6) |
|
Canada |
65.2 |
1.90 |
Developed (USMCA) |
|
Italy |
60.7 |
1.16 |
Developed (EU) |
|
Indonesia |
41.2 |
4.22 |
Developing (ASEAN-6) |
|
United States |
26.0 |
2.51 |
Developed (USMCA) |
Source: Author’s calculations based on World Bank WDI data. Shaded rows: EU member states used in place of the EU aggregate.
Note: Pearson correlation between mean trade openness and mean GDP growth across the twelve countries: r = 0.30 (n = 12).
Figure 6: Trade Openness and GDP Growth by Country, 2015-2024
Source: Author’s calculations based on World Bank WDI data.
The presence of higher openness in trade is weakly related to higher GDP growth among twelve nations (r = 0.30): Vietnam has high trade openness (at 166% of GDP) while having the highest growth rate in the sample (6.1%); however, Singapore has the highest openness (326%) yet has only an average growth rate (3.3%). The cases where trade openness matters the most have more to do with which group the countries belong (right column of Figure 6): the six developed countries (members of USMCA and EU (blue dots)) fall into a category of low growth regardless of openness level (Germany, for example, has an openness level similar to Mexico, yet it has the lowest growth rate in the table). One implication of these findings is that physical trade volume by itself does not seem to be a strong predictor of growth when the level of development is taken into consideration; it appears to be more reflective of whether an economy is a developing one instead of an indicator of how trade-intensive the economy is. This gives indications about the third specific aim of the study by suggesting that the first hypothesis which states that more trade volume translates to more growth is not supported by the data and, at the same time, strengthens the case for a multivariate approach of the testing of trade volume’s influence on growth (Section 4.6).
(e) Note on Non-Tariff Barriers and Modern/Digital Trade
The fifth sub-theme of the study – non-tariff barriers, regulations, quotas and digital trade agreements – poses a challenge when trying to fit it into the country- and year-based statistical format adopted for GDP growth and tariffs, as it deals with the different contours of agreements rather than a single numerical series. The number of RTAs which is presented in Table 5 serves as an indirect evidence for that theme because tariffs have gone down to the historic lows and greater part of trade agreement work is geared towards deep “behind the border” provisions, exemplified by regulatory cooperation and standards, as well as 20th century digital economy agreements, like Digital Economy Partnership Agreement (DEPA). More profound analysis of the given sub-theme (for example, making a comparison table of RTAs according to their presence or absence of e-commerce/digital trade chapters) is more appropriate for variablewise analysis in Section 4.5 after selection of particular agreements to be coded.
4.5 Synthesis of Findings Across the Five Sub-Themes
The descriptive and comparative evidence presented above provides a broad picture of the relationship between international trade, trade agreements, and economic growth. Across the five sub-themes examined, trade integration and economic performance are related, but the relationship is neither uniform across countries nor strong enough to support the simple conclusion that greater trade automatically produces faster economic growth. The five sub-themes are not backed by an equal weight of evidence: the regional, multilateral, developing-vs-developed, and physical-trade-volume sub-themes rest on quantitative indicators, whereas the non-tariff and modern-trade sub-theme rests on qualitative, descriptive evidence only, since no numerical index of regulatory depth or digital-trade provisions was constructed.
The interpretations below should be read as reasonable, data-consistent readings rather than as findings established with equal statistical rigor across all five sub-themes.
Table 8: Synthesis of Findings Across the Five Sub-Themes
|
Sub-theme |
Main empirical finding |
Interpretation (with caveat) |
|
Regional trade agreements |
ASEAN-6 recorded the highest average GDP growth, while USMCA showed the largest post-2020 improvement. |
Regional integration is associated with different growth outcomes across blocs, but the post-2020 USMCA improvement coincides with a general global rebound and cannot be attributed to the agreement alone. |
|
Global / multilateral trade |
MFN tariffs declined substantially while the world trade-to-GDP ratio increased. |
Tariff liberalization and the expansion of global trade moved together over the long term; this is an association, not evidence that liberalization caused the increase in trade. |
|
Developing vs. developed economies |
Low- and middle-income economies averaged higher GDP growth than high-income economies. |
Consistent with economic convergence (lower-base effects); income classification alone does not explain the full difference in growth performance. |
|
Physical trade volume |
The correlation between trade openness and GDP growth was weak, positive, and statistically insignificant (r = 0.21). |
Trade openness alone does not reliably predict GDP growth in this small, ten-observation sample. |
|
Non-tariff and modern trade measures |
RTAs have increasingly expanded beyond tariffs into regulatory and digital provisions. |
Descriptive only; no quantitative index was built, so this sub-theme cannot be compared on the same statistical footing as the other four. |
The first sub-theme, regional trade agreements, shows substantial differences among the three regional groups. ASEAN-6 recorded the highest average GDP growth in the sample, at approximately 5.0% before 2020 and 4.9% after 2020. USMCA economies recorded a lower pre-2020 average of 2.0%, rising to 3.6% after 2020, while the EU rose from 2.2% to 2.9%.
These differences indicate that trade-agreement membership does not generate a uniform growth effect; member economies’ structure, development level, and exposure to external shocks remain important. The USMCA figure in particular should be treated with caution, since the agreement entered into force in July 2020, in the middle of the pandemic shock, so its “post” growth reflects the global recovery at least as much as any effect of the agreement itself, and the two influences cannot be separated with this descriptive comparison.
The second sub-theme, the broader multilateral trading system, shows substantial liberalization between the GATT/WTO period and the present: the simple average MFN tariff declined from 13.1% in 1995 to 8.8% in 2022, the trade-weighted applied tariff fell from approximately 6.9% to 2.0%, and the world trade-to-GDP ratio rose from approximately 20% to 31%. This simultaneous movement is consistent with growing global trade integration, but it is an association observed at the global level over a long period; the descriptive evidence cannot establish that tariff reductions caused the increase in world trade, since technological change and the growth of global value chains are equally plausible contributors.
The third sub-theme, the developing-versus-developed comparison, shows that low- and middle-income economies recorded average GDP growth of 4.63%, compared with 1.98% for high-income economies, while low-income economies also grew relatively strongly, at 3.49%. At the same time, average trade openness was approximately 56.9% of GDP for high-income economies, compared with 49.5% for low- and middle-income economies. This suggests that developing economies achieved relatively high growth without reaching the same level of trade openness as high-income economies, plausibly linked to economic convergence—though the World Bank income classification is a broad grouping that also bundles together countries with very different institutions, resource endowments, and policy regimes, so convergence should be treated as one plausible contributing factor rather than a complete explanation.
The fourth sub-theme, physical trade volume, shows only a weak, statistically insignificant positive Pearson correlation of approximately 0.21 between trade openness and GDP growth at the country level. Vietnam illustrates relatively high trade openness combined with high growth, while Singapore shows that exceptionally high openness does not necessarily correspond to the highest growth rate; the United States, with the lowest openness in the sample, maintains growth close to the sample median. This indicates that trade-to-GDP ratios alone cannot explain differences in growth across this ten-country sample.
The fifth sub-theme, non-tariff barriers and modern or digital trade, is not represented by a single numerical indicator in this study. The evidence is therefore qualitative: the large expansion in the number of regional trade agreements (from 124 notified between 1948 and 1994 to more than 400 additional agreements since 1995) and the growing prevalence of provisions addressing standards, regulatory cooperation, and digital trade indicate that contemporary trade agreements have moved beyond traditional tariff reduction. This finding should be read as suggestive rather than as carrying the same statistical weight as the other four sub-themes.
Overall, the five sub-themes produce a broadly consistent picture built on evidence of uneven strength. International trade and trade agreements have expanded considerably and are associated with important changes in the global economy, but the country-level evidence does not demonstrate a simple, one-to-one relationship between trade openness and economic growth. The strongest differences relate to regional and development-group characteristics, while the weakest and most qualitative evidence concerns non-tariff and digital-trade provisions. The relationship between trade and growth therefore requires statistical testing and a cautious interpretation rather than reliance on descriptive comparisons alone.
4.6 Correlation and Regression Analysis
The descriptive analysis suggests that trade openness and GDP growth may be positively related, but the relationship appears weak. To examine this more systematically, a Pearson correlation and a simple ordinary least squares (OLS) regression are estimated using the ten countries/blocs in the core sample. The dependent variable is mean annual GDP growth over 2015–2024, and the explanatory variable is mean trade openness (exports plus imports as a percentage of GDP) over the same period. This model tests the relationship between trade openness and GDP growth, not the effect of trade agreements as such; because no direct measure of trade-agreement membership, depth, or timing enters the regression, the results below speak only indirectly to the study’s central research question.
The Pearson correlation coefficient of approximately 0.205 indicates a weak positive relationship between trade openness and average GDP growth: countries with higher trade openness tend to have somewhat higher GDP growth in this sample, but the association is small and, as shown below, not statistically significant. This is consistent with the descriptive finding in Section 4.4(d), where the correlation was reported as approximately 0.21.
GDP growth = 2.786 + 0.0037 × (Trade openness)
The coefficient on trade openness is approximately 0.0037, meaning that within this simple model, a one-percentage-point increase in trade openness is associated with an estimated increase of about 0.0037 percentage points in average annual GDP growth—so even a 100-percentage-point increase in trade openness would correspond to only about 0.37 percentage points of predicted GDP growth. The economic magnitude of this bivariate relationship is therefore limited, and the coefficient describes an association only: the model does not establish the direction of causality, and reverse causality is a plausible alternative explanation, since faster-growing economies may attract more trade rather than trade openness driving growth.
Table 9: Regression and Correlation Statistics: Trade Openness and GDP Growth
|
Statistic |
Result |
|
Number of observations |
10 |
|
Pearson correlation (r) |
0.205 |
|
R-squared |
0.042 |
|
Adjusted R-squared |
−0.078 |
|
Regression coefficient for trade openness |
0.0037 |
|
Standard error of coefficient |
0.0062 |
|
t-statistic |
0.59 |
|
p-value |
0.571 |
|
Constant |
2.786 |
The R-squared value of approximately 0.042 means that trade openness alone explains only about 4.2% of the variation in average GDP growth across the ten observations, and the adjusted R-squared is negative (−0.078), indicating that the single-variable model performs no better than a model with no explanatory variable once the loss of degrees of freedom is taken into account. Three further limitations should be noted: the model is estimated on only ten cross-sectional observations, giving it very limited statistical power; it includes only one explanatory variable, so it cannot separate the effect of trade openness from other, potentially correlated, determinants of growth; and it omits variables—such as investment, institutional quality, and human capital—that likely influence both trade openness and GDP growth simultaneously, which could bias the estimated coefficient in either direction.
The statistical significance test reinforces this interpretation: the estimated p-value of approximately 0.571 is well above conventional significance levels such as 0.05, so the null hypothesis of no linear relationship cannot be rejected for this sample. The positive coefficient should therefore not be interpreted as evidence that greater trade openness causes higher GDP growth, nor as a test of the effect of trade agreements, since the model does not include any variable representing trade-agreement membership or depth.
Figure 8: Trade Openness and GDP Growth, 2015–2024
Figure 8 shows a broad dispersion of observations rather than a strong upward pattern.
Vietnam and several other ASEAN economies combine relatively high trade openness with relatively high growth, while the United States combines low trade openness with moderate growth, and Singapore is a notable exception, combining extremely high trade openness with only moderate average GDP growth. These observations weaken the overall linear relationship. The regression therefore qualifies the descriptive analysis: although international trade is clearly an important part of economic activity, trade volume alone does not appear to be a sufficient predictor of economic growth across the ten countries and blocs examined, which supports the need for a broader analytical framework in which trade openness is considered alongside development level, institutional quality, and other structural factors, and in which trade-agreement status is measured directly rather than proxied by trade openness.
It is also important to recognize the limitations of this test in full. The regression is based on only ten cross-sectional observations, each representing a country or regional bloc rather than an individual annual observation, so it has limited statistical power. The model does not control for potential confounding factors, does not rule out reverse causality, and cannot establish causality in either direction. Because the explanatory variable is trade openness rather than a direct measure of trade-agreement membership, the regression provides only indirect and partial evidence on the study’s central research question, and should be read as descriptive evidence of association rather than a causal estimate of the effect of trade agreements on economic growth.
4.7 Discussion of Findings
The empirical findings provide a nuanced, and necessarily partial, answer to the central research question concerning the influence of international trade agreements and trade volume on economic growth. The evidence broadly supports the proposition that international economic integration is associated with higher levels of trade and has coincided with important changes in economic performance. However, the results do not support the stronger claim that trade agreements or greater trade volume automatically produce faster economic growth, and, as noted in Section 4.6, the quantitative test in this chapter examines trade openness rather than trade-agreement status directly.
The regional comparison demonstrates that trade agreements operate within very different economic environments. ASEAN-6 economies achieved the highest average growth in the sample, while USMCA economies experienced the largest improvement between the pre- and post-2020 periods; neither difference, however, can be attributed exclusively to the existence or timing of the agreements. ASEAN economies benefited from manufacturing expansion, foreign investment, export-oriented production, and integration into regional supply chains, while USMCA’s post-2020 performance was also shaped by the global pandemic recovery and by the fact that the agreement itself took effect during that recovery period. Factors such as foreign direct investment, manufacturing structure, supply-chain integration, institutional quality, and human capital are discussed narratively here because the trade literature widely recognizes them as important co-determinants of growth; they were not, however, entered as control variables in the regression in Section 4.6, so their contribution is illustrative rather than statistically estimated. A trade agreement should therefore be viewed as one component of a wider economic environment rather than an independent, quantified explanation of growth.
The global trade evidence provides stronger descriptive support for the role of trade liberalization. Between 1995 and 2022, average tariffs declined while the world trade-to-GDP ratio increased, suggesting that the international trading system became more open and interconnected over the period. Nevertheless, this expansion occurred alongside technological change, the globalization of production, improvements in transportation and communication, and the emergence of international value chains, so it is not possible to isolate tariff liberalization as the sole, or even the primary, cause of increased global trade on the basis of this descriptive evidence.
The developing-versus-developed comparison also highlights the importance of economic structure. Low- and middle-income economies recorded substantially higher average GDP growth than high-income economies over the period considered, consistent with the theory of economic convergence, in which countries with lower initial income levels can grow faster as they adopt technology, expand productive capacity, and integrate into international markets. This suggests that development stage may influence the relationship between trade and growth: a developing economy may gain substantial growth from increased exports and foreign investment even while its overall trade-to-GDP ratio remains below that of a highly developed, internationally integrated economy. At the same time, income-group classification is a broad proxy that cannot on its own capture the many institutional and structural differences among the countries it groups together.
The correlation and regression results provide the strongest qualification to a simple trade-growth hypothesis. The correlation of approximately 0.20 indicates only a weak positive association, and the regression model explains approximately 4.2% of the variation in GDP growth and is not statistically significant (p = 0.571) in this small sample. As discussed in Section 4.6, this test cannot rule out reverse causality—the possibility that faster-growing economies become more trade-open, rather than trade openness driving growth. The evidence therefore does not support the interpretation that countries simply grow faster because they trade more; instead, the benefits of trade likely depend on how trade interacts with domestic productive capacity, institutions, human capital, investment, and economic structure.
The case of Singapore is a useful illustration for interpreting this result, though it is only one country among ten and cannot, by itself, establish a general relationship between trade and growth. Singapore has by far the highest trade openness in the sample, yet its average GDP growth is below that of Vietnam, the Philippines, Indonesia, and Malaysia; conversely, the United States has the lowest trade openness in the sample but maintains moderate economic growth. Taken together with the weak, insignificant correlation for the sample as a whole, these single-country contrasts are consistent with—rather than proof of—the conclusion that trade openness should not be treated as a stand-alone measure of economic performance.
The findings also have implications for understanding the changing nature of trade agreements. Traditional trade policy focused heavily on tariff reduction and market access; however, the evidence in Section 4.4(e) shows that modern agreements increasingly address regulatory standards, services, digital commerce, intellectual property, investment, and other non-tariff issues. As tariffs have declined, these deeper provisions may become increasingly important for determining whether trade agreements generate meaningful economic benefits, though their effects are difficult to measure with a single indicator, were not quantified in this study, and require more detailed analysis in future work.
Taken together, the findings suggest that the relationship between trade agreements and economic growth is conditional rather than automatic. Trade agreements can create opportunities for market access, investment, specialization, and participation in international supply chains, but the extent to which these opportunities translate into economic growth depends on domestic and international conditions that this chapter’s descriptive and bivariate methods cannot fully isolate. The results therefore support a cautious interpretation in which trade openness is considered a potential enabling factor associated with, rather than shown to cause, economic growth in this sample.
Several limitations should be considered when interpreting the findings. First, the core country sample contains only ten countries or blocs, restricting the generalizability of the results.
Second, the use of average values can conceal important year-to-year changes and country-specific shocks. Third, the simple regression tests trade openness rather than trade-agreement status directly, does not control for other determinants of economic growth, and does not address the possibility of reverse causality, so it cannot establish causality. Fourth, the analysis of non-tariff and digital provisions is primarily descriptive, since these dimensions are difficult to capture through a single quantitative variable. Future research could address these limitations through a larger panel dataset, country and year fixed effects, additional control variables (including investment, institutional quality, and human capital), an explicit test for reverse causality (for example, using lagged or instrumented trade variables), and a more systematic index of trade-agreement depth that measures agreements directly rather than through trade openness as a proxy.
Overall, the findings indicate that international trade agreements and trade openness form an important part of the economic environment in which countries operate, but their effect on growth cannot be understood independently of development level, domestic economic conditions, and the direction of causality between trade and growth. The evidence therefore provides partial and indirect support for the research hypothesis while rejecting an overly simplified interpretation of the trade-growth relationship.
4.8 Conclusion
This section examined the empirical relationship between international trade agreements, trade volume, and economic growth using secondary data from the World Bank and the World Trade Organization. The analysis covered regional trade agreements, global trade liberalization, differences between developing and developed economies, physical trade volume, and the growing importance of non-tariff and modern trade provisions.
The findings show that substantial changes have occurred in the international trading system: tariff levels have declined considerably since the mid-1990s, global trade openness has increased, and regional trade agreements have expanded substantially, with modern agreements increasingly addressing regulatory cooperation and digital trade alongside traditional tariff reduction. These developments demonstrate the growing depth and complexity of international economic integration, though the depth dimension itself was assessed descriptively rather than quantitatively in this chapter.
At the country level, significant differences were observed in both economic growth and trade openness. ASEAN-6 economies recorded the strongest average GDP growth in the core sample, Singapore recorded by far the highest trade openness, and developing economies overall recorded higher average GDP growth than high-income economies over the longer period examined. These differences suggest that development stage and economic structure play an important role in determining economic performance.
Most importantly, the analysis does not support a simple assumption that greater trade volume automatically leads to faster economic growth. The correlation between mean trade openness and mean GDP growth was only approximately 0.20, and the simple regression indicated that trade openness explained around 4.2% of the variation in GDP growth across the ten observations. The estimated relationship was not statistically significant and, as discussed in Sections 4.6 and 4.7, cannot rule out reverse causality between trade openness and growth. The evidence therefore indicates that trade openness alone is not a strong or reliably directional predictor of economic growth in this sample.
This conclusion is more limited than a claim that trade agreements are a general enabling factor for growth, since the regression in this chapter tests trade openness, not trade-agreement membership or depth. What the evidence supports is the narrower conclusion that international trade agreements can provide a framework within which trade openness has expanded, and that this expansion has occurred alongside—without being shown to cause—improvements in economic performance. Whether the opportunities created by trade agreements are converted into sustained economic growth likely depends on market access, export capacity, investment, productivity, human capital, domestic institutions, and participation in global value chains, but these channels were discussed narratively in this chapter and were not directly tested.
The evidence therefore supports a conditional and cautious interpretation of the research question. International trade agreements and expanding trade have developed alongside economic growth and global economic integration, but the data presented in this chapter do not establish a direct or automatic causal relationship, and the regression evidence speaks only indirectly to the effect of trade agreements as such. The most defensible conclusion is that trade openness is associated with, but not shown to cause, economic growth, and that any enabling role played by trade agreements depends on the broader characteristics and development conditions of individual economies—a claim consistent with, but going beyond, what the bivariate regression in Section 4.6 alone can establish.
Future research can build on these findings using a larger country-year panel, controls for investment, inflation, human capital, government expenditure, and institutional quality, explicit tests for reverse causality, and fixed-effects or other multivariate techniques. Such an approach would provide a stronger basis for distinguishing the effect of trade agreements from the many other factors that influence economic growth, and for measuring trade-agreement status directly rather than through trade openness as a proxy.
5. Discussion
This study investigated the impact of international trade agreements and trade volumes on the economic growth of countries. The literature review and data analysis jointly suggest that trade integration is an important pillar of the global economy, but one with a conditional, indirect, and non-deterministic relationship with economic growth.
5.1 Trade Agreements and Economic Growth
The literature review found that trade agreements at the regional and multilateral levels can promote economic growth by reducing trade costs, facilitating market access, attracting investment, and transferring technology, though the extent of the effect depends on the depth of the agreements, institutional quality, economic structure, and development level.
The data analysis affirms these findings. ASEAN-6 economies recorded the highest average GDP growth, and the USMCA bloc displayed the most considerable improvement after 2020, while the European Union experienced relatively moderate growth—implying that the mere presence of a trade agreement is not, by itself, a sufficient condition for growth. Countries that combine trade openness with investment, export-oriented structures, and human-capital accumulation appear more likely to achieve growth.
These findings corroborate the literature review’s conclusion that trade agreements and multilateral cooperation instruments have varying degrees of impact on economic growth, depending on domestic structures and conditions.
5.2 Trade Volume and Economic Growth
A central research question was whether higher trade volume, represented by trade openness, would be positively correlated with economic growth. The literature review found mixed evidence: although most studies emphasize a positive association between trade volume and economic growth, particularly for emerging-market economies, the correlation is generally described as moderate, and it interacts with other factors, including trade structure, institutions, and technology.
The empirical results in this study also show a weak positive correlation (r ≈ 0.21) between mean trade openness and mean GDP growth, and a simple regression indicated that trade openness accounts for only about 4% of the variation in GDP growth. The contrasting cases of Singapore (high openness, moderate growth) and the United States (low openness, moderate growth) illustrate the broader disconnect between a country’s openness and its growth rate. This result affirms the literature review’s conclusion that trade openness is an enabling factor but rarely a driving force of growth.
5.3 Developing vs. Developed Countries
Both the literature review and the data analysis identify substantial divergence in the growth trends of developing and developed countries. Developing economies recorded substantially higher average GDP growth (4.6%) than high-income countries (2.0%), reflecting a catch-up effect in which lower-middle- and middle-income economies grow faster than advanced economies by adopting existing technology and undergoing structural transformation.
High-income countries are, on average, more open to trade, which likely reflects their greater capacity to adopt and diffuse new technology through trade linkages. These findings align with the literature review’s evidence on economic-convergence theory, which predicts that lower-income countries will tend to grow faster than higher-income ones.
5.4 Non-Tariff Barriers and Modern Trade
The literature review emphasized that modern trade agreements increasingly concern non-tariff barriers and related issues, including services, investment, and digital trade. Although the data analysis did not quantify these aspects directly, the surge in the number and depth of RTAs since the 1990s confirms the changing nature of trade: as tariff liberalization has reached most of its practical limits, the substantive content of trade agreements has become more relevant to assessing their effect on economic growth.
This study’s results corroborate the literature review’s finding that non-tariff barriers, and the inclusion of modern-trade issues in RTAs, can act as either growth factors or impediments, depending on individual countries’ needs and capabilities.
5.5 Overall Interpretation
Overall, this study’s findings demonstrate that international trade agreements and trade volumes can shape the global economy but are not consistently associated with higher economic growth across all countries. The literature review and data analysis together identify substantial variation in economic growth within and between countries, which undermines any uniform assessment of trade liberalization’s impact on growth. In particular, the data analysis found that RTA-related growth benefits are largely a regional phenomenon, with ASEAN-6 recording the highest average growth, and that developing economies tend to grow faster than developed ones—indicating that international trade agreements and volumes are only one factor among many that shape economic growth.
6. Conclusion
This study investigated the impact of international trade agreements and trade volumes on the economic growth of countries. It employed a mixed-method research design that combined a thematic literature review of scholarly articles with a descriptive analysis and simple statistical examination of secondary data from the World Bank and the WTO to explore trade-related trends.
The literature review found that trade agreements can reduce barriers, attract foreign investment, and transfer technology, but that their impact is often conditional on other factors. The data analysis corroborated that trade liberalization has enabled a significant rise in international trade, including the reduction of tariffs, an increase in global trade-to-GDP ratios, and a substantial rise in the number of RTAs. However, the relationship between openness and growth at the country level is weak.
The most notable finding was that ASEAN-6 recorded the highest average GDP growth, and that the USMCA bloc showed the largest improvement after 2020, indicating that international trade agreements’ growth benefits are predominantly a regional phenomenon and that economic growth is profoundly shaped by a country’s development status and structural transformation. The finding that low- and middle-income economies grew faster than high-income ones on average is consistent with economic-convergence theory. Overall, the evidence implies that trade agreements and trade volumes are an important, but conditional, contributor to economic growth.
6.1 Limitations and Future Research
This study is limited by the small size of the core dataset (ten countries/blocs) and by its use of averages, which conceal considerable country-level variation. Future research could employ a larger dataset and a more sophisticated statistical model that incorporates control variables; the current study applied only a simple bivariate regression, whereas a trade agreement’s growth effect could be assessed more rigorously with a fixed-effects model. Future studies could also systematize the variables that reflect the depth of trade agreements to develop a more comprehensive assessment tool.
Despite these limitations, this study provides a nuanced perspective on the relationship between international trade agreements, trade volumes, and economic growth. Overall, the findings demonstrate that trade liberalization is an important enabling condition for economic growth but is not, by itself, a primary driver of growth. Trade agreements and trade volumes are an important enabler of growth—one that integrates economies, reduces barriers, attracts investment, and facilitates technology diffusion—but their effect interacts with other variables, including institutional frameworks, development stage, and structural transformation.
Works Cited
Bekkers, E., et al. (2025).
Busse, M., & Königer, J. (2012).
Calderon, C., & Cantu, C. (2019).
Díaz-Mora, C., et al. (2024).
Gamso, J., & Postnikov, E. (2022).
Guillén, M., et al. (2023).
Leonardi, M., & Meschi, E. (n.d.).
Okoro, C., et al. (2020).
Palit, A. (2017).
Peressotti, P. (2025).
Sunge, R., & Ngepah, N. (2019/2020).
Taglioni, D., & Kee, H. L. (n.d.).
Vamvakidis, A. (1998).
Wacziarg, R., & Welch, K. H. (2001).
World Bank. (2025). World Development Indicators [Data set]. https://databank.worldbank.org/source/world-development-indicators
World Trade Organization. (2023). World tariff profiles 2023. WTO; International Trade Centre; UNCTAD. https://www.wto.org/english/res_e/publications_e/world_tariff_profiles23_e.htm
World Trade Organization. (2024, April 24). Thirty years of trade growth and poverty reduction. WTO Data Blog. https://www.wto.org/english/blogs_e/data_blog_e/blog_dta_24apr24_e.htm
World Trade Organization. (n.d.). Regional trade agreements: Facts and figures. https://www.wto.org/english/tratop_e/region_e/regfac_e.htm