AUTHORS:
ANUSHKA SHARMA, ARYA SHINDE, DEBDATTA DAS, HARSHINI CHAVVA, NIKITA JOON, SAMRA SIDDIQUI, TAALYAH AHMAD
1. ABSTRACT
The United Nations General Assembly (UNGA) serves as an important forum for countries to share their views on international issues by voting. The trends of agreement and disagreement in UNGA resolutions show how political relationships and connections among member states are changing. This research investigates emerging geopolitical alliances through dynamic network analysis of voting behavior at the United Nations General Assembly (UNGA).
Investigation of UNGA voting data provides an important basis for understanding political alignment among UNGA member states and alliances that are not formally established through treaties. Existing studies examine political alliances as monoliths, making it difficult to understand the evolution of alignments over time.
To address this research gap, this study adopts a secondary quantitative research methodology based on UNGA voting records from 1946 to 2025. The social network analysis (SNA) approach is applied to examine voting agreements and identify emerging blocs within the network.
The dynamic network approach was used to examine changes in geopolitical alignment across voting sessions and distinguish persistent communities from shifting patterns of alignment. Across the full 1946–2025 record, the network organized into 56 communities across 241 countries. In the separate comparison of 163 countries between 2000–2010 and 2011–2020, 55 remained within the same alliance community (44 stable and 11 growing), while 108 shifted to a different community (87 emerging and 21 realigning).
The model identified three major alliance communities with an average classification confidence of 86.76%. The results are not static but dynamic, as reflected in UNGA voting behavior and capable of significant reconfiguration over time.
This study demonstrates the value of integrating voting-based preference measures with dynamic network analysis, which detects evolving patterns of international political alignment and emerging geopolitical alliances.
Keywords:
United Nations General Assembly (UNGA); Geopolitical Alliances; Voting Behavior; Political Alignment; Emerging Alliances; Network Analysis
2. INTRODUCTION
Does the United Nations remain relevant in a 21st century defined by a shifting world order and persistent conflict? As Russia invades Ukraine and violence consumes the Gaza Strip, Sudan, and Myanmar, the General Assembly continues to convene, debate, and vote, yet the conflicts often persist unabated. This reality prompts a serious inquiry into the organization’s modern purpose, a question this study addresses directly rather than dismissing.
The answer lies in the UN’s fundamental design. Established on June 26, 1945, in San Francisco, the UN was built upon the lessons learned from the failure of the League of Nations. While the UN Charter granted veto power to the Security Council to manage global security, the General Assembly was designed without an army or enforcement mechanism. Its resolutions are, by intention, non-binding. However, this apparent weakness is precisely what makes it a uniquely valuable source of data. Because casting a vote carries no direct military or economic cost, a state’s voting pattern becomes one of the clearest and most consistent signals of its patterns of political alignment, often revealing shifts in alignment long before they are formalized into treaties or alliances.
This study leverages that signal by analyzing 947,434 recorded votes cast between 1946 and 2025. It treats UN voting records not as a measure of the organization’s ability to stop conflict, but as a detailed map of the political relationships forming and dissolving around those conflicts. When a bloc of 119 nations centered on Senegal shifts within a decade to a bloc of 125 centered on Thailand, or when 87 countries drift towards a dominant coalition, these records capture changes in geopolitical alignment, regardless of whether a resolution alters the immediate situation on the ground.
Ultimately, while the UN may not always prevent war, its voting floor serves as an early indicator of shifting global alliances. By examining the voting record itself, this study identifies emerging geopolitical alignments through observed voting patterns before such changes are reflected in other forms of diplomatic activity.
To access it, this study sets out to understand the various parameters on which alliances have been formed amongst the various nations of the world and how these nations form a network of alliances within the United Nations General Assembly’s voting record. In the 21st century, hegemonic powers face sustained competition not from rival superpowers alone but from an increasingly assertive Global South, and the terrain of competition has shifted accordingly from the rigid architecture of military alliances and formal diplomacy toward the more fluid diplomacy of soft power. In spite of the various conflicts unfolding around the world, the UN stands firmly on the core principles and objectives on which it was formed, namely sovereignty and the pursuit of peace among its member nations.
This study adopts applied network analysis to conduct a critical analysis of voting patterns in the United Nations. Returning to the question posed at the outset, whether the UN retains relevance in a century defined by persistent conflict, this study suggests the answer lies not in the organisation’s capacity to resolve disputes, but in its voting floor’s capacity to register realignment before that realignment becomes visible elsewhere. The near-complete restructuring in centrality rankings between the 2000s and 2010s, and the substantial share of states identified as emerging or realigning rather than settled, indicate that the General Assembly continues to function as a live record of a changing global order. Future work extending this comparative framework across additional decades, or testing it against non-UN measures of alignment such as trade and sanctions data, would help establish how consistently this fluidity holds beyond the periods examined here.
LITERATURE REVIEW & RESEARCH GAP
Overview
Geopolitical alliances based on voting patterns in the UN have become an essential area of scientific investigation due to the fact that voting behaviour represents a certain pattern of political interest and relations of countries. Even though such alliances cannot be officially established by means of a treaty, voting behaviour gives valuable information about cooperation or differences between countries in global politics. Moreover, analysing voting patterns is also helpful for tracing new alliances and for tracking changes in global politics.
The first theme presents theories and concepts of alliances and polarity, giving an insight into the way scholars considered cooperation and rivalry of states in different periods of time. The second theme is related to network analysis and gives explanations about the effect of different approaches to creating a voting network on the revealed alliances. The third theme presents previous research on the issue of UN voting behavior paying special attention to the measures of political alignment.
Together, these three themes provide a clear understanding of the existing research while highlighting areas that require further investigation.
Theme A: Theories of Alliances & Polarity in the UN General Assembly
A literature review does more than summarise what has already been written on a topic. It shows where scholarly understanding is settled, where it is still debated, and where there is room for new work. This theme takes up the theoretical foundations of alliance formation and polarity, tracing how successive generations of scholars have tried to read cooperation and rivalry among states through a body, the UN General Assembly, that has no authority to bind any of them.
The idea driving this line of inquiry is that a vote with no binding consequence reveals something a formal treaty cannot: not what a state agrees to be bound by, but what it actually prefers. Russett (1966) demonstrated this directly, showing that voting records, read on their own terms and without reference to any treaty or formal agreement, could reveal coherent groupings of states that functioned like alliances in practice. The finding matters beyond the specific blocs it identified: it suggests that a state’s revealed preferences, combined across enough votes, can stand in as a proxy for its political alignment.
What that alignment tracks, however, has not stayed constant. Kim and Russett (1996) showed that after 1991 the Cold War’s East-West divide, which had shaped Russett’s original blocs, gave way to a North-South divide built more around development and economic position than ideology. The finding matters for more than historical interest: it shows that the Assembly’s underlying polarity is not fixed but shifts in response to changes in global power, and that any bloc-detection method tuned to one era risks going stale once that divide moves again.
A similar realignment appears to be under way now. Nurullayev and Papa (2023) examined roughly 1,500 votes between 1991 and 2020 on which the United States and the China-Russia bloc disagreed and found that developing states sided against the United States more often than traditional accounts of American influence would predict. Istomin (2018) reaches a related conclusion from a different angle, tracking voting support for each of the three powers and finding that support for the United States consistently trails support for China. Read together, these findings update Kim and Russett’s North-South account for the present decade and suggest that their earlier finding may have been one stage on a longer, still-unfolding path rather than a settled new axis.
This instability runs deeper than the behaviour of individual major powers. Even blocs that look unified, such as BRICS, show voting cohesion that varies considerably by issue: members may agree on some questions and split on others, such as disarmament or human rights, and a change in a state’s domestic leadership can shift its voting pattern within a single election cycle. The overall picture is not one of a few durable camps but of alignments that form around specific issues and dissolve once those issues pass. That creates a real methodological problem: a bloc identified within any single period may reflect a coalition assembled for that period’s agenda rather than a lasting alliance.
Two recent studies suggest the theoretical vocabulary itself may need to expand. Fartyshev (2025) proposes a graded scale running from friendliness to hostility for classifying bilateral ties to Russia, arguing that a simple friend-or-adversary framework cannot capture the texture of state relationships. Steinert and Weyrauch (2024) test whether membership in China’s Belt and Road Initiative produces measurable voting convergence and find that economic ties do not reliably translate into political alignment. Both studies arrive at a related conclusion from different directions: alliance, as it shows up in the Assembly’s voting record, is not a fixed status but a variable position a state occupies, one that a two-category framework cannot really describe.
Taken as a whole, this body of theory shows something a static reading of any single UNGA session cannot: that polarity has a history, that the dividing line among states has shifted before and is likely to shift again, and that even the blocs considered most cohesive depend on the issue at hand rather than holding fixed. What this theoretical foundation cannot do on its own is track that movement as it happens, rather than reconstructing it after the fact from a single aggregated snapshot. That is the task taken up by the network-analytic approach introduced in the next theme.
Theme B: Networks and Alliances in Political Science
As the previous theme noted, network analysis, particularly within international relations, has drawn heavily on UNGA voting data to trace voting trends and the emergence of alignments and blocs. Voting similarity is treated as a proxy for relationship: states become nodes, voting agreement becomes the edges connecting them, and the resulting network can be studied using Social Network Analysis (SNA).
Network centrality measures help assess influence within that structure. Where traditional statistical methods tend to highlight aggregate voting trends, SNA can pick out the states that sit structurally central enough to shape voting coalitions. Despite the overwhelming vote strength one might expect the United States to carry, global voting patterns do not consistently cluster around it; instead, they cluster elsewhere, with China-Russia-aligned blocs drawing stronger support and standing out as an alternative centre of network attraction (Nurullayev & Papa, 2023).
Community detection, one of SNA’s central applications in international relations, uses modularity-based methods to identify relatively stable geopolitical blocs within UNGA voting. Historically, the global voting pattern shifted from an East-West to a North-South structure, with G-77 alignment dominating the post-Cold War era. Different ways of specifying the network, whether weighted, signed, or bipartite, can yield different community structures (Macon, Mucha & Porter, 2012), which shows that how the network is built shapes what community detection finds. Even so, the broad picture of these structures tends to hold up reasonably well across different specifications.
Homophily, the tendency of similar actors to link with one another, shows up strongly in state voting patterns. Membership in formal and informal groupings such as NATO, BRICS, SCO, and G-77 correlates strongly with states’ levels of voting agreement, supporting the idea of “affinity communities”, or states that vote together repeatedly (Nurullayev & Papa, 2023). How that similarity is measured matters a great deal, though: S-scores can confound genuine preference similarity with a shifting agenda, whereas dynamic ideal-point models are better able to isolate real preference convergence over time (Bailey, Strezhnev & Voeten, 2015).
Quantitative methods are also used to study the dynamics of voting alignment within international organisations, examining how political and economic preferences shape state behaviour. Network-based analysis can surface patterns of alliance formation and influence hierarchies, showing how institutional settings and self-interest interact to shape cooperation, policy coordination, and the emergence of voting blocs (Mosler & Potrafke, 2020).
Even with its wide use, SNA research keeps developing new methods to sharpen interpretation given the incompleteness of the underlying data and to apply more rigorous techniques, including accounting for missing votes, drawing on the information carried by negative relations, and using dynamic or signed networks (Khan, 2020; Fjelstul et al., 2025).
Together, these methods shape how research on UNGA voting is designed: network analysis, dynamic voting-similarity measures, and centrality measures combine to give a clearer picture of influence structures in international politics. This study follows that direction by building a weighted network from the full range of voting information, including negative votes, and applying community detection to recover the emergent bloc structure and how state preferences shift over time.
Theme C: Prior Studies on UN Voting Behaviour
The traditional S-score has a well-documented weakness: it cannot separate a genuine shift in a country’s political preferences from a shift in what happened to be on the Assembly’s agenda that year. As a result, countries can appear to move closer together or further apart even when their actual foreign policy hasn’t changed at all. A dynamic ideal-point approach addresses this by tracking resolutions that recur across sessions, making it possible to identify real preference change rather than noise from a shifting agenda (Bailey et al., 2015).
Once this corrected method became available, researchers put it to work on real political questions. Voting agreement between the US and many of its Western allies declined during the Trump presidency, particularly on Middle East-related resolutions (Mosler & Potrafke, 2020), while participation in China’s Belt and Road Initiative did not generally pull countries’ voting closer to China; several European countries actually drifted further away (Steinert & Weyrauch, 2024). Read together, the two findings point in the same direction: closeness to a major power, whether through political alliance or economic partnership, does not reliably translate into closer voting alignment, and in both cases it was the corrected, agenda-adjusted measure that made the divergence visible rather than obscured by shifting agendas.
A separate concern involves the completeness of the underlying data. Restoring previously omitted votes and amendments has been enough to change earlier published conclusions (Fjelstul et al., 2025), and UN voting records, sanctions data, and media-based risk indices capture different aspects of international relations rather than the same thing (Adarkwah et al., 2026). Looking only at voting similarity can also overlook real political preferences that only become visible once disagreements are examined alongside agreements (Khan, 2020).
Taken together, these studies confirm that UN voting is a valuable source for understanding political alignment, but only when paired with accurate measurement, complete data, and careful interpretation, leaving clear room for this study’s contribution.
Based on the literature review conducted, it may be assumed that voting behaviour in the United Nations General Assembly offers an insightful understanding of cooperation, competition, and political alliances between states. In all the discussed areas, authors suggest that patterns of voting reflect the existing and developing relations between states regardless of whether they have any formal alliances or treaties. Also, the literature demonstrates that alliances are dynamic and change due to changes in global politics, national interests, political leadership and other significant events.
However, researchers do not agree regarding the interpretation of voting patterns. Some researchers apply the concept of alliances and the theories of alliances to analyse changes in the balance of power in the global arena. Others use the approach of network analysis to detect voting communities and powerful states. There are also those who claim that reliable conclusions may be obtained only when political alignment is considered properly and supported by voting data.
Thus, the literature demonstrates that there is no single way of comprehending geopolitical alliances. A combination of theories about alliances, network analysis, and valid measurements of political alignment leads to a better insight into the dynamics of cooperation and evolution of alliances.
Research Gap
By now, UNGA voting is a fairly well-accepted way to read political alignment, and network methods have proven useful for surfacing the geopolitical communities sitting inside it. Where this body of work falls short is in showing how that alignment came to be or where it might be headed.
Modularity-based community detection, for example, usually settles on one bloc structure for the period studied, rather than following how that structure moves from one stretch of time to the next (Macon, Mucha & Porter, 2012). This is not a minor omission. A network built by folding together decades of voting behaviour will show persistent patterns of similarity, but it can just as easily hide real reorganisation happening underneath those patterns. A country that looks like a settled member of one bloc in an aggregated network may, in reality, have moved between communities entirely as its circumstances changed. So a static snapshot risks describing geopolitical alignment as something fixed when it may still be very much in motion.
A second gap concerns how voting behaviour itself gets treated. Much of the existing work reduces voting to a simple agreement-or-disagreement split or sets abstentions aside as missing data, even though doing so can hide real political positions that only become visible once disagreement is read alongside agreement (Khan, 2020). Abstention is not the same as opposition, and it is rarely just non-participation either. Given how rarely states vote outright “No,” abstention is often exactly where a country’s real position shows itself. Treating it as noise weakens the very signal a voting network is meant to capture, which matters most when the goal is to catch subtle shifts in alignment rather than confirm blocs everyone already knows about.
Both gaps come back to the same underlying problem. Research on UNGA voting has grown more sophisticated at identifying where alignment sits, but has paid comparatively little attention to building a network representation that keeps the real texture of voting behaviour intact while also tracking how alliance structure shifts over time. This study addresses that gap by encoding Yes, No, and Abstain as distinct signals, using cosine similarity to build weighted UNGA voting networks, and comparing those networks across periods. Rather than asking only where geopolitical blocs sit, the analysis asks which relationships hold steady, which reorganise, and where new alignments are starting to take shape. The real question is not simply where states align, but whether that alignment is stable or already shifting.
3. RESEARCH METHODOLOGY
Research Design
This study uses a quantitative, longitudinal network-analytic design to examine how geopolitical alliances among United Nations member states emerge and change over time. The design is built around Social Network Analysis (SNA), which treats each UN member state as a node and each pair’s voting similarity as an edge, so that alignment can be studied as a structural property of the whole Assembly rather than as a set of separate, unconnected positions. This design suits the research problem because the central question is not simply where a state sits relative to others, but which states are currently moving together and whether that grouping has changed, a question that ideal-point or roll-call scaling methods alone are not built to answer. To capture that movement rather than a single fixed picture, the network is built once across the full historical record and then compared across two comparison periods (2000– 2010 and 2011–2020), so the design captures both where alignment currently sits and how it has moved.
Nature of the Study
This is a secondary quantitative study. It works entirely with existing, publicly available UNGA voting records rather than collecting new data through surveys or interviews, and the analysis itself is numerical and computational: voting similarity is calculated mathematically, and alliance structures are identified through network measures such as centrality and community detection rather than through thematic coding. This fits the research problem well and helps close the gap identified in the literature review. Alliances between states are often treated as fixed, but examining UNGA voting across many sessions makes it possible to see how alignment and divergence between countries actually shift over time. A dynamic network approach is used here specifically to move past the static, single-snapshot view that most earlier research has relied on.
Sample and its Technique
The population for this study is every United Nations member state with a recorded voting history in the UNGA voting dataset, which spans 947,434 recorded votes cast between 1946 and 2025. Rather than narrowing the focus to a specific bloc, this study uses a total population (census) approach: the voting record of every member state is pulled in across the sessions and resolutions covered by the dataset. This fits the study’s goal, since the aim is to identify emerging alliances across the whole Assembly rather than to confirm patterns within one already-known group.
Two scopes of this population are used depending on the stage of analysis. The full-period network draws on all 241 member states with sufficient voting history across the entire 1946 to 2025 record. The two-period comparison narrows this to a common subset of 163 countries that participated in at least 75 percent of recorded votes in both the 2000 to 2010 and 2011 to 2020 windows, so that each country’s movement classification rests on a fair, comparable voting record in each period rather than a partial one. The dataset itself includes roll-call voting records with country name, vote, date, session, resolution number, resolution title, and subject, drawn from the publicly available UNGA voting archive, and the voting decisions were standardised and encoded so they would be consistent and usable for network construction. Using the full population like this keeps sampling bias low, and because the resulting picture covers the Assembly as a whole rather than a partial slice of it, it stays genuinely comprehensive.
Variables Used
Three kinds of variables run through this analysis. The independent variables are the voting session and year, which fix each vote in time, and the two comparison windows, 2000 to 2010 and 2011 to 2020, used to see how alignment moves. The dependent variables are the cosine-similarity voting-agreement scores between country pairs, and the network measures built from them: degree centrality, PageRank centrality, and community membership, which together show how central a state is and which alliance grouping it belongs to. Each country’s movement between the two periods is also captured through a four-category classification, stable, emerging, growing, or realigning, which serves as a further dependent measure of how its alliance position changed. The main analytical control sits in the vote-encoding scheme itself: votes are coded as Yes (1), No (−1), Abstain (0), and Absent (missing), which keeps abstention as a distinct, meaningful signal instead of folding it into agreement or treating it as missing data. This consistent encoding is what keeps the similarity scores comparable across countries and sessions.
Ethical Consideration
Since this is a secondary quantitative study, the ethical considerations here differ from research involving human participants, and indeed none were involved, as the study relies entirely on publicly available UNGA voting records and previously published academic work. Every data source and piece of prior scholarship is properly attributed to keep things academically sound. The analysis is also kept as objective as possible, without favouring any particular country, political bloc, or international body in how the voting behaviour is interpreted. Care was taken throughout to avoid using the voting records selectively or in a misleading way, so the findings stay reliable and credible.
Limitations
A few limitations follow directly from this design. Even with a full population sample, some historical voting records, particularly from the earlier decades of the dataset, may still be incomplete or inconsistently documented, which can affect the completeness of the full period network. Voting similarity is also only an indirect proxy for a country’s actual foreign policy position: it captures how two states voted, not the diplomacy or bargaining behind the vote, so it cannot fully capture informal alignment happening out of view. Because the full period network draws on all 241 countries while the two-period comparison is restricted to a common subset of 163 countries with sufficient voting activity in both windows, the two analyses operate at different population scales and should not be read as directly reconciled figures, even though both are valid for what they measure. Finally, the community and movement classifications rest on a similarity threshold and a Louvain partition that could shift slightly under a different parameter choice, so genuinely new alliances can be hard to tell apart from short-term, temporary shifts in voting.
4. DATA ANALYSIS AND INTERPRETATION
Introduction
Existing work on United Nations General Assembly (UNGA) voting, most notably Voeten’s ideal-point estimates, is well suited to placing states along a single ideological spectrum but says comparatively little about how the bloc structure surrounding that spectrum reorganises over time. Ideal-point and roll-call scaling approaches are built to answer where a country sits relative to others, which is a different question from which countries currently move together and whether that grouping has changed. The latter question is better suited to network methods, which represent each country as a node and each pair’s voting similarity as an edge, so that alignment becomes a structural property of the whole Assembly rather than a set of independent coordinates.
This chapter addresses that gap in two stages. It first builds a similarity network across the entire 1946 to 2025 record to establish where alignment concentrates once every session in the dataset is folded together, and then compares that network across two comparison periods, 2000 to 2010 and 2011 to 2020, to establish how alignment actually moved. The aim throughout is to show not only where alignment sits, but how it moves, and to do so using a vote-encoding scheme that keeps abstention as a meaningful signal in its own right, rather than treating it as agreement or as missing data.
Data and Method
The dataset comprises 947,434 recorded UNGA votes spanning 1946 to 2025, reduced to eight fields relevant to voting relationships: country code, country name, vote, date, session, resolution number, resolution title, and subject. Fields that play no role in constructing voting relationships, such as vote notes and committee reports, were dropped at this stage. The data required little cleaning: the subjects field was the only column with missing values, and since it does not factor into how a country voted, those gaps were left as they were; no duplicate records were found.
Voting decisions were encoded numerically as Yes (1), No (− 1), Abstain (0), and Absent (missing), a scheme that treats abstention as a distinct diplomatic signal rather than folding it into agreement or absence. This choice matters in practice: across all 947,434 recorded votes, outright “No” votes are the smallest category by far, at under 5% of the total, well behind abstentions and absences. With opposition this rare, a country’s position often reveals itself more clearly through when it abstains than through when it votes against a resolution outright, which is what the encoding is designed to preserve.
Voting similarity between countries was computed using cosine similarity on the encoded records, and the resulting similarity matrix was used to construct weighted networks analysed in Python, using pandas for data handling, scikit-learn for similarity calculation, and NetworkX for network construction, centrality measures, and community detection. Community structure was extracted with the Louvain algorithm, and structural influence was measured with degree centrality and PageRank. The full-period network uses all 241 member states with sufficient voting history in the dataset; the two-period comparison restricts this to a common subset of 163 countries with comparable voting activity in both windows, so that a country’s movement classification rests on a fair record in each period rather than a partial one.
Within each detected community, the leading country was identified as the member with the highest degree centrality within that community; this label is used only to distinguish communities and does not imply formal political leadership.
Full-Period Network Structure (1946–2025)
Across all 241 member states present in the dataset, degree centrality was highest for Guyana and Senegal (0.4375), followed closely by Jamaica, Nepal, Bahrain, the United Arab Emirates, and Sri Lanka. None of these are conventionally described as major powers, which is the point worth noting: degree centrality here measures how many other states a country’s voting record resembles, not political weight or agenda-setting influence, so a high score reads closer to “diplomatically unobjectionable to many” than “powerful.”
The strongest pairwise similarities were concentrated regionally, with Gulf, Baltic, and Nordic groupings emerging as the tightest contemporary clusters, tracking geography and shared bloc membership more closely than looser, aspirational groupings such as BRICS (Table 1.1). The single highest similarity in the whole dataset, however, belongs to the Byelorussian SSR and the Ukrainian SSR at 0.9948, a historical artefact of Soviet-bloc voting practice rather than an active contemporary alliance.
|
Country 1 |
Country 2 |
Similarity |
|
Byelorussian SSR |
Ukrainian SSR |
0.9948 |
|
Bahrain |
United Arab Emirates |
0.9776 |
|
Bahrain |
Qatar |
0.9736 |
|
Estonia |
Lithuania |
0.9712 |
|
Latvia |
Lithuania |
0.9706 |
|
Belgium |
Luxembourg |
0.9676 |
Table 1.1: Highest pairwise voting-similarity scores, full period (1946–2025).
Louvain community detection identified 56 communities, dominated by one bloc of 81 countries consistent with G-77 and non-aligned consensus voting, surrounded by several mid sized communities of 32, 29, and 20 countries and a long tail of single-country outliers whose voting record did not collapse neatly into any larger cluster (Figure 1.1). The network is locally dense but globally efficient: a density of 0.162 indicates that roughly 16% of all possible country pairs cross the similarity threshold used to define a connection, and a clustering coefficient of 0.647 shows that countries sharing one connection are very likely to share a third, a signature of tightly knit voting cliques rather than loose, sprawling ties. With 52 connected components and an average shortest path of 2.54 among connected states, most connected countries are separated by only two or three intermediate ties.
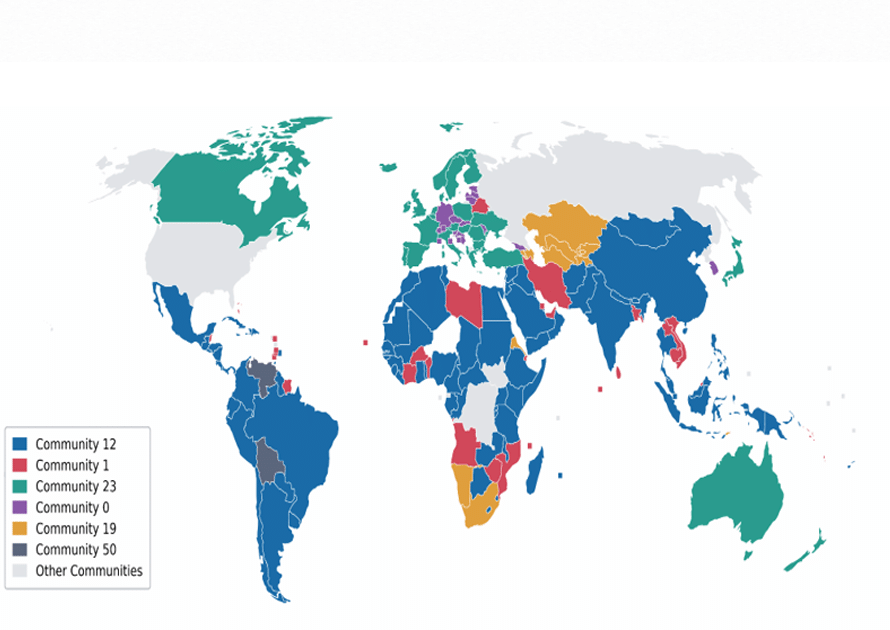
Figure 1.1: Geopolitical communities detected in the full-period (1946–2025) voting network.
Alliance Change Across Two Periods (2000–2010 vs. 2011–2020)
The full-period network above shows where voting alignment sits once every year in the dataset is folded together, but it cannot show whether that alignment is stable or in motion. To examine movement directly, the analysis compared two networks built from a common subset of 163 countries with sufficient voting activity in both windows, so that each country’s movement classification rests on a fair, comparable voting record in each period. This is a smaller population than the 241 countries used in the full-period network above, and the two should be read as operating at different scopes, a full 1946 to 2025 sweep against a filtered two-period comparison, rather than as directly reconciled figures.
The two-period comparison uses a common subset of 163 countries with sufficient voting activity in both windows, defined as participation in at least 75% of recorded votes in each period. The restriction ensures that each country’s movement classification rests on comparable voting records in each period, preventing spurious classification changes that could arise from differential participation levels. The full-period and two-period analyses therefore operate at different scopes and should be read as complementary rather than directly reconciled.
The largest community reorganised around a different anchor country entirely. A Senegal-led bloc of 119 countries in 2000 to 2010 gave way to a Thailand-led bloc of 125 countries in 2011 to 2020, with the earlier Senegal-led grouping effectively absorbed into the new one. A separate Slovenia-led community remained comparatively stable across both windows, holding at 47 and then 46 countries (Figure 1.2), which indicates that the reorganisation was concentrated in the dominant bloc rather than distributed evenly across the whole network. This result demonstrates that one large bloc reorganised around a different anchor country between the two periods, a pattern that a single full-period snapshot cannot capture.
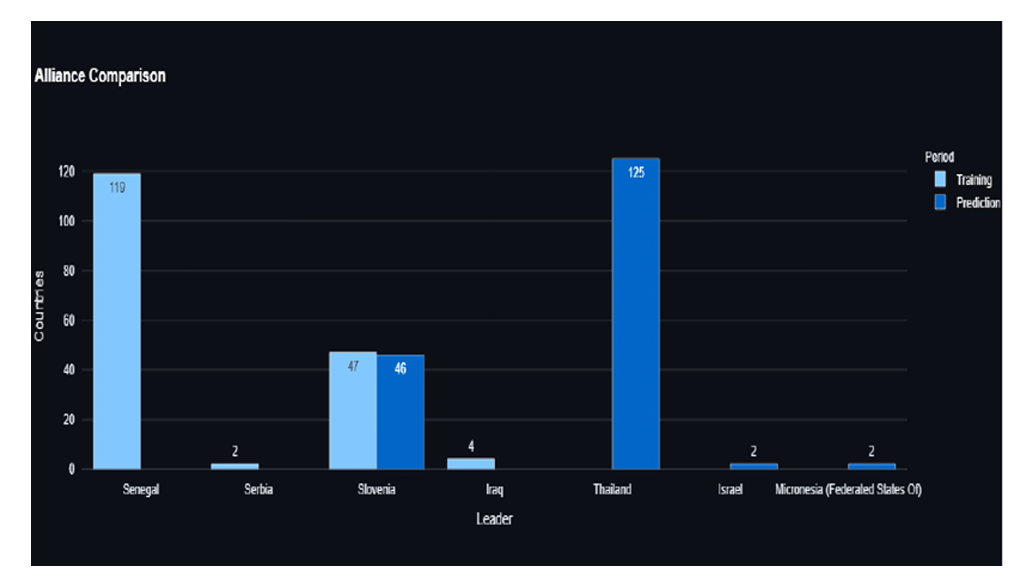
Figure 1.2: Alliance community size by leading country, 2000–2010 versus 2011–2020.
Structural influence, measured by PageRank, turned over almost completely between the two periods. In the training period, Maldives, Senegal, Mali, Sri Lanka, and the United Arab Emirates ranked highest; in the second period, the ranking shifted to Suriname, Bangladesh, Sri Lanka, Singapore, and Malaysia (Figure 1.3). Sri Lanka and Bangladesh are the countries appearing in both top-ten lists. This near-complete turnover is a striking result in its own right: it suggests that structural influence in this network is not a fixed property of a small, consistent set of central states but something that shifts substantially between periods, directly demonstrating the kind of influence-tracking that a single static centrality snapshot cannot capture.
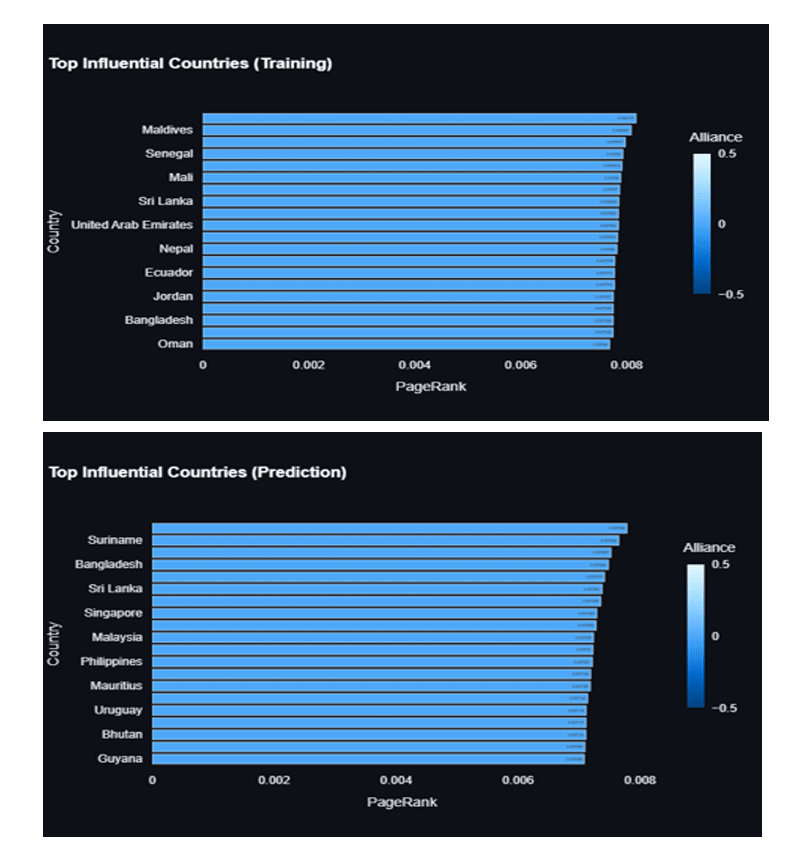
Figure 1.3: Top ten countries by PageRank centrality, training period (2000–2010, left) versus second period (2011–2020, right).
These structural shifts are reflected at the level of individual countries. Each of the 163 countries analysed was classified according to how its alliance membership changed between the two periods: stable, emerging, growing, or realigning. Overall, 55 countries remained within the same alliance community across both windows, while 108 shifted to a different one, with an average classification confidence of 86.76% across all countries (Figure 1.4;
Table 1.2). Among the 108 countries that shifted communities, 87 were classified as emerging and 21 as realigning, while the 55 countries that remained in the same community comprised 44 stable and 11 growing countries.
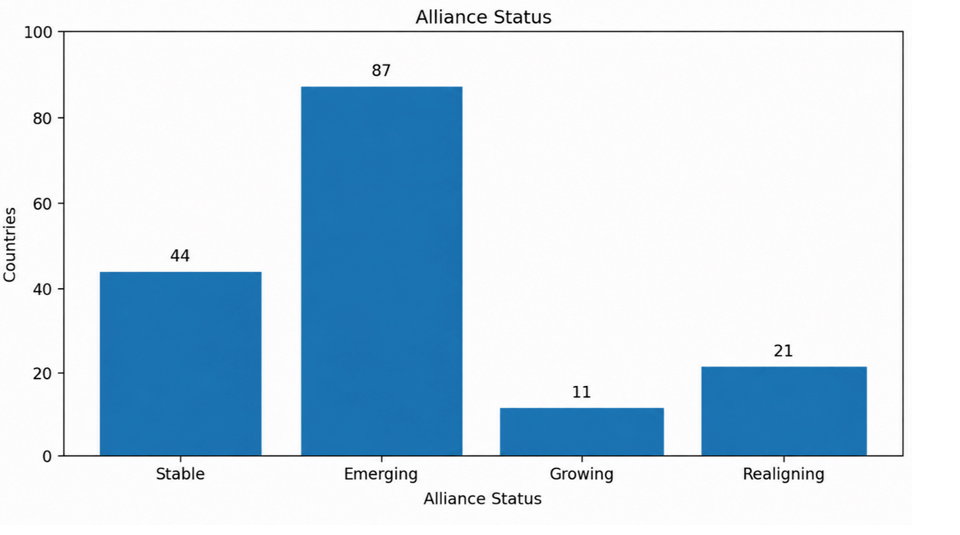
Figure 1.4: Country-level alliance status, 2000–2010 to 2011– 2020.
|
Metric |
Value |
|
Countries analysed |
163 |
|
Remained in same alliance |
55 |
|
Shifted to a different alliance |
108 |
|
Average classification confidence |
86.76% |
Table 1.2: Country-level movement summary, 2000–2010 to 2011–2020.
To interpret the nature of these shifts, each of the 163 countries was further classified according to how its alliance position changed between periods. Four categories were defined.
Stable: Remained within the same community in both periods, indicating persistence of existing alignment
Emerging: Moved from a smaller community into the dominant Thailand-led community, suggesting incipient alignment with a consolidating bloc
Growing: Remained in the same community but increased in centrality within it, indicating deepening of existing alignment
Realigning: Moved from one major community to a different major community, representing a substantive shift in geopolitical orientation
Among the 108 countries that shifted communities, 87 were classified as emerging and 21 as realigning, while 11 countries were classified as growing because they remained in the same community but increased in centrality (Table 1.3). The predominance of the emerging category is noteworthy: it suggests that the observed changes primarily reflect new alignment with a consolidating bloc rather than wholesale fragmentation or arbitrary switching between established groupings. This distribution supports the utility of a dynamic approach for distinguishing countries moving toward a new alignment structure from those remaining within an existing community.
|
Classification |
Number of Countries |
Percentage |
|
Stable |
44 |
27.0% |
|
Emerging |
87 |
53.4% |
|
Growing |
11 |
6.7% |
|
Realigning |
21 |
12.9% |
|
Total |
163 |
100% |
Table 1.3: Country-level movement classification, 2000–2010 to 2011–2020.
Discussion
The two levels of analysis answer complementary questions. The full-period network shows that UNGA voting is not random: it organises into geography-consistent clusters, Gulf, Baltic, and Nordic groupings are the tightest examples, around one dominant bloc that absorbs much of the Assembly’s membership. The two-period comparison then shows that this structure is not fixed underneath: the dominant bloc reorganised around a new anchor country, structural influence turned over almost entirely, and roughly two-thirds of comparable countries changed alliance community altogether. Neither half of the analysis would be sufficient on its own: the full-period network alone would present a settled structure that the data does not actually support, while the two-period comparison alone would lack the broader structural context in which that movement is taking place.
This directly answers RQ1: geopolitical alliances emerge through shared voting behaviour that reorganises over time, as shown by the shift from the Senegal-led bloc to the Thailand led bloc.
The classification findings carry direct implications for the study’s central aim of identifying emerging geopolitical alliances. The 87 countries classified as “emerging” were not merely switching between established blocs, they were consolidating around a newly dominant anchor (Thailand) in the second period, whereas in the first period they had been distributed across smaller communities or peripheral positions. A single-period snapshot in 2000 to 2010 would have shown a Senegal-led bloc of 119 countries, with the remaining countries scattered across smaller communities. By 2011 to 2020, many of those scattered countries had converged around Thailand. This convergence, visible only through temporal comparison, represents the emergence of a new alignment structure, rather than the persistence or reconfiguration of an old one.
This distinction is important for understanding what “emerging” means in this context. An emerging alliance is not simply a change in community membership; it is a directional trend toward alignment that is not yet fully consolidated but is clearly discernible across time. The movement of 87 countries into the dominant Thailand-led bloc from peripheral positions fits this definition: these countries were not already part of the major alignment structure in the first period, but by the second period they had moved toward it. This pattern would be invisible in a cross-sectional analysis, which would show only the final arrangement without revealing the trajectory of movement that produced it.
The predominance of the emerging category also distinguishes this study’s contribution from earlier work that has primarily focused on confirming established blocs. Existing research has been effective at identifying stable groupings such as the G-77, Nordic, or Gulf clusters, but has paid less attention to countries in the process of moving toward new alignment structures. The classification system used here enables exactly this kind of detection: it flags countries that are in motion toward a consolidating bloc, providing earlier identification of incipient geopolitical realignment than static methods allow.
This classification system directly answers RQ2: community detection combined with centrality measures distinguishes countries that remain in stable communities from those moving toward or between major communities.
Read together, these results support the central claim that emerging geopolitical alignment can be identified and tracked through voting behaviour, provided two conditions are met. First, abstention must be preserved as a meaningful signal rather than discarded or folded into agreement, since with outright opposition this rare, abstention is often where a country’s real position becomes visible. Second, the analysis must compare alignment across time rather than reporting it as a single, settled snapshot, since a static view cannot distinguish a genuinely stable bloc from one that only looks stable because it has not yet been compared against another period.
One point of scope is worth stating plainly: the full-period figures (241 countries, 56 communities) and the windowed comparison (163 countries, 3 major communities) operate at different population scales. Both are correct for what they measure; the difference is one of scope, not inconsistency.
5. RESEARCH QUESTIONS & OBJECTIVES
Research Questions
How do geopolitical alliances emerge among United Nations member states, based on their voting patterns in the UN General Assembly?
How can Social Network Analysis techniques, such as community detection and centrality analysis, be used to identify stable and emerging geopolitical alliances?
In what way do dynamic political alignment measures improve on traditional voting similarity measures for detecting geopolitical alliances?
General Objective
To investigate the dynamics of geopolitical alliances among United Nations member states through UN General Assembly voting patterns, using Social Network Analysis and dynamic political alignment measures.
Specific Objectives
i. To examine how geopolitical alliances among UN member states evolve across different time periods, based on UNGA voting patterns.
ii. To identify stable and emerging voting communities using Social Network Analysis, community detection, and centrality measures.
iii. To assess whether dynamic political alignment measures produce better results than traditional voting similarity measures.
6. FINDINGS
This study finds that UNGA voting can serve as a useful proxy for identifying and tracking the evolution of geopolitical alliances. Using and analysing close to one million UNGA voting records (947,434 in total), the analysis shows that voting similarities are not random: they form identifiable communities with distinct geographical and political characteristics. Across the full dataset, spanning 1946 to 2025 and covering 241 countries, the network organised into 56 communities, including one large community of 81 countries closely matching G-77 and non-aligned voting patterns, alongside identifiable intra-community clusters among Gulf states, Baltic nations, and Nordic states.
Just as important, the analysis’s most significant finding is that these alliance patterns are not constant: they are ever-shifting, dynamic structures. Comparing the 2000 to 2010 period with 2011 to 2020, 55 countries remained within the same community (44 stable and 11 growing), while 108 were classified as emerging or realigning. The dominant alliance shifted from a Senegal-led bloc to a Thailand-led bloc, showing that a snapshot taken at any single point in time would conceal important structural change.
These results speak directly to the three research questions guiding this study. On how alliances emerge (RQ1), the reorganisation of the dominant bloc from a Senegal-led to a Thailand-led community shows that alignment forms around shared voting behaviour rather than fixed regional or treaty boundaries. On whether Social Network Analysis can distinguish stable from emerging alliances (RQ2), the classification built from Louvain community detection and centrality measures separates 44 stable countries, 11 growing countries, 87 emerging countries, and 21 realigning countries. On whether dynamic measures improve on traditional voting-similarity measures (RQ3), the comparison demonstrates that dynamic network measures reveal changes in structural influence that a single static measure of voting similarity would not capture, including the near-complete turnover in PageRank rankings between the two periods.
7. CONCLUSION
To answer the study’s central research question about the shifting nature of the global political structure within the UNGA, the main conclusion is that geopolitical alliances are evolving patterns of political alignment rather than the fixed blocs they are often assumed to be. Applying community detection and centrality analysis through Social Network Analysis to a large body of UNGA voting data reveals the flow of power rather than its concentration: the near-complete change in PageRank rankings between the two comparison periods amounts to an almost full restructuring.
To that extent, the study demonstrates, through methodological and quantitative analysis, how UNGA voting can illuminate both emerging alliances and changing centres of structural influence at specific points in time, an argument that a static, single-snapshot dataset cannot support.
The research also underlines how important it is that all four voting stances, Yes, No, Abstain, and Absent, are preserved, since they offer distinct insight into state preferences and into the meaning carried by abstention itself.
Significance
What this study adds to the existing literature on global political structure is not a focus on identifying already-established geopolitical blocs, but on identifying alliances as they begin to take form and as states move between groups over time. While many existing studies examine structure at only one point in time, this study presents a quantitative analysis of how these blocs evolve, with 53.4% of countries in the comparison set classified as “emerging,” reflecting an interest in documenting an early stage of geopolitical realignment rather than a settled outcome.
Through a methodology that combines and contrasts a large body of UNGA voting data with a range of SNA techniques, including weighted similarity, community detection, centrality measures, and comparative temporal analysis, the study shows not only where states may align, but how, when, and toward what direction their alignments have shifted, addressing a gap in the literature left by treating geopolitical blocs as unchanging constants.
8. POLICY RECOMMENDATIONS
The findings of this study point to a few practical steps that governments, international bodies, and researchers can take. Foreign ministries and diplomatic teams should avoid treating voting blocs as fixed groupings when planning coalition strategy. Since most of the countries examined in this study shifted alliances between the two periods studied, diplomatic strategy should be reviewed regularly using updated voting data, rather than relying on assumptions carried over from earlier decades.
These recommendations should mainly be carried out by foreign ministries, UN missions, and international policy research organisations that study multilateral diplomacy. Institutions responsible for maintaining UN voting records, such as the UN Digital Library, also have a role to play by making sure abstentions and absences continue to be properly recorded, since the study shows that abstention often carries real diplomatic meaning rather than simply representing nonparticipation.
Applying these steps would help address the core problem this study raises. Because alliances form and shift gradually rather than remaining fixed, checking voting patterns on a regular basis, rather than relying on a single snapshot, would allow policymakers and researchers to notice new alliances while they are still taking shape, instead of only recognising them once they have already become established.
REFERENCES
Adarkwah, G. K., Sabel, C. A., & Zilja, F. (2026). Measuring geopolitics: The promise and limits of UNGA voting data for IB research. Journal of International Business Policy, 9(1), 102–123. https://doi.org/10.1057/s42214-025-00237-3
Bailey, M. A., Strezhnev, A., & Voeten, E. (2015). Estimating dynamic state preferences from United Nations voting data. Journal of Conflict Resolution, 61(2), 430–456. https://doi.org/10.1177/0022002715595700
Fartyshev, A. N. (2025). The geopolitical landscape and Russia’s position in multidimensional political space. Frontiers in Political Science, 7.
https://doi.org/10.3389/fpos.2025.1651223
Fjelstul, J., Hug, S., & Kilby, C. (2025). Decision-making in the United Nations General Assembly: A comprehensive database of resolution-related decisions. The Review of International Organizations. https://doi.org/10.1007/s11558-024-09580-1
Istomin, I. (2018). Titans jousting for the mob: Great powers and voting in the UN General Assembly. Journal of International Analytics, (2), 7–18. https://doi.org/10.46272/2587-8476-2018-0-2-7-18
Khan, M. Z. I. (2020). Is voting patterns at the United Nations General Assembly (UNGA) a useful way to understand a country’s policy inclinations: Bangladesh’s voting records at the UNGA. SAGE Open, 10(4). https://doi.org/10.1177/2158244020961117
Kim, S. Y., & Russett, B. (1996). The new politics of voting alignments in the United Nations General Assembly. International Organization, 50(4), 629–652. https://doi.org/10.1017/S0020818300033531
Macon, K. T., Mucha, P. J., & Porter, M. A. (2012). Community structure in the United Nations General Assembly. Physica A: Statistical Mechanics and Its Applications, 391(1), 343–361. https://doi.org/10.1016/j.physa.2011.06.005
Mosler, M., & Potrafke, N. (2020). International political alignment during the Trump presidency: Voting at the UN General Assembly. International Interactions, 46(3), 481–497. https://doi.org/10.1080/03050629.2020.1719405
Nurullayev, D., & Papa, M. (2023). Bloc politics at the UN: How other states behave when the United States and China–Russia disagree. Global Studies Quarterly, 3(3), Article ksad034. https://doi.org/10.1093/isagsq/ksad034
Russett, B. M. (1966). Discovering voting groups in the United Nations. American Political Science Review, 60(2), 327–339. https://doi.org/10.2307/1953359
Steinert, C. V., & Weyrauch, D. (2024). Belt and Road Initiative membership and voting patterns in the United Nations General Assembly. Research & Politics, 11(1), 1–12. https://doi.org/10.1177/20531680241233784