Authors: Amit Kumar, Chaitanya, Harshada Chandran, Kanisha Datta, Michelle Manamela, Sakshi Singh, Sikander Singh Bhangu, Tania Pal, Yash Bhalla
Abstract
This study examines the ongoing issue of the difference between the money allocated and the money actually spent in India’s school education system since the National Education Policy (NEP) 2020 was introduced. Although there have been increases in the budget for education, actual spending has not kept up, with as much as 14.7% of the funds not being used in the 2021–22 financial year. The research uses official government documents, audit reports from the Comptroller and Auditor General (CAG), and data collected directly from schools to identify problems such as slow decision-making, excessive paperwork, and the “March Rush” — a period when many projects are rushed to meet deadlines — all of which prevent funds from being used properly. A review of existing research shows that while overall spending on education has risen over time, deep-rooted problems such as poor management, unfair treatment of rural schools, and weak oversight continue to affect educational outcomes. The study points out that this spending issue is not just about money but also about how funds are managed, with problems in transparency, responsibility, and governance at the heart of the issue. The research concludes that closing the gap between what is planned and what is actually spent is essential for achieving the NEP 2020 goals of providing education to all children, lowering dropout rates, and improving the quality of teaching — which, in turn, helps turn India’s growing young population into a strong force for economic growth and social progress.
Introduction
Education is a vital aspect of any economy. It enhances the productivity of an individual as well as of the nation, and it anchors socio-economic development. For a country like India, where around 26.94% of its population is in the age group of 3–18 years, the nation possesses a demographic advantage and should capitalize on it by investing in secondary education, transforming this youth population into a productive demographic dividend.
According to the UDISE+ 2024-25 Report, the Indian school education sector is one of the world’s largest education networks, with 14.71 lakh schools and 1.01 crore teaching faculty serving 24.69 crore students across the country (Department of School Education & Literacy, 2024-2025). It has immense potential to accelerate human capital formation, long-term productivity, and inclusive economic growth.
The government has introduced various schemes and policies for the upgradation of Indian school education, and NEP 2020 is one among those that aims to replace textbook-based learning methods with inquiry-driven, skill-based education, realizing the demographic potential India possesses. NEP 2020 recognizes universal access to quality school education as a national priority, aiming to achieve a 100% Gross Enrolment Ratio (GER) from preschool to secondary education by 2030. The policy focuses on reducing dropout rates through improved school infrastructure, trained teachers, safe transportation, hostels, and alternative learning mechanisms. It recommends that 6% of GDP be spent on education, whereas actual spending is hardly 4.4% of GDP in practice (Government of India, 2020). As per UNESCO, the benchmark standard is 4–6% of GDP to be spent on education, and it also recommends that 15–20% of the government’s total expenditure be spent on education — a figure that in India is hardly 10%.
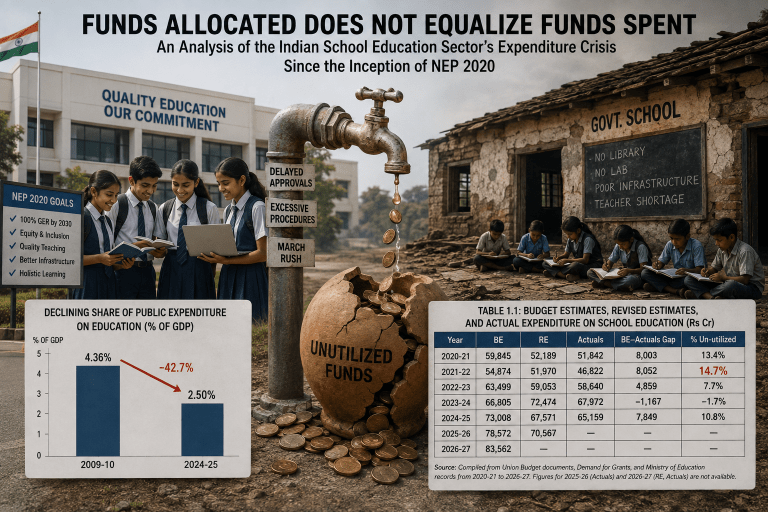
Government reports and CAG audits reveal that the share of public expenditure on education is exhibiting a declining trend, from 4.36% in 2009-10 to 2.50% in 2024-25 — a sharp 42.7% reduction in budgetary commitment.
For the enhancement and upgradation of school education in India, Budget 2026-27 announced an allocation of Rs 83,562.26 Cr, an increase of 6.35% from the previous year’s Budget Estimates of Rs 78,572 Cr. These are nominal increases, often not adjusted for inflation.
Budgetary reports mention three types of allocations to present expenditure: Budget Estimates (BE), the funds initially allocated for the financial year; Revised Estimates (RE), which reflect adjustments made mid-year based on requirements; and Actual Estimates (AE), the amount actually spent. Looking at these figures reveals the entire picture of the budget expenditure gap. Table 1.1 presents this funding pattern for the school education budget across the entire NEP 2020 period.
Table 1.1: Budget Estimates, Revised Estimates, and Actual Expenditure on School Education from 2020-21 to 2026-27 (Rs Cr)
|
Year |
BE |
RE |
Actuals |
BE–Actuals Gap |
% Un-utilized |
|
2020-21 |
59,845 |
52,189 |
51,842 |
8,003 |
13.4% |
|
2021-22 |
54,874 |
51,970 |
46,822 |
8,052 |
14.7% |
|
2022-23 |
63,499 |
59,053 |
58,640 |
4,859 |
7.7% |
|
2023-24 |
66,805 |
72,474 |
67,972 |
−1,167 |
−1.7% |
|
2024-25 |
73,008 |
67,571 |
65,159 |
7,849 |
10.8% |
|
2025-26 |
78,572 |
70,567 |
— |
— |
— |
|
2026-27 |
83,562 |
— |
— |
— |
— |
Source: Compiled from Union Budget documents, Demand for Grants, and Ministry of Education records from 2020-21 to 2026-27. Figures for 2025-26 (Actuals) and 2026-27 (RE, Actuals) are not available.
Among the five financial years with complete data, four years registered actual expenditure lower than the Budget Estimate, with the difference reaching as high as 14.7% in 2021-22, the year most affected by pandemic-related disruption. Second, 2023-24 is the only year in which the Revised Estimate is higher than the Budget Estimate; however, even then the revision itself was not fully achieved, as there was still a shortfall of Rs 4,502 Cr from the RE. Together, these observations indicate that underspending in financing school education in India is not confined to a single year’s conditions, nor can it be solved simply through mid-year budget revisions by the centre — a shortfall persists regardless of which way the revision goes.
These unspent budgets have real implications. The latest PLFS 2023-24 reveals that almost 2 crore students in the age group of 14–18 years are out of the school education system. Among these dropouts (44%), 63% are boys who left school to take up jobs and support their households, while 55% of girls discontinued their education due to domestic work and social stigma.
Despite increases in allocation following the implementation of NEP 2020, actual spending figures reveal a pattern of underutilization of funds. This raises concerns over the efficiency of government policies and schools in spending money to improve the quality of school education and educational outcomes. While governments try to ensure equitable access to education through increased budgetary commitments, the effectiveness of these investments ultimately depends on how the allocated funds are utilized. These bottlenecks in public spending could negatively affect the quality of students India produces every year. Public investment can translate into better learning facilities, skilled faculty, and improved infrastructure only if it is efficiently allocated and utilized, ensuring that funds reach priority areas and contribute to overall socio-economic development.
Even full utilization of allocated funds does not guarantee proportionate improvements in outcomes. Evidence from other countries shows that the relationship between school spending and learning outcomes is often weaker than policymakers assume, with some well-resourced systems seeing little productivity gain from substantial budget increases (Grubb & Allen, 2011).
While existing studies have separately examined the underutilization of funds allocated to the school education sector and various schemes, and how public expenditure on education translates into student outcomes, limited attention has been given to how budget underutilization influences the quality of education, school infrastructure, and educational outcomes together. This study seeks to address this gap by examining the relationship between expenditure gaps and school-level educational outcomes in India.
Objectives
- To identify the specific treasury-level bottlenecks affecting the timely release, transfer, sanction, and utilization of funds allocated for school education in India.
- To analyze the trends and patterns in budgetary allocation, expenditure, and fund utilization in the school education sector since the implementation of the National Education Policy (NEP) 2020.
- To examine the extent and nature of utilization gaps and unspent balances in school education budgets.
- To assess the implications of treasury and fund-utilization bottlenecks for the effective implementation of school education programmes and the achievement of intended educational outcomes.
- To suggest evidence-based policy recommendations for improving the timely release, efficient utilization, monitoring, and accountability of public funds in the school education sector.
Literature Review
The core investigative focus of this study is the persistent phenomenon of unutilized fiscal allocations within school education since the advent of NEP 2020. Two primary works offer an initial framing for this inquiry. Motkuri and Revathi (2024), in “Private and Public Expenditure on Education in India: Trend over Last Seven Decades and Impact on Economy,” published in the Indian Public Policy Review, provide an extensive longitudinal overview of India’s spending patterns over several decades, though they bypass the specific mechanics of how effectively those budgets were actually deployed. Maniar (2022), meanwhile, examines the budgetary landscape of FY 2021-22, assessing the dissonance between policy requirements and real-world central allocations. While these papers collectively define the historical context and the post-NEP funding deficit, they stop short of investigating the systemic failure to exhaust sanctioned funds, which is the precise investigative gap this research intends to close.
Public expenditure on education is compiled from the Analysis of Budget Expenditure on Education (ABEE), and private expenditure from the Private Final Consumption Expenditure (PFCE) component of the National Accounts Statistics (Motkuri & Revathi, 2024). Using actual data from 1951-52 to 2018-19 and projections to 2022-23, Motkuri and Revathi (2024) report that combined public and private expenditure on education rose from approximately 1.4 per cent of GDP in 1950-51 to about 6.7 per cent by 2022-23. Public expenditure exceeded private expenditure on a per-capita basis from the mid-1950s onward and remained higher for four decades; since the 1991 economic reforms, however, private expenditure has grown at a faster rate, narrowing this gap (Motkuri & Revathi, 2024). This shift is attributed to “excess demand” — insufficient capacity in government institutions — and “differentiated demand” — a preference for private education on grounds of perceived quality — following Weisbrod and James (as cited in Motkuri & Revathi, 2024).
A cointegration and Granger causality test conducted by Motkuri and Revathi (2024) finds that public expenditure on education has a statistically significant effect on GDP growth, and that GDP growth in turn affects private expenditure on education, though no direct two-way causal relationship exists between public and private expenditure. In simple terms: when the government spends more on education, the economy tends to grow, and when the economy grows, households tend to spend more on education — but public and private spending do not appear to directly cause each other.
Motkuri and Revathi (2024) establish that aggregate education expenditure has grown substantially, but their analysis does not evaluate this expenditure against any policy-defined requirement. This question is addressed by Maniar (2022), who examines FY 2021-22 — the first full budget year after NEP 2020 — using central government and Karnataka budget documents.
Maniar (2022) reports that combined central and state expenditure on education in FY 2020-21 stood at approximately 3.5 per cent of GDP, against the norm of 6 per cent of GDP recommended since the Kothari Commission report of the 1960s. Elementary and secondary education account for approximately 80 per cent of total education expenditure, with states bearing 84.24 per cent of the overall education budget — indicating that fiscal responsibility for NEP-related commitments lies predominantly with states rather than the centre (Maniar, 2022).
Drawing on the Kasturirangan Committee’s draft NEP report, Maniar (2022) estimates an additional annual recurring requirement of 10.9 per cent of government expenditure, along with a one-time requirement of 3.0 per cent for infrastructure and capital costs, though the underlying methodology and the intended centre-state division of this funding are not specified by the Committee.
Against this requirement, Maniar (2022) finds that FY 2021-22 budgets contracted rather than expanded: the central school-education budget fell by 8.74 per cent and the central higher-education budget by 2.83 per cent relative to the prior year; Karnataka’s school-education budget rose marginally, by 3.21 per cent, while its higher-education budget fell by 2.25 per cent; and the central allocation for the Samagra Shiksha Abhiyan (SSA), identified as the primary vehicle for NEP rollout under the government’s SARTHAQ plan, was cut by 19.87 per cent. Adjusted for inflation, every one of these budget lines contracted in real terms (Maniar, 2022).
Taken together, Motkuri and Revathi (2024) and Maniar (2022) establish that India’s education expenditure has grown substantially in aggregate terms, and that allocations immediately following NEP 2020 fell short of, and in several cases contracted relative to, both policy norms and prior-year levels. Neither study, however, examines whether sanctioned budgets were actually spent within the years for which they were allocated; both rely on final expenditure figures or budget estimates rather than utilization data. Neither disaggregates funds allocated, funds released, and funds spent at the state level, and neither connects expenditure or allocation figures to outcomes such as infrastructure, dropout rates, or learning levels. This constitutes the specific gap addressed by the present study.
Motkuri and Revathi (2024) establish that India’s education expenditure, though historically increasing, has never structurally reached the recommended benchmarks; Maniar (2022) demonstrates that this shortfall persisted, and in several respects worsened, in the first budget cycle following NEP 2020. Neither study addresses budget utilisation — whether sanctioned funds are spent as intended within the sanctioned year. The present study builds on this literature by examining that specific gap for the school education sector in India since 2020.
Geetha Rani Prakasam, in “Does Financing Universal Elementary Education Reduce Interstate Disparity?” (2015), examines how financing universal elementary education affects inter-state disparities. The study shows that the volume of funds transferred by the central government is insufficient to fulfil the diverse needs of the states. It also points to uniform matching-share requirements under Samagra Shiksha (which integrates the Sarva Shiksha Abhiyan, or SSA), which contribute to deteriorating conditions of infrastructure, teaching quality, and so on. The study is relevant to identifying key gaps in expenditure and the ways to resolve them.
The Centre for Budget and Governance Accountability (2025) assessed the efficiency of public spending on elementary education in India, comparing this against the post-implementation analysis of the RTE Act. The study also focuses on non-monetary factors, such as maternal education, in determining the success or failure of education budgets, reiterating that fiscal disparity is not the only factor behind the failure of elementary education in India.
While both studies agree that the Union Government has increased financial resources, the complicated approval system, ongoing delays in fund release, and weak local governance amplify the gap between allocation and expenditure. The budget allocation for PM-POSHAN in 2026-27 is ₹12,750 crore, but its expenditure reveals failures reflected in the poor quality of mid-day meals, delayed release of funds, and several other institutional loopholes.
An examination of two rural areas — Barwani, Madhya Pradesh, and Kalahandi, Odisha — by Kumar et al. (2024) highlights the ground reality of how implementation programmes actually function in rural areas. The study shows that the literacy rate of Barwani, MP, is 49.08%, and that of Kalahandi, Odisha, is 59.22%. Both states have been victims of socio-economic inequalities, and the study reveals the gaps that persist within the Indian education system, particularly in rural areas, and the need to reform it.
Another study, by Akhilesh Kumar et al., “Measurement of Completion Rate of Education in India,” reveals a metrics gap in India. In contrast, the Ministry of Statistics and Programme Implementation (MoSPI) developed a National Indicator Framework (NIF) in 2018. Kumar et al. argue that India uses the Gross Intake Ratio to the Last Grade (GIRLG), which captures data about school completion while ignoring dropout rates and children who never enrolled at all. This is relevant because budgetary gaps cannot be properly analysed while loopholes remain in the metric system itself.
A close analysis reveals a genuine research gap: in addition to allocating monetary resources, the focus should be on mitigating gaps in rural areas and revising evaluative mechanisms more broadly. Digitization can only take hold once basic requirements are fulfilled. This underscores that focusing on ground-level deficiencies is the more important first step in making education effective in India.
The above studies show that financing universal education requires close examination of state-level requirements too, and they highlight the complicated approval system that states must navigate for further disbursement. The rural education sector has been consistently overlooked by the government, and educational backwardness continues to persist. The literature reveals both social and economic gaps, and indicates that improved implementation techniques are required. Proper monitoring of SDG4 in India can help support the overall upliftment of education.
The studies reviewed above effectively highlight deficiencies in rural-area metrics and inter-state disparities. The core objectives of NEP 2020 are curtailing dropout rates and ensuring universal access to education at all levels. Yet these studies have largely overlooked how financial deficits hamper teaching quality, educational quality, infrastructure, and drive persistent rural inequality. The question of how funds should actually be disbursed so that they meet the requirements of individual states remains largely unanswered in the literature, pointing to the need for an integrated analysis.
The analysis of gaps between expenditure and allocation in the Indian education sector is closely tied to the broader question of making India a developed nation. Each state has its own requirements, and a dedicated body for each state is needed to address its demands. The reviewed studies suggest that teacher quality has been declining, an issue that has been overlooked for a long time; the matter now requires close monitoring, along with the constitution of a proper body for standardized teacher assessments. Proper assessment of the underlying metrics is equally necessary, as it forms the basis for evaluation. The digital divide is another gap evident in the literature. Maternal deficiencies — such as a lack of formal education among mothers and limited awareness of the nutrition needed for children — also affect school performance and should be addressed. Despite government discussion of its importance, AI-related matters have received little attention, contributing to digital incompetencies among youth. Implementation bodies and the process of making them effective should therefore be a focus going forward. To reduce the digital divide, AI and its usage should also be included as a core area of study, and recommendations should extend to awareness programmes for the SWAYAM curriculum. The budget should include measures relating to such policies as well.
In summary, the recommendations that emerge include creating state-specific implementation bodies, establishing a national board for unified teacher assessments, and formulating strategies to bridge the digital divide.
Historical analysis shows that the utilization rate of SSA funds decreased from 84% in 2014 to 75% in 2015, and further to 70% in 2016. Studies suggest that the mere allocation of funds does not guarantee effective spending; instead, equal focus must be placed on the governance, delivery, and monitoring of funds, which becomes even more important for developing nations like India. Studies also suggest that the full impact of education expenditure is realized only in the long term (10–15 years), so the expenditure gaps that exist today will have a negative impact on educational outcomes well into the future (Indira & Pahwa, 2020).
The literature further points out that, even though expenditure gaps are well documented, the component-wise allocation of funds within Samagra Shiksha Abhiyan (SSA) shows notable similarities across states: all states except Sikkim allocated their highest budget to elementary education in 2025-26, but most of this expenditure was directed toward revenue expenditure (such as teachers’ salaries) rather than capital expenditure aimed at improving school infrastructure and learning outcomes (Malhotra, Kapur, & Pandey, ResGov, 2026). The impact of these gaps also materializes in public-versus-private school scenarios, which show that despite higher costs, enrolment in private schools has been increasing relative to public schools — with the most commonly cited reason being that the quality of public institutions is perceived as unsatisfactory (Demand for Grants, 2026-27).
On the broader impact of education on long-term GDP growth, it has been noted that a 1% increase in India’s education budget leads to a 0.71% increase in GDP growth. Comparing the public and private nature of education spending, this literature also highlights a difference in underlying intent: private spending tends to aim for profit, while public spending focuses on social welfare (Mallick, Das, & Pradhan, 2016).
On the sources of funding, the 15th Finance Commission confirms that, between 2015 and 2021, there was a continuous decline in the education budget as a share of total budgetary allocation, falling from 3.75 per cent in 2015-16 to 3.26 per cent in 2020-21. The first post-pandemic education budget saw a decrease of Rs 5,000 Cr in school education alone. It further notes that one source of central government education funding, the education cess, creates a federal structural problem, since more than 75% of budget responsibility is borne by fiscally constrained state governments (Sen & Menon, NIEPA, 2021).
The CAG report on the Government of Odisha (2025) points to a phenomenon of “March Rush,” in which both the Union (15%) and the State (21%) released funds in the last month of the financial year, i.e., March, making it difficult to spend the allocated money properly.
Existing studies focus largely on inadequate budget allocation and inadequate year-on-year increases (Kundu, IMPR, 2026), on education spending as a percentage of GDP or of the Union Budget, and on the long-term positive or negative impact of expenditure gaps and the public-private debate — but far less on expenditure utilization itself. The limited literature that does highlight underutilization does not fully answer the how and why of the issue.
Since NEP 2020, across three major school education schemes — SSA, PM-Poshan, and PM-SHRI — the Department of School Education and Literacy (DoSEL) has consistently lagged in spending the funds allocated to it, with a cumulative shortfall of around Rs 39,204 crore, or approximately $4.15 billion, over five years.
The nature of these expenditure gaps is more procedural than financial, even though the financial dimension cannot be ignored entirely. Slow release of funds, lack of transparency, the manner of spending, divided budget-sharing responsibilities, weak expenditure compliance, inconsistent financial reporting formats, and technical, digital, and structural bottlenecks in fund dispersal remain largely unaddressed. It is essential to resolve these expenditure gaps using existing funds, since doing so alone would substantially improve overall school education outcomes, even if budgetary allocations continue to increase only gradually.
Methodology
This study adopts a mixed-methods design to explore perceptions, experiences, and systemic challenges related to budget-expenditure gaps in India’s school education sector. A mixed approach was adopted because it allows for contextual depth, stakeholder perspectives, and interpretive analysis, which are important for understanding systemic issues beyond what numerical data alone can show. The study gives particular attention to flagship schemes such as Samagra Shiksha Abhiyan, PM Poshan, and state-level allocations.
Data Collection Method
Primary Data: A Google Forms survey was distributed among people from various fields, including teachers, students, and policymakers. The questionnaire contained both open-ended and closed-ended questions to gather perspectives on expenditure allocation and policy implementation under NEP 2020.
Secondary Data: The study draws on a range of government and academic sources to ensure accuracy, reliability, and comprehensiveness:
-
Government Reports: Budget documents from the Ministry of Education, annual reports of the Department of School Education and Literacy, and Comptroller and Auditor General (CAG) audits were systematically reviewed to ensure reliability and official accuracy. These sources provided quantitative data on fund allocation, expenditure patterns, and policy implementation outcomes.
-
School-Level Data: Sample data from state education departments and district-level reports were incorporated to capture ground realities of fund allocation and utilization. This helped identify variations in expenditure trends and administrative efficiency across regions.
-
Policy Documents: The National Education Policy (NEP) 2020 and subsequent implementation guidelines were examined to align expenditure trends with the policy’s stated objectives and to evaluate the coherence between financial commitments and educational reforms.
Analysis of Data
Responses were systematically arranged into categories such as infrastructure gaps, teacher shortages, bureaucratic delays, and misallocation of funds. This analytical framework helped identify recurring patterns and institutional bottlenecks affecting expenditure efficiency.
The methodology thus establishes a robust framework for uncovering how budget allocations fail to translate into actual educational outcomes, laying the foundation for meaningful policy insights and reforms.
Analysis and Discussion
The data from our study show that the persistent gap between budget allocations and actual spending in school education is primarily a procedural issue rather than a simple lack of funds. Our primary survey indicates that the system itself acts as a bottleneck, stalling money before it ever reaches the classroom. Specifically, 54.1% of respondents identified a lack of transparency in spending as the single largest challenge, while 13.5% pointed directly to delays in fund release. These two issues are deeply connected, creating a cycle in which bureaucratic delays and a lack of accountability reinforce one another. The absence of transparency is not just a technical problem but also one rooted in how institutions are structured. Financial data are spread across various departments and reporting systems, making it hard to track the movement of funds in real time (CBGA, 2020; World Bank Functional Classification Framework).
Additionally, School Management Committees, parents, and local community members usually lack direct access to spending information, which weakens the ability of people at the grassroots level to hold authorities accountable. This lack of oversight often means that financial issues, such as delays or inefficiencies, go unnoticed until funds are either delayed or left unused by the end of the financial year.
A major driver of this problem is what can be described as a documentation trap. Because education is a Concurrent List subject under the Seventh Schedule of the Indian Constitution, funds must move through multiple layers of government — from central ministries down through state and district administrations — before finally reaching a school. This multi-tier governance structure often results in fragmented accountability, as responsibility for delays is dispersed across several administrative levels rather than concentrated within a single authority (Government of India, 2020; NEP 2020).
Survey respondents highlighted that navigating these overlapping verification and compliance layers frequently leaves funds stuck in administrative limbo. If a central scheme changes mid-year, or a state government shifts its priorities, the money often becomes paralyzed and ends up lapsing at the end of the financial year. This complexity can be understood through the principal-agent problem in public administration: the central government, acting as the principal, depends on state governments, district-level administrators, and school authorities as agents to carry out educational initiatives. Because information about spending and implementation is not evenly shared across these levels, higher authorities impose strict reporting, monitoring, and compliance procedures to guard against misuse of funds. Although these measures are meant to enhance accountability, they often create heavy administrative workloads and slow the spending process, leaving funds unused even after they have been allocated (CBGA, 2020).
Bureaucratic incentives also contribute to these spending gaps. Public officials may face more serious institutional consequences for following incorrect procedures than for failing to spend allocated money. As a result, administrators often become cautious, delaying approvals and imposing extensive documentation requirements to avoid issues during audits. This emphasis on procedural compliance, rather than the timely use of funds, leads to consistent delays in spending.
The combination of fragmented accountability, extensive documentation requirements, and weak transparency mechanisms also creates opportunities for localized corruption. The qualitative feedback from our survey revealed a frustrating pattern of administrative gatekeeping: respondents shared that vulnerable beneficiaries and local school committees often encounter informal gatekeepers who demand small processing fees or bribes simply to release basic funds — such as direct-benefit scholarships or infrastructure grants — to which students are legally entitled.
Another institutional factor affecting expenditure gaps is the unequal level of administrative capability among district- and school-level authorities. Many government schools lack specialized finance staff and instead rely on teaching staff and school administrators to handle financial reporting, procurement, and compliance tasks. A lack of proper training in financial management hampers the ability of these local institutions to use allocated resources efficiently, follow reporting procedures, and meet expenditure deadlines. Consequently, funds may remain unspent not only due to delays in their release, but also because implementing agencies lack the administrative capacity to use them effectively (Department of School Education & Literacy, 2024-25).
These delays lead directly to the “March Rush” phenomenon, frequently flagged in the Comptroller and Auditor General’s (CAG) 2025 report on school education, tabled on December 9, 2025. The March Rush reflects underlying problems within the budgeting system itself. The annual budgeting process pushes agencies to spend all their allocated funds before the financial year ends, in order to avoid future budget cuts or the loss of unused funds. As a result, most spending decisions are made in the last quarter of the year, which reduces efficiency and hampers long-term planning (CAG Report No. 5 of 2025).
When funds are not spent earlier in the year, local authorities are required to use their entire annual budget within a short period — typically a few weeks — to avoid losing it. This tight schedule leaves little or no time for thoughtful planning, which is likely why 20.3% of respondents identified misallocation of resources as a major concern. Instead of investing in long-term needs like teacher training or proper laboratories, schools end up rushing through superficial procurements just to clear their books. Combined with inflation and rising operational costs, these delayed spending pipelines leave local school administrators with almost no financial flexibility.
The impact of this expenditure gap is felt most severely by marginalized groups, including Scheduled Castes (SC), Scheduled Tribes (ST), minorities, and rural students. Survey data show that 31.1% of respondents see infrastructure and facilities as the area most damaged by these spending gaps. For rural and vulnerable populations, this lack of development directly drives school dropout rates. Because funds stall in the pipeline, many schools lack basic necessities such as clean drinking water or separate, functional toilets for girls — amenities explicitly mandated by NEP 2020 (Government of India, 2020). Without a safe environment, many vulnerable students are pushed out of the system entirely.
Furthermore, 28.4% of respondents noted that teacher recruitment and training suffer heavily. This is particularly true in rural areas, where budget delays make it difficult to clear salaries or fund permanent teaching posts, leading to chronic teacher shortages and a reliance on untrained, temporary staff. This is compounded by a stark digital divide: 17.6% of respondents highlighted that access to learning materials and technology is heavily compromised, running counter to the baseline improvements targeted by the Ministry of Education’s UDISE+ framework (Department of School Education & Literacy, 2024-25).
The qualitative feedback highlights a deeper issue: the distribution of visibly inferior resources to marginalized schools. Survey participants noted that vulnerable students are often left with poor-quality or defective learning materials compared to elite or well-funded schools. This means the expenditure gap does not just cause a shortage of resources — it creates a symbolic inequality that reinforces social divisions within the classroom itself.
At the community level, these budget failures translate into daily frustrations for students and teachers. Shortages of textbooks, broken laboratory equipment, and a lack of school maintenance restrict students to purely theoretical learning. This creates a vicious cycle: poor facilities and demotivated learners lead to low student attendance and weak enforcement of school rules. When attendance drops, administrative bodies often use it as justification to reduce future funding — locking schools into a spiral of neglect.
The data also reveal a significant gap between basic and higher-quality infrastructure. While many schools lack basic cleanliness and functional classrooms, advanced tools such as smart panels and computers are distributed highly unequally, widening the gap between elite private institutions and underfunded government schools. This helps explain why over 81% of our respondents expressed a deep lack of trust in public financial management: 52.7% stated that funding is inadequate and unevenly distributed, while 28.4% noted that even when funds are adequate, they are poorly utilized.
Fixing these deep-rooted gaps requires moving beyond minor budget increases and focusing instead on structural reforms. To address the transparency problem, an independent education finance committee should be established to monitor fund flows in real time. The central government should also set strict deadlines for releasing state shares in order to avoid the March Rush. Automating direct transfers to school bank accounts would bypass bureaucratic layers and reduce opportunities for leakage or rent-seeking.
The current rule requiring schools or implementing agencies to demonstrate about 75% utilization of funds before receiving further disbursements may unintentionally contribute to expenditure gaps (Samagra Shiksha Guidelines, Ministry of Education, 2024). Although this rule is meant to promote responsibility, it can create cash-flow problems for projects requiring substantial upfront spending. Schools with limited management capacity often struggle to meet utilization thresholds on time, which delays further disbursement and slows project progress. Therefore, the strict 75% usage requirement should be reduced to 30–40% for complex capital projects. This change would give schools a more realistic timeframe to handle procurement and complete infrastructure work.
To relieve teachers of the heavy burden of compliance and paperwork, schools need a dedicated financial management cadre trained in data entry and reporting, allowing educators to focus entirely on teaching. School administrators and senior staff should also receive practical management training — such as PMP frameworks — to help them optimize resource use.
Bridging the digital divide will require looking beyond government funding alone. Strategic Public-Private Partnerships (PPPs) — such as funding ATAL Tinkering Labs through corporate social responsibility (CSR) initiatives — can bring modern STEM infrastructure to the schools that need it most. Crucially, the way funds are released must change: capital expenditure for basic amenities such as clean water and toilets must be ring-fenced from general revenue spending, so that infrastructure is never sacrificed to cover operational deficits. Finally, expanding and digitizing student support programmes and scholarships for economically weaker sections will directly ease financial hardship, lower dropout rates, and ensure that public spending serves the broader goals of social justice and equal access.
Ultimately, the findings of this study demonstrate that resolving India’s educational expenditure crisis requires looking far beyond simple budget increases. The data show that a rupee allocated in a federal budget means little if it is choked by documentation traps, systemic delays, and bureaucratic gatekeeping. When more than half of surveyed stakeholders flag a basic lack of transparency, it becomes clear that the administrative machinery itself requires urgent reform.
The human cost of these systemic failures is too high to ignore. As the data show, it is the most vulnerable populations who pay the price for these unspent balances, facing decaying infrastructure, severe teacher shortages, and a widening digital divide. To truly fulfil the equity goals of NEP 2020, public financial systems must shift from rigid, compliance-heavy tracking toward flexible, decentralized, real-time funding models. By protecting capital infrastructure funds, automating direct-to-school transfers, and professionalizing local school financial management, the system can bypass traditional bottlenecks. Only by transforming public financial management from a bureaucratic barrier into a smooth delivery pipeline can state resources successfully reach the classroom — turning public education into a genuine tool for social mobility, rather than an accidental driver of social inequality.
Policy Recommendations
-
Scheme-specific monitoring budget: Data show that, for the SSA scheme, the monitoring budget for FY 2025-26 was merely Rs 81 crore — just 0.1% of the total SSA budget. Every school education scheme should therefore allocate a substantial, scheme-specific monitoring budget.
-
Faster release of state funds: As education is a concurrent subject, states bear the major portion of the financial burden (nearly 70–80% of the budget), but they face significant fiscal problems due to limited revenue — sometimes worsened by delays in the central government releasing states’ share of revenue from the central pool of taxes. The central government should disburse states’ shares as promptly as possible. This would also help prevent the “March Rush” phenomenon, in which departments rush to release and spend budgets in the final month of the financial year. As an extended measure, a law could be proposed mandating that the Union government release states’ shares by a fixed date each financial year.
-
Management training: Teachers and officials are currently given mostly subject- or job-specific training. Training in management studies should also be encouraged — for example, certifications such as Six Sigma or Project Management Professional (PMP), or other training in work efficiency and programme implementation. Public institutions, despite their social-welfare orientation, would benefit from adopting a more corporate style of working in this respect.
-
Digital literacy: Not just students, but teachers and officials too, should be trained in computer and digital skills.
-
Dedicated financial management cadre: Specialized data-entry and compliance-reporting staff should be appointed for every district, relieving teachers of extra, non-teaching responsibilities.
-
Migration to the M1 model of PFMS: In two states — Odisha and Bihar — it was observed that the Public Financial Management System’s (PFMS) M3 model of compliance reporting and fund dispersal is quite rigid. States could instead migrate to the M1 model, which allows a state department’s Single Nodal Agency (SNA) to develop its own customized software for compliance, reporting, and fund release — as Odisha’s Education SNA, the Odisha School Education Programme Authority (OSEPA), has already done in migrating from the M3 to the M1 model.
-
Outcome-based budgeting: As recommended by the Parliamentary Standing Committee on Education in March 2026, a dedicated Outcome Budget should be mandated for DoSEL, tracking both the quantitative and qualitative outcomes of expenditure.
-
Redefine the 75% utilization threshold for SNAs: Under the current system, the central government releases the next instalment of funds only after the implementing agency has utilized 75% of existing funds. This threshold should be customized based on the nature of spending. For predictable revenue spending — such as teachers’ salaries or RTE entitlements — the existing 75% threshold remains appropriate. For complex capital spending, such as constructing new schools, classrooms, or laboratories, which involves long and complex procurement cycles, the threshold should be lowered to 30–40% of existing funds.
-
Nature-based release of funds: Rather than releasing funds in general, disbursement should be structured by the nature of spending under distinct headings — for example, teachers’ salaries under revenue expenditure, functional girls’ school toilets under capital expenditure, and teacher training under capacity-building expenditure, and so on.
-
Independent committee on education finances: A dedicated oversight committee should monitor the flow and utilization of education funds across all administrative levels, ensuring that allocated funds are spent fully, efficiently, and in line with educational priorities, while identifying delays, financial irregularities, and implementation gaps through regular audits and performance reviews.
-
Encouraging Public-Private Partnerships (PPPs) through investment in ATAL Tinkering Labs: By strengthening PPPs, the government could encourage industry partners, technology firms, and CSR initiatives to invest in and support the functioning of laboratories for STEM education. This could reduce the implementation-related inefficiencies the government currently faces in running these labs. Private operators could help by recruiting qualified lab technicians, providing STEM mentors, assisting with teacher training, managing equipment, and updating technologies. This would improve the utilization of government funds, enhance the quality of STEM education by giving students practical exposure, and produce better educational outcomes overall.
Limitations
-
Limited rural representation: Although the study discusses rural disparities, it does not include detailed fieldwork or case studies from various states. This omission limits the depth of understanding of ground-level realities.
-
Exclusion of private-sector dynamics: The analysis focuses mainly on public spending and its underutilization. It does not consider the increasing role of private education funding or how it interacts with shortcomings in public funding.
-
Short-term orientation: The study centers on current expenditure gaps but does not examine the long-term effects of underutilized resources on educational outcomes, which may only become visible after 10 to 15 years.
-
Reliance on secondary data: Much of the study is based on government budgets, audits, and published research. These sources may involve delays, inconsistencies, or biases that could affect the accuracy of the findings.
-
Incomplete expenditure records: The latest expenditure data for 2025–26 and 2026–27 were not available at the time of the study, limiting the ability to evaluate recent trends and long-term impacts.
-
Survey sample constraints: The primary data were collected through Google Forms, which had limited scope and may not fully represent the diverse views of stakeholders across India’s varied social, economic, and regional contexts.
-
Focus on procedural bottlenecks: While the study identifies delays and transparency issues within the bureaucracy, it does not thoroughly measure how these procedural problems affect specific educational outcomes, such as literacy rates or test scores.
Conclusion
The analysis shows that India’s school education sector faces a long-standing problem in which the amount of money allocated does not match how much is actually spent. This problem has persisted across several years since the implementation of NEP 2020. Although funding has increased in nominal terms, it is not being used effectively — a result of delays in decision-making, lack of clear information, and weak accountability mechanisms. The “March Rush” pattern, in which funds are released late and then spent hastily, leads to rushed spending that does not support long-term improvements such as better school buildings, teacher training, and improved learning outcomes.
Studies and survey findings show that the main driver of this gap is not a lack of money, but rather how funds are managed. Even when funds are available, issues such as poor administrative procedures, unnecessary paperwork, and local corruption prevent money from being used properly. This has a disproportionate impact on disadvantaged groups and rural areas, widening educational gaps in ways that run counter to NEP 2020’s goals of ensuring universal access to education and reducing dropout rates.
Addressing these problems requires improving how education finances are managed at the state level, ensuring timely release of funds, increasing transparency, and creating fairer mechanisms for evaluating teachers. Closing the gap between funds allocated and funds effectively used is essential to turning India’s growing young population into a genuine asset for social and economic progress — and, ultimately, to building a properly funded and well-utilized education system as a strong foundation for the country’s future development.
References
http://Budget Estimates 2026-27. https://www.indiabudget.gov.in/doc/eb/sumsbe.pdf
http://Impact of Educational Expenditure on Economic Growth. Academic working paper.
http://Government of India. (2020). National Education Policy 2020. New Delhi: Government of India.
http://Ministry of Education. (2024). Samagra Shiksha Guidelines.