Authors: Riddhika Bohra, Dhanishtha Meena
ABSTRACT
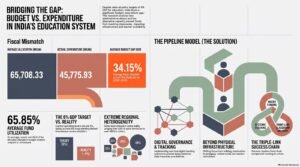
This study evaluates the Indian school education system by analyzing the persistent execution gap between allocated Budget Estimates (BE) and Actual Expenditures (AE) using official Ministry of Education data from FY 2016–17 to FY 2020–21, the study tracks quantitative budget-expenditure gaps across Central, State/UT, and school levels. It complements this with a multi-source diagnostic analysis across five thematic case studies. Despite national policy targets to spend 6% of GDP on public education, persistent fund under-utilization severely weakens school infrastructure, teacher capacity, and student retention across the country.
Keywords: Budget-Expenditure Gap, Indian School Education, Samagra Shiksha Abhiyan, Fiscal Federalism, Fund Utilization.
1. INTRODUCTION
1.1. Background of Study
Education was assigned to the State List at the time of Independence, which meant state governments carried the primary responsibility for running schools, while the central government’s role remained largely advisory. The first few Five-Year Plans focused on industry and infrastructure, so education was not a fiscal priority in this period; public spending stayed close to 3.5% of GDP (PRS Legislative Research, 2022) for decades. This shifted after the Kothari Commission (1964-66) recommended raising education spending to 6% of GDP, a target later formalized in the National Policy on Education, 1968. That target remains unmet over fifty years later. This historical context establishes the foundation of this study: a persistent gap between policy commitments and actual funding, which predates the contemporary data analyzed herein.
The year 1991 serves as a significant dividing line in this history. India’s economic liberalisation coincided with a broader shift toward administrative decentralisation, raising critical questions in policy debates about whether education’s share of a rapidly growing economy was keeping pace. Empirical research on this period remains divided. A panel study of Indian states from 2002 to 2020 indicates that fiscal decentralisation reforms had a broadly positive effect on education and health service delivery, although outcomes depended heavily on local institutional quality and accountability (Singh, Bhattacharjee, & Nandy, 2024). Conversely, researchers examining school-level decentralisation present less optimistic findings. One recent study tracing the effects of the 73rd and 74th Constitutional Amendments on school management found mixed, and in some cases negative, effects on student achievement (Kameshwara, Shields, & Sandoval-Hernandez, 2023). Concurrently, the central government began playing a larger role through centrally sponsored schemes that required states to co-finance programmes; this shift highlights how education’s placement on the Concurrent List directly contributes to contemporary budget-expenditure mismatches.
Two indicators are utilized in this study to track this gap, chosen to capture different dimensions of the issue. Education expenditure as a share of GDP—which rose only slightly from about 3.8% in 2013-14 to 4.64% in 2020-21 (PRS Legislative Research, 2022), remaining well short of the 6% goal—measures whether education is being prioritised relative to the size of the economy over time. The second indicator, the variance between Budget Estimates (BE) and Actual Expenditure in a given year, captures implementation-level rather than policy-level shortfalls by measuring whether allocated funds are successfully deployed. Together, these two measures distinguish the issue of whether India allocates sufficient funds for education from the issue of whether it effectively spends those allocations. Furthermore, this execution gap varies significantly across the different stages of school education. Elementary education has generally received the strongest policy attention, supported by the legal mandate of the Right to Education Act, 2009. In contrast, secondary education faces greater challenges; enrollment ratios decline noticeably at this stage, and several centrally sponsored schemes designed to support it have repeatedly underspent their allocations (PRS Legislative Research, 2025). Higher secondary education exhibits even more severe disparities, marked by sharp enrollment declines and comparatively little budgetary focus. This historical pattern is corroborated by earlier state-level budget analyses, which demonstrate that elementary education is consistently prioritized over secondary education across most states (CBGA-CRY, 2016, 2018, as cited in Kundu & Rastogi, 2020). Given the distinct fiscal challenges at each stage, this study analyses elementary, secondary, and higher secondary education as separate analytical categories rather than a uniform system.
1.2. Statement of Problem
Despite constitutional provisions and recurring national policy targets aiming to devote 6% of GDP to public education, India’s public educational spending remains persistently low, hovering well below this threshold. However, the key challenge facing the Indian school education system is not merely the initial quantum of funds announced in annual budgets, but the systematic and recurring divergence between what is allocated (Budget Estimates) and what is actually spent on the ground (Actual Expenditure). This expenditure shortfall manifests across all administrative levels, driven by multi-layered bureaucratic red tape, delayed fund flows leading to a “year-end expenditure rush” and rigid matching-grant requirements between the Centre and States. Furthermore, public expenditure is severely skewed toward fixed revenue expenses such as teacher salaries, effectively crowding out essential capital investments in school infrastructure. Because this execution gap varies significantly across school tiers (elementary versus secondary) and regional economic boundaries, there is a critical need to evaluate how these fiscal mismatches occur and identify the structural, operational, and institutional factors causing allocated funds to lapse.
1.3. Research Questions
- What are the trends of gap in education expenditure in the Indian school education system?
- What do the trends of gap in education expenditure look like for three levels in Indian Schools?
- What are the factors driving differences between actual and budgeted education expenditure?
1.4. Aim of Study
The primary aim of this study is to evaluate the Indian school education system through a comprehensive analysis of the gap between allocated budget estimates and actual expenditures. Specifically, the research seeks to analyze the longitudinal trends in education expenditure gaps at the macroeconomic level across Central, State, and combined governmental tiers. Furthermore, it aims to examine how these budgetary mismatches manifest across the distinct stages of school education—specifically comparing elementary and secondary levels. Ultimately, the study intends to conduct diagnostic qualitative and case-study evaluations to identify the systemic, operational, and institutional factors driving the divergence between budgeted and actual education spending.
1.5. Objectives of Study
- To analyze the trend of gap in education expenditure in the Indian school education system.
- To analyze the trend of gap in education expenditure at three levels in the Indian Schools.
- To identify the factors causing the gap between budgeted and actual education expenditure.
2. LITERATURE REVIEW
2.1. Review of Literature
Theoretical Literature:
The theoretical grounding for understanding budget-expenditure gaps in Indian school education rests on the broader economic theory of fiscal federalism; how spending and taxing responsibilities are best divided between different tiers of government. The foundational argument comes from classical fiscal federalism theory: Tiebout (1956) held that decentralised decision-making better matches local preferences than centralised provision, while Musgrave (1959) and Oates (1972) refined this into a functional split; local governments handle services with localised benefits, like schooling, while the Centre’s comparative advantage lies in equalising resources across regions with unequal fiscal capacity. Read together, these theories point to the same practical implication for education: since schooling’s benefits are mostly local but resource capacity is unevenly spread across India’s states, some blend of state-level delivery and central-level equalisation is theoretically justified. The real question, as this review goes on to show, is how well that blend actually works in practice. India’s constitutional design reflects this logic only partially. Education was originally placed in the State List, giving states primary responsibility for schooling. This changed with the 42nd Constitutional Amendment Act of 1976, which moved education to the Concurrent List, allowing both the Union and state governments to legislate on it. As the NIPFP’s analysis (Rao and Sen, 1995) of India’s fiscal federalism notes, this arrangement was intended to combine the efficiency gains of decentralised provision with the coordination and standard-setting role of the Centre; however, India’s federal structure involves a complex division of fiscal and administrative responsibilities between the Centre and the states. This ambiguity has practical consequences for how education money flows and who is ultimately accountable when spending falls short. That consequence has only sharpened in recent years: spending routed through centrally sponsored schemes rose from roughly ₹5.21 lakh crore in 2015-16 to ₹14.68 lakh crore in 2023-24, with the standard Centre-state funding ratio shifting from a state-favourable 40:60 to an even 50:50 split; meaning states now carry a heavier matching-fund burden at precisely the moment the release mechanisms for that money have grown more procedurally layered.
More recent scholarship has both extended and complicated this picture. Hoque and Mahanta (2024), working with state-level panel data from 2005 to 2016, found that household demand factors: alongside the same Centre-state fiscal dynamics Tilak (1989) described decades earlier; continue to shape how elementary education gets funded, particularly around a major 2009 policy shift. Others suggest the balance of power has tilted further toward the Centre since Tilak’s (1989) original analysis: Sharma (2023) traces a broader trend of fiscal centralisation across Indian federalism, driven partly by the growing reliance on centrally sponsored schemes noted above, arguing that the joint-jurisdiction tension Tilak identified in 1989 has deepened rather than resolved in the years since.
The practical implications of this joint-jurisdiction arrangement warrant examination, since the theory only explains half the picture. Money for a centrally sponsored scheme like Samagra Shiksha does not move directly from the Union government to a school; it passes through several institutional layers, each with its own procedural checkpoints. The Central share is released from the Ministry of Education to the state treasury, which adds the state’s own matching share (typically 40%, though only 10% in North-Eastern and Himalayan states) before transferring the combined amount to a State Implementation Society. From there, funds move to a District Implementation Society, and only then reach individual schools through their School Management Committees (Kundu & Rastogi, 2020). Each handover requires its own compliance documentation; utilisation certificates, audit reports, expenditure statements; before the next installment is released. This is exactly what Tilak’s (1989) theoretical argument predicts in practice: with five or six institutional checkpoints between budget approval and money actually reaching a classroom, delay can occur at any single stage, and a state’s administrative capacity to move quickly through these checkpoints becomes as consequential as the size of the original allocation.
Jandhyala B.G. Tilak’s body of work over several decades remains the most cited theoretical treatment of this specific problem (Tilak, 1989; Tilak, 2018). In his widely-referenced paper on Centre-State relations in financing Indian education, Tilak argued that placing education under joint jurisdiction created a structural tension: states carry the bulk of the implementation burden and recurring costs (such as teacher salaries), while the Centre increasingly influences policy direction and provides funding through centrally sponsored schemes with matching-fund requirements. This dependency, Tilak showed, makes actual spending vulnerable to states’ own fiscal health: a state under financial stress may be unable to release its matching share even when Central funds are approved, producing a gap between what is budgeted and what is ultimately spent on the ground. His later work extended this argument, describing India as lacking a genuinely “cooperative” federal arrangement in education financing, since decision-making power and fiscal capacity are not well aligned between the two tiers of government. This theoretical framing is useful for this study because it explains why a budget-expenditure gap is almost structurally built into the system, rather than being purely an administrative failure. The Centre can approve a scheme and announce an allocation, but actual expenditure depends on a second, independent decision by states to release matching funds, and on their capacity to move that money through the multi-layered channel described above before it ever reaches a school.
Empirical Literature:
India has 43 crore children under the age of 18 alongside a rapidly growing economy; however, educational funding remains constrained. In 1966, the Kothari Commission recommended allocating 6% of the GDP to education, a target reiterated in the National Education Policy (NEP) 2020 (Patel, 2026; Tilak, 2003). Despite this, combined spending across central and state budgets currently ranges between 2.5% and 4.64% of GDP (Balodi & Srivastava, 2021; Gupta, 2020; Kumari, 2024; NITI Aayog, 2026). In a global context, India’s educational expenditure ranks at the lower end among BRICS nations (Singh, 2019). While South Africa and Brazil invest 6.9% and 5.7% of their GDP respectively, India’s historical expenditure has averaged 2.9% (Singh, 2019). Although the education budget recently crossed the ₹1 trillion mark (Patel, 2026), the broader Indian economy is expanding at a faster rate than educational allocations, indicating a relative decline in education funding as a share of total expenditure (Balodi & Srivastava, 2021). While nominal budget figures have doubled over a decade, adjusting for inflation reveals that a perceived 26% budget increase translates to a 6% growth in actual purchasing power (Dongre & Kapur, 2016). Fiscal deficit controls have led to reduced state allocations, shifting the financial burden to families for private education. This dynamic challenges the objectives of the Right to Education (RTE) Act, which guarantees free schooling (Motkuri & Revathi, 2024). Consequently, private household spending on education has increased from ₹9,667 crore in 1991-92 to ₹7,28,197 crore by 2022-23 (Kumari, 2024).
Furthermore, allocated funds face administrative delays and reductions. The implementation gap within India’s public financial management frameworks reflects severe institutional inefficiencies in daily fiscal execution. There exists a chronic, systematic deviation between the initial Budget Estimates (BE) approved at the start of the fiscal year and the actual spending realized on the ground (Gundimeda & Asah, 2016; Accountability Initiative, 2021). The Ministry of Finance routinely reduces the budget by 9% to 16% prior to disbursement (Kundu & Rastogi, 2020). During the 2021-22 fiscal year, mid-year “Revised Estimates” reduced the education fund by over ₹5,000 crore (Phukan & Bonia, 2022). This bottleneck is primarily driven by multi-layered bureaucratic red tape and rigid release compliances between central ministries and State Nodal Agencies. Empirical budget tracking demonstrates that in states like Bihar and Uttar Pradesh, less than 30% of the approved allocation under the flagship Sarva Shiksha Abhiyan (SSA) scheme is utilized during the first two quarters of the financial year (Gundimeda & Asah, 2016). Additionally, fund utilization remains slow overall; by February, towards the end of the financial year, school departments typically utilize only 59% of their allocated funds (Choudhary, 2026).
Consequently, nearly 70% of the actual expenditure is heavily back-loaded onto the final quarter (Gundimeda & Asah, 2016; Accountability Initiative, 2021). To prevent funds from lapsing, the remaining 41% is frequently expended rapidly. This fiscal rush in the month of March leads to superficial, poor-quality administrative spending or causes large blocks of education funds to lapse entirely, often resulting in short-term infrastructure upgrades rather than sustained learning improvements (Choudhary, 2026).
The distribution of these funds is also structurally asymmetrical. In the 2022-2023 budget, elementary education received 49.92% of the allocation, secondary education received 31.94%, and higher education was allocated 11.86% (Guleria et al., 2025). Central government allocations further reflect this disparity, assigning 51.5% to elementary education and 10.1% to secondary education (Guleria et al., 2025). Under the Samagra Shiksha scheme, designed to fund pre-K to 12th grade as a seamless unit, elementary schools absorbed 84.5% of the total funds, leaving 13.7% for secondary education and 1.8% for teacher training (Kundu & Rastogi, 2020).
The structural allocation of public finances in India’s education sector reveals a profound imbalance between operational expenses and long-term asset creation. Empirical evidence demonstrates that recurrent revenue expenditure, driven heavily by teacher salaries and administrative overheads, systematically crowds out capital expenditure, leaving almost zero fiscal space for upgrading school infrastructure (Santhosh, 2015; Bose et al., 2018). States utilize between 85% and 90% of their education budgets primarily on teacher salaries, leaving minimal capital for classroom construction or learning resources (De & Endow, 2008; Tilak, 2003). Macro-fiscal tracking reveals a systematic trend where recurrent revenue components consistently consume over 90% to 95% of the total state education budgets, leaving less than 5% for core capital asset creation (Bose et al., 2018). This fiscal starvation severely limits the modernization of public schools across Indian states. For instance, in states such as Odisha and Rajasthan, expenditure on school infrastructure ranges from just 1% to 6% of the budget (Bordoloi et al., 2020). Concurrently, despite this heavy expenditure on salaries, the system experiences a significant educator shortage, with 11 lakh untrained teachers (Kundu, 2018) and 7.47 lakh vacant teaching posts (Choudhary, 2026). This deficit is most pronounced in certain regions: Jharkhand has a 40% vacancy rate in its teaching workforce, and Bihar requires an additional 1.87 lakh educators (Choudhary, 2026). Additionally, structural inefficiencies persist; the state funds 7,993 “zero-enrollment” schools employing 20,817 teachers (NITI Aayog, 2026), while simultaneously, 1,04,125 single-teacher schools operate in rural areas (NITI Aayog, 2026).
Consequently, the funding structure limits access for older students. Due to lower investments in secondary education, only 17% of rural schools offer secondary classes (Choudhary, 2026). This creates a transition barrier for students completing primary education. The Gross Enrolment Ratio (GER) is 91% in primary school, but decreases to 79% in secondary and 58% in senior secondary education (Choudhary, 2026; NITI Aayog, 2026). Nationally, the secondary school dropout rate is 11.5%, reaching 20% in states like West Bengal (NITI Aayog, 2026). A lack of secondary infrastructure and funding contributes to students leaving the education system, with 44% of out-of-school adolescents entering the informal labor market to support their households (Choudhary, 2026).
3. Methodology
3.1. Introduction
This section outlines the research design and analytical framework adopted to evaluate the budget-expenditure gap in Indian school education. It details the secondary data sources, variables, and analytical tools utilized to track financial trends and conduct qualitative diagnostic evaluations.
3.2. Sources of Data
The data source for the variables used in the research is Analysis of Budgeted Expenditure on Education of various years by the Ministry of Education, Government of India.
3.3. Tools used for Data Analysis
Google Sheets served as the primary tool for data analysis and visualization in this study.
3.4. Variables Specification
The variables used in the research are as follows:-
| S.No. | Metric Description | Sector / Scope | Jurisdiction / Entity |
| 1 | Budget Estimate | Education Department | Central Government |
| 2 | Budget Estimate | Education Department | All States & UTs Government |
| 3 | Budget Estimate | Education Department | Central Govt + All States & UTs |
| 4 | Actual Estimate | Education Department | Central Government |
| 5 | Actual Estimate | Education Department | All States & UTs Government |
| 6 | Actual Estimate | Education Department | Central Govt + All States & UTs |
| 7 | Expenditure Gap | Education Department | Central Government |
| 8 | Expenditure Gap | Education Department | All States & UTs Government |
| 9 | Expenditure Gap | Education Department | Central Govt + All States & UTs |
| 10 | Budget Estimate | Education Dept + Other Depts | Central Government |
| 11 | Budget Estimate | Education Dept + Other Depts | All States & UTs Government |
| 12 | Budget Estimate | Education Dept + Other Depts | Central Govt + All States & UTs |
| 13 | Actual Estimate | Education Dept + Other Depts | Central Government |
| 14 | Actual Estimate | Education Dept + Other Depts | All States & UTs Government |
| 15 | Actual Estimate | Education Dept + Other Depts | Central Govt + All States & UTs |
| 16 | Expenditure Gap | Education Dept + Other Depts | Central Government |
| 17 | Expenditure Gap | Education Dept + Other Depts | All States & UTs Government |
| 18 | Expenditure Gap | Education Dept + Other Depts | Central Govt + All States & UTs |
| 19 | Expenditure Gap | Elementary Education | Central Government |
| 20 | Expenditure Gap | Secondary Education | Central Government |
| 21 | Expenditure Gap | Elementary Education | All States & UTs Government |
| 22 | Expenditure Gap | Secondary Education | All States & UTs Government |
| 23 | Expenditure Gap | Elementary Education | Central Govt + All States & UTs |
| 24 | Expenditure Gap | Secondary Education | Central Govt + All States & UTs |
4. Data Analysis & Interpretations
4.1. Introduction
This section presents the empirical findings and interpretations corresponding to the study’s core research objectives. It combines quantitative trend analysis of national and tier-wise budgetary gaps with qualitative multi-source analysis to identify the drivers of fund under-utilization.
4.2. Result for Objective 1

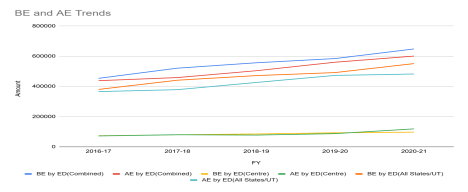
Figure 4.2.1. Trends in Education Expenditure by Education Department at Centre, States/UTs and combined level
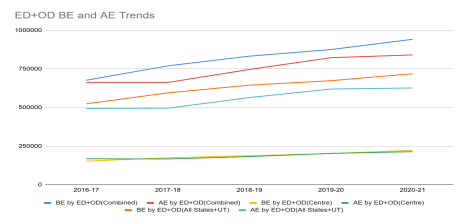
Figure 4.2.2. Trends in Education Expenditure by Education Department+Other Department at Centre, States/UTs and combined level
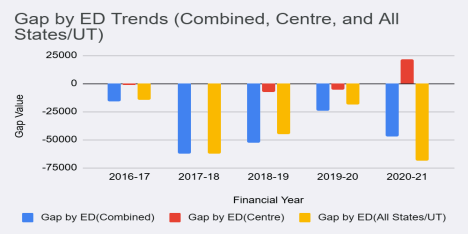
Figure 4.2.3. Gap in Education Expenditure by Education Department at Centre, States/UTs and combined level
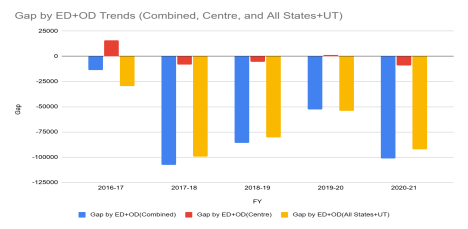
Figure 4.2.4.Gap in Education Expenditure by Education Department+Other Department at Centre, States/UTs and combined level
The analysis for Objective 1 evaluates macro-level spending patterns across the Indian education system over a 5-year period (from FY 2016–17 to FY 2020–21). It measures the divergence between Budget Estimates (BE) and Actual Estimates (AE) across two financial layers:
- Expenditure solely by the Education Department (ED).
- Combined expenditure by the Education Department and Other Departments (ED+OD).
Key Insights & Trends:
- Growth in Baseline Allocations: As depicted in Figures 4.2.1 and 4.2.2, both Budget Estimates and Actual Expenditures show an upward absolute trajectory from 2016–17 through 2020–21 at the Central, State/UT, and Combined levels.
- Dominance of States in Spending: The absolute volume of education expenditure and budget allocation by all States/UTs combined is significantly higher than that of the Central Government.
- Pattern of Expenditure Gaps (ED): Figure 4.2.3 illustrates that the gap (AE – BE) for the Education Department remains persistently in the negative domain across most years. The Central Government’s ED gap remained relatively narrow across all financial years, briefly moving into a positive surplus in 2020–21.
- Pattern of Expenditure Gaps (ED+OD): Figure 4.2.4 highlights that when spending by Other Departments is combined with Education Departments, the net expenditure shortfall becomes significantly larger.The primary driver of this cumulative deficit is the state-level execution gap (All States+UT), whereas the Centre’s ED+OD gap fluctuated minimally around zero, recording minor positive spikes in 2016–17 and 2019–20.
Therefore, The macro-level trend analysis demonstrates a persistent fiscal gap between budgeted and actual education spending in India, largely driven by state-level execution bottlenecks rather than Central allocations. Furthermore, including non-education departments (ED+OD) reveals a deeper structural deficit, indicating that cross-departmental education and training outlays face greater implementation friction.
4.3. Result for Objective 2
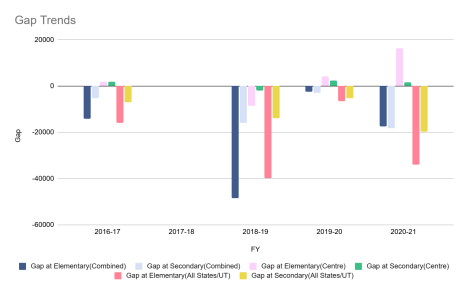
Figure 4.3.1.Gap in Education Expenditure on Elementary and Secondary Education at Centre, States/UTs and combined level
4.4. Result for Objective 3
To complement the macro-quantitative trends, this section investigates the underlying qualitative and institutional drivers behind the budget-expenditure gap. Pure numeric data falls short in explaining why allocated funds remain unspent. Given that a single comprehensive case study capturing all administrative dimensions across India was not available, a multi-source diagnostic approach was adopted in some cases. Through five targeted analysis —covering tier-wise execution, regional economic variations, state fiscal capacities, bureaucratic inefficiencies, and scheme-level implementation—this section analyzes the multi-layered factors causing the divergence between budgeted and actual outlays.
ANALYSIS 1: The execution gap in the educational budget across three tiers in Indian school education system
Approach: Single Case Study
This study serves as a deep-dive financial analysis of this execution gap, utilizing the 2026-27 Union Budget estimates assessed by PRS Legislative Research. At the macroeconomic level, the government budgeted a total aggregate outlay of ₹1,39,289 crore across the Ministry of Education for 2026-27, representing a 14% increase from the revised estimates of the previous cycle. The PRS dataset reveals a severe structural asymmetry in how this capital is distributed: school education absorbs 60% of the Ministry’s total budget (₹83,562 crore), leaving higher education with the remaining 40% (₹55,727 crore). Because the foundational tier’s budget is heavily consumed by fixed, recurring revenue expenditures, such as baseline salaries, the upper educational tiers are mathematically starved of the capital required to build physical, capital-intensive infrastructure before the fiscal year even begins. This study relies on quantitative secondary data analysis, drawing exclusively from the financial evaluation authored by J. Choudhary for PRS Legislative Research. The primary time period under investigation focuses on the 2026-27 Union Budget estimates, while the underlying trend analysis utilizes historical expenditure data spanning an eight-year longitudinal period from 2017-18 to 2025-26. The dataset is fundamentally secondary, aggregating macroeconomic metrics from official Union Budget documents (Demands for Grants), Ministry of Education performance records, the Unified District Information System for Education Plus (UDISE+) 2024-25 report, and the All India Survey on Higher Education (AISHE) 2021-22. The primary analytical technique applied is comparative variance analysis, which calculates the execution gap by measuring authorized budget allocations against actual on-ground fund utilization percentages and programmatic outcomes.
The following matrix tracks the financial flow across the educational tiers highlighting the severe, quantifiable drop in capital absorption across the supply pipeline:
| Educational Tier | Budgeted Amount (2026–27) | Share of Total Budget | Documented Actual Expenditure Metrics |
| School Education | ₹83,562 crore | 60% | 59% utilized by February (Month 11 of 12) |
| Higher Education | ₹55,727 crore | 40% | Consistent alternate-year drops in utilization |
Table 4.4.1. Data Matrix: Allocation vs. Spending Reality
The interpretation of this dataset highlights a massive administrative failure to absorb capital, compounding aggressively as the educational tiers progress:
- Primary Tier Spending Rush: The Department of School Education is administratively slow to deploy its massive capital allocation. Data indicates that by February, the department utilized only 59% of its allocated funds. This creates a massive 41% surplus that must be absorbed in the final weeks of the fiscal year, forcing a panicked, poor-quality spending rush in March that directly violates parliamentary committee recommendations to limit last-quarter expenditure to 33%.
- Secondary Tier Capacity Collapse: As the focus shifts to high schools, physical capacity collapses due to frozen capital. While the NEP 2020 targets a 100% Gross Enrolment Ratio (GER), the lack of executed infrastructure funding artificially suppresses GER to 79% in secondary grades and 58% in higher secondary grades. The data reveals an acute rural bottleneck: only 17% of rural schools currently possess the infrastructure to offer secondary classes, compared to 38% in urban areas.
- Higher Education and Infrastructure Paralysis: Tertiary institutions experience the most acute execution paralysis. The PM-USHA scheme, the central government’s primary vehicle for funding tertiary infrastructure, managed a multi-year average utilization rate of merely 16%, meaning 84% of approved capital remained unspent. This financial friction directly translates to operational deficits, evidenced by a 29% faculty vacancy rate in central universities, spiking to 54% in Indian Institutes of Information Technology (IIITs).
The empirical findings of this study firmly establish that the Indian education system is crippled by acute administrative friction rather than merely a lack of initial budget allocations. The data isolates the root cause of this frozen capital to persistent bureaucratic roadblocks. For critical infrastructure schemes, severe under-utilization is driven directly by the states’ failure to utilize existing funds and their inability to submit viable project proposals to the central government, resulting in funds being legally withheld. Furthermore, severe administrative delays on the ground, such as slow land transfers, cause major institutional building projects (such as the construction of new IITs) to stretch from six to 13 years, causing revised estimates to jump from ₹6,080 crore to an astronomical ₹14,332 crore. This execution gap triggers a direct, measurable chain reaction resulting in severe negative socio-demographic outcomes:
- Critical Dropout Rates
- The Privatization Penalty
- Unequal Economic Burden
ANALYSIS 2: Easterns states vs Western states
Approach: Multi source analysis
When we look at school education budgets across India, the economic structure of a state plays a massive role in deciding how well schools are funded. This analysis compares industrially advanced Western states (like Maharashtra and Gujarat) with non-industrially advanced Eastern states (like Bihar and West Bengal). Western states benefit from large manufacturing hubs, services, and high GST collections, giving them a strong tax base. On the other hand, Eastern states have largely agrarian economies with limited industrialization. The objective here is to analyze how this industrial gap directly affects state-level education spending, fund availability, and grassroots school infrastructure. For this analysis, secondary data from RBI’s State Finances: A Study of Budgets (2018-19 to 2022-23), state budget documents, and Accountability Initiative briefs have been used. Looking at the numbers, a clear pattern emerges: Maharashtra and Gujarat generate over 60% of their total revenue from State Own Tax Revenue (SOTR). This gives them strong financial independence to fund social sectors like education without relying entirely on central approvals. In contrast, Eastern states like Bihar and West Bengal get over 50% of their revenue from Central Grants and tax devolutions. While Eastern states often allocate a high percentage of their overall state budget to education (around 15-18%), this analysis shows that 85% to 90% of this money gets locked into non-discretionary revenue expenditure—mainly teacher salaries and administrative overheads. Because of this, Eastern states are left with very low capital expenditure for building new school infrastructure compared to industrially rich Western states.
In conclusion, a state’s level of industrialization creates a structural inequality in educational financing. While Eastern states manage to pay salaries and keep schools functioning, their limited tax base prevents them from investing in long-term capital assets like modern labs, functional sanitation facilities, or proper boundary walls. Industrially advanced Western states, backed by higher revenue flexibility, can consistently allocate funds for infrastructure upgrades. Therefore, national schemes like Samagra Shiksha need a more flexible, equity-focused funding formula that provides higher capital assistance to non-industrial states with lower tax capacity.
ANALYSIS 3: North states vs South states
Approach: Single Case Study
Kerala and Bihar are frequently viewed as the extremes of India’s educational spectrum, with Kerala serving as a model for other states to follow and Bihar serving as a warning. Kerala has had nearly universal school enrollment since the 1990s and surpassed 95% literacy decades ago. In contrast, the current literacy rate in Bihar is 74.3%. Although it would be simple to interpret this as rich state versus poor state, the more recent data don’t really lend credence to that interpretation. While Bihar’s overall enrollment figures continue to lag behind Kerala’s, data tracking both states reveals that Bihar is actually making significant success on several fronts, such as maintaining teachers in the classroom and reducing dropout rates. This combination is worth further examining because of the contradiction between progress on certain metrics and deterioration on others, which directly addresses the main problem of this work, which is that budget size alone cannot account for the discrepancy between funds allotted and results attained.
No primary fieldwork, interviews, or surveys were done for this case study; it is solely dependent on secondary data. The Unified District Information System for Education Plus (UDISE+), India’s official school education management information system, is the source of the main dataset, which spans eight years from 2018–19 to 2025–2026. Statistics on teacher vacancies from Project Approval Board (PAB) meeting minutes (Ministry of Education) and RBI state budget statistics on per-capita education spending were added to this. Bihar and Kerala were specifically chosen as a contrasting pair (a low-performing northern state and a high-performing southern state) because their divergence is well-documented and analytically useful, not because they represent a statistically representative sample of Indian states. This sampling strategy is purposive rather than random. The comparison is based on five indicators: literacy rate, dropout rate, gross enrollment ratio, pupil-teacher ratio (PTR), and the percentage of the state budget allotted to education. Instead of using a single-year picture, the research is longitudinal and comparative, tracing how the difference between the two states has grown or shrunk over time, revealing patterns that a static comparison would overlook. Given the qualitative, comparative nature of this case study, it is appropriate to acknowledge that the interpretation of this data is descriptive and correlational rather than causal. It finds patterns and associations between spending effort and outcomes without formally isolating cause-and-effect relationships.
The data presents a more complicated picture than a straightforward success-versus-failure narrative. Bihar is near the bottom in terms of spending per student despite allocating 20% of the total state budget to education, more than any other large state. This is due to its lower overall economy rather than a lack of political commitment. The dropout rate difference decreased from over 23 percentage points to just over 2, and the pupil-teacher ratio deficit with Kerala dropped from 40 pupils to just 11 in recent years, suggesting that the expenditure is having the desired effect. But beginning 2018–19, the enrollment disparity has widened, moving in the opposite direction. Together, these results imply that while Bihar’s funding is effectively reaching students who are already enrolled in classrooms, it is not addressing the factors that prevent other children from enrolling in the first place. These factors may include family income pressure, the distance to school, or other socioeconomic barriers that are not fully captured by the available data. Kerala’s side of the comparison adds another layer: it routinely beats numerous northern states despite spending less per pupil overall. This outcome is mostly attributed to panchayat-level control and an almost nil teacher vacancy rate. The main conclusion of this study is that local financial management and oversight seem to be just as important as the initial allocation of funds. This conclusion is closely related to the fiscal federalism dynamics that were previously covered in the theoretical framework of this study, where it was demonstrated that Center-State responsibility for education funding is structurally divided in ways that impact implementation.
ANALYSIS 4: Operational, Institutional and Bureaucratic Issues
Approach: Multi-Source study
Public expenditure management in India operates within a rigid annual cycle — the financial year runs from 1 April to 31 March, a convention introduced in 1867 and retained since as an instrument of legislative control over the executive. This annuality principle rests on the “rule of lapse”: any part of a sanctioned grant left unspent at the close of the year expires and reverts to the Consolidated Fund of India, requiring fresh legislative sanction to be used again. While intended to enforce fiscal discipline, this rule produces a paradoxical outcome in practice — the so-called “March rush,” where departments hurriedly spend a disproportionate share of their annual allocation (commonly 25–30 percent) in the final quarter, and often in the final month alone, simply to avoid surrendering funds. This rushed spending compromises procurement quality, invites poor project selection, and weakens value for money. But the dysfunction runs deeper than a year-end scramble: institutional delays in certifying how money was actually spent, and bureaucratic sloppiness in classifying expenditure as capital or revenue, distort the picture of what government spending is even achieving. This case study examines these interlinked issues through the Comptroller and Auditor General’s (CAG) Financial Audit Report on Accounts of the Union Government for 2024–25, tabled in Parliament on 2 April 2026, which offers one of the most detailed and current windows into how operational delay, institutional apathy, and accounting bureaucracy actually play out inside the Union government’s books.
The analysis here is based entirely on secondary data — official audit findings, supplemented by the underlying statutory provisions of the General Financial Rules (GFR), 2017, and contemporaneous news reporting on the report’s release. The primary document, the CAG’s 2024–25 report, itself constitutes a compliance/financial audit of Union government accounts for the fiscal year 1 April 2024 to 31 March 2025, and covers 15 ministries and departments in relation to pending utilisation certificates, alongside a broader review of accounting heads, fund transfers, and budget-versus-actual expenditure across the Union government as a whole. This is therefore a single-year, cross-sectional case rather than a longitudinal comparison — it captures a snapshot of one fiscal year’s irregularities rather than tracking trends over multiple years, though the report itself notes that a substantial share of the pending certificates (₹38,287 crore of the ₹54,282 crore total) relate to the preceding three years, and some to as far back as 1985–86, which implicitly signals a recurring, multi-year pattern rather than an isolated lapse. For interpretation, the audit findings were grouped thematically — (i) delays in utilisation certification and fund transfer (the operational/bureaucratic delay dimension), (ii) misclassification between capital and revenue heads and reliance on omnibus “Minor Head 800” entries (the accounting/institutional dimension), and (iii) the gap between sanctioned and actual expenditure, including simultaneous over- and under-spending across different ministries (the March-rush/budget-estimation dimension) — to connect the report’s granular findings back to the broader conceptual themes of the case study.
The findings suggest that India’s expenditure problems are structural rather than incidental. Pending utilisation certificates worth ₹54,282.32 crore, in direct violation of GFR Rule 238’s 12-month deadline, point to weak follow-through once funds leave the Union treasury — a problem compounded by delays in transferring cess and levy collections (₹9,222 crore) to their designated reserve funds. The ₹12,754.47 crore in misclassified expenditure and receipts, including the Department of Atomic Energy booking revenue expenditure under capital heads, shows that even how spending is recorded can misrepresent the real composition and quality of public investment, with consequences for how fiscal indicators like the deficit are read. Overall savings of ₹4,91,302.81 crore against a Parliament-approved outlay of over ₹1,47 lakh crore, occurring alongside instances of excess expenditure in other grants, reflects the twin failure of poor budget estimation and uneven execution that underlies the March rush phenomenon. What ties all of this together is not a lack of rules — GFR provisions, CAG oversight, and the Public Accounts Committee (PAC) mechanism all exist on paper — but a lack of enforcement teeth: the system remains “compliance-driven rather than penalty-based,” so audit objections recur across successive reports with little real consequence for departments.
ANALYSIS 5: Samagra Shiksha Abhiyan Implementation
Approach: Single case study
Education falls under the concurrent list, with responsibilities shared between the Ministry of Education and its state-level counterparts for effective planning, management, and execution. Various schemes have been introduced with the aim of providing equitable access to education and improving its basic quality.
One such flagship programme, Sarva Shiksha Abhiyan, was introduced in 2000–01 with a strong emphasis on the universalisation of education in India. Despite findings suggesting otherwise, greater priority continues to be given, in terms of policy development and financial investment, to elementary education rather than secondary education. In response, the government introduced Samagra Shiksha Abhiyan (SMSA) in 2018–19, integrating the pre-existing schemes of SSA, RMSA, and Teacher Education (TE). The primary aim was to ensure holistic education provisioning and equitable learning outcomes, with the SMSA framework specifically identifying gender and social category gaps as pressing issues to be bridged.
This study draws on both qualitative and quantitative analysis. The authors faced hindrances including the spread of swine flu, the COVID-19 outbreak, and travel challenges to remote districts like Sitapur, along with some officials declining to report expenditure data—limiting fund flow evaluation. The SMSA scheme follows decentralised planning: it begins at the school level with the School Management Committee’s development plan, aggregated up through block, district, and state levels. The budget is prepared under the Annual Work Plan & Budget (AWP&B)—covering fresh proposals and carried-forward balances—through the Project Monitoring System (PMS). Since SMSA is centrally financed, fiscal responsibility is shared between the union and states as per the FM&P manual issued by MHRD. The co-financing ratio is 60:40 for most states and 90:10 for north-eastern and Himalayan states.
Even as elementary and secondary education show individual improvements, retention rates decline as students progress to higher levels. In 2005, MHRD’s CABE committee focused on ensuring free, affordable education while keeping dropout rates stable. Despite anticipated increases in the Union Budget 2019–20, SMSA remained underfunded, with shortfalls of 9%, 11%, and 16% between CCEA-approved funds and Ministry of Finance allocations in 2018–19, 2019–20, and 2020–21 respectively. SMSA’s funding depends on education cess—Prarambhik Shiksha Kosh for elementary and Madhyamik and Uchhatar Shiksha Kosh for secondary education. The Standing Committee reported 6.8% of collected cess remained unutilized. Despite these efforts, elementary education continues to receive top policy priority in union allocations.
SMSA implementation in Andhra Pradesh (Chittoor) & Uttar Pradesh (Sitapur)- The findings reflect a striking gap between the proposed and allocated budgets across both states. The proportion of the proposed budget that was approved declined from 76% in 2018–19 to 64% in 2019–20, while the share of the approved budget actually allocated by the state fell from 85% to 63%. In Andhra Pradesh, the total budget for SMSA fell by 3% in 2019–20 compared to the previous year. Moreover, teacher education received less than 1% of the total approved budget in both years, and discrepancies were noted between approved and actual teacher recruitment against reported vacancies. A state household survey identified 8.89 lakh children of school-going age who were not officially enrolled in any basic education institution.
Chittoor, which has a large school-going population and a comprehensive school network, illustrates this gap well. Despite wide accessibility of basic facilities such as drinking water, electricity, toilets, and ICT labs, many government schools in the district still lacked essential infrastructure like boundary walls, furniture, and full RTE compliance. The district reported a female literacy rate above the state average and a higher transition rate to secondary education, yet it continued to face major challenges—including underutilisation of funds in components like (OOSC) and (CWSN), as well as weak planning stemming from the procurement of fewer funds than initially requested. Unutilised funds reduce the likelihood of higher future allocations; as a result, Chittoor had to surrender ₹1.38 crore due to delays in civil works. In Uttar Pradesh, the approval rate for the proposed budget dropped from 91% in 2018–19 to 85% in 2019–20, owing to underutilisation of funds. Even as the approved budget increased slightly, spillovers rose simultaneously. The state utilised only 47% of its allocated budget in 2018–19 and just 30% by January 2020, which in turn led to lower fund allocation by the state and, ultimately, a funding shortfall. To address these gaps, Uttar Pradesh introduced initiatives such as the SHARDA campaign in 2019–20, aimed at enrolling non-enrolled children, and prioritised girls’ education through the expansion of KGBVs. However, despite budgetary provisions for school infrastructure and teacher recruitment, implementation remained weak due to delays in construction works, stalled projects, and changes in teacher recruitment policy—all of which affected effective fund utilisation.
Sitapur, in particular, has a large network of government schools, but many lack RTE-compliant infrastructure such as boundary walls, electricity, and ICT labs, despite good availability of toilets and drinking water. The district also faces weak educational outcomes overall, marked by female literacy below the state average, declining girls’ enrolment, low transition rates to higher grades, and a significant shortage of teachers in government schools.
Even though SMSA appeared ideal on paper—vouching for holistic, inclusive, and activity-based learning, and aiming to achieve equitable learning outcomes—the reality on the ground was drastically different. Implementation was often weak, and the framework continued to face challenges of fund underutilisation. These, along with other challenges, raised questions about the overall effectiveness of the framework and underscored the need for proper monitoring and evaluation practices, alongside fresh policy solutions to bridge the existing learning gap.
In conclusion, the qualitative analysis reveals that the gap between budgeted and actual education expenditure in India is fundamentally structural rather than a mere shortage of initial outlays. The divergence is driven by a combination of back-loaded fund releases leading to a rushed “March rush,” rigid co-financing guidelines in centrally sponsored schemes, and weak institutional capacity at local levels. Additionally, state-level tax base disparities cause recurrent operational expenses like teacher salaries to crowd out capital investments in school infrastructure.
5. Conclusion
5.1. Summary of Findings
The education budget is consistently approved with a substantial amount, but it is not fully spent. This persistent gap between budget and expenditure has been observed from 2016–17 to 2019–20. It was also noticed that this issue is more of a pattern across states rather than at the central level, with state governments failing to fully utilise the funds allocated to them for education.
This disparity was also visible across states based on their level of economic advancement and prosperity. Economically prosperous states like Maharashtra and Gujarat were able to spend most of their allocated budget on building infrastructure—such as furniture, ICT labs, and toilets—whereas economically weaker states like Bihar and West Bengal were left with barely any funds for infrastructure, since most of the budget went toward teacher salaries. Even though dropout rates are higher among the adolescent age group, higher fund priority continues to be given to elementary education over secondary or higher levels of education. Fund utilisation, however, is not the only issue—greater focus also needs to be placed on management. For instance, Bihar spends a large amount of funds on education and teacher recruitment, yet enrolment rates remain steady or even low, whereas Kerala, through proper management, sets an ideal model for education.
The findings also revealed that a significant portion of funds remain unspent due to paperwork formalities, such as pending approval certificates and slow processing. The two districts studied closely in the case study—Chittoor and Sitapur—reflected the same issues observed at the national level: fund underutilisation, construction delays, and weak teacher recruitment.
5.2. Policy Suggestions
Drawing on “Public Expenditure on Education in India – A Trends and Growth” by K. Udayakumar, S. Rajendran, and A. Sugirtha Rani (2024), the study suggests a few policy changes. To collectively achieve the 6% GDP benchmark for the education sector, the Central government should allocate 2.5% of GDP towards education, while state governments should allocate the remaining 3.5%. Furthermore, the study recommends that more targeted central grants be provided to offset external factors such as varying economic strength across states, in order to maximise positive educational outcomes. A greater share of funds should be allocated towards secondary education, while also sustaining the positive momentum already achieved at the elementary level. Public financing should similarly be increased for higher education, in order to reduce the growing dependence on private funding. Additionally, it is now significant to redirect collective focus towards quality improvement and holistic outcomes—such as teacher training, digital infrastructure, and activity-based learning.
5.3. Assumptions of Study
This study begins with the assumption that the data used is accurate, since the case studies also referenced that due to delay in institutional certifying and data mismatch happen for budgeted and actual expenditure. Accordingly, whatever data has been used across the case studies is assumed to be accurate for the purposes of this study.
Secondly, for years where Budget Estimates were not available, Revised Estimates were used in their place. Years for which Actual Estimates were not available were excluded from the study altogether.
5.4. Limitations of Study
For all twenty-four variables taken up for trend analysis, data was available only for a period of five years, starting from 2016 onwards. At the combined level (covering both Actual and Budget Estimates), data was available for only two variables. Additionally, wherever Budget Estimates were unavailable, Revised Estimates were used in their place throughout the study.
ACKNOWLEDGEMENT
The main authors of this study are deeply grateful to Pallavi Prasad, Isha Kumari Gupta, Saurav Saroha, Smriti Bezbaruah for their valuable contribution in this research.
REFERENCES
- A2Z Taxcorp LLP. (2026, April 11). CAG slams Modi government over ₹54,282 crore in unaccounted spending.
- Accountability Initiative (Centre for Policy Research). (n.d.). Budget Briefs & State Education Finances Analysis.
- Accountability Initiative. (2021). Samagra Shiksha, GoI Budget Briefs. Centre for Policy Research (CPR).
- Analysis of Budget Expenditure on Education for various years by Ministry of Education, Government of India.
- Balodi, B., & Srivastava, A. (2021). Government expenditure on education: A study of Centre and States in India. Educational Quest: An International Journal of Education and Applied Social Sciences, 12(2), 1-11.
- Bordoloi, M., Pandey, S., Irava, V., & Junnarkar, R. (2020). State education finances: A deep-dive into school education finances in eight states. Centre for Policy Research, Accountability Initiative.
- Bose, S., Ghosh, P., & Sardana, A. (2018). Resource Allocation and Utilization in School Education (Working Paper No. 220). National Institute of Public Finance and Policy (NIPFP).
- Business Standard. (2017, March 8). Adhere to spending cap in March: FinMin to ministries.
- Business Standard. (n.d.). Bihar succeeds and slips in closing school education gap with Kerala. https://www.business-standard.com/india-news/bihar-succeeds-and-slips-in-closing-scho-ol-educ ation-gap-with-kerala-126071700434_1.html
- Choudhary, J. (2026). Demand for grants analysis 2026-27: Education. PRS Legislative Research.
- Comptroller and Auditor General of India. (2026). Financial Audit Report on Accounts of the Union Government 2024–25. Tabled in Parliament, 2 April 2026. cag.gov.in.
- Constitution of India, Seventh Schedule; as amended by the Constitution (Forty-second Amendment) Act, 1976.
- Dailyhunt / News Arena India. (2026, April 15). CAG reports ₹54,282 crore unaccounted govt spending.
- De, A., & Endow, T. (2008). Public expenditure on education in India: Recent trends and outcomes (RECOUP Working Paper No. 18). Collaborative Research and Dissemination (CORD).
- Dongre, A., & Kapur, A. (2016). Trends in public expenditure on elementary education in India.
- Drèze, J., & Sen, A. (2013). An Uncertain Glory: India and its Contradictions. Princeton University Press.
- ForumIAS. (2023). March Rush. forumias.com/blog/march-rush.
- Government of India, Ministry of Finance. (2017). General Financial Rules, 2017 — Rule 238 (Utilisation Certificates).
- Guleria, N., Mittal, R. K., Isha, T., & Goutam, S. (2025). Public expenditure on education in India: Trends and implications. International Journal of Engineering Technologies and Management Research, 12(6), 32–50.
- Gundimeda, H., & Asah, S. (2016). Budgeting for School Education in India: An Analysis of Allocations and Expenditures. Centre for Budget and Governance Accountability (CBGA).
- Gupta, R. (2020). Public expenditure and school education in India: With special reference to Jharkhand. International Education & Research Journal.
- Hoque, N., & Mahanta, R. (2024). What Determines Public Funding for Elementary Education in India? Evidence From Before and After a Policy Change. Journal of Public Affairs, 24(4).
- Insights on India. (2025, March 29). Underutilization of Funds in India: Causes, Impact & Solutions.
- Kameshwara, K. K., Shields, R., & Sandoval-Hernandez, A. (2023). Decentralisation in School Management and Student Achievement: Evidence from India. Journal of Development Studies, 59(12), 2369–2388.
- Kumari, P. (2024). A study on education expenditure in India: Since 1991-92 to 2022-23. International Journal of Creative Research Thoughts.
- Kundu, P. (2018). Budgeting for school education: What has changed and what has not? Centre for Budget and Governance Accountability (CBGA) and Child Rights and You (CRY).
- Kundu, P., & Rastogi, D. (2020). Budgetary analysis of Samagra Shiksha Abhiyan: A case study of two districts in Andhra Pradesh & Uttar Pradesh. Centre for Budget and Governance Accountability (CBGA) and Child Rights and You (CRY).
- Motkuri, V., & Revathi, E. (2024). Private and public expenditure on education in India: Trend over last seven decades and impact on economy. Indian Public Policy Review, 5(1), 90-112.
- Musgrave, R. A. (1959). The Theory of Public Finance: A Study in Public Economy. McGraw-Hill.
- NewsGram Desk. (2026, May 11). CAG Flags ₹54,282 Crore in Unaccounted Expenditure by Centre. newsgram.com.
- NITI Aayog. (2026). School education system in India: Temporal analysis and policy roadmap for quality enhancement. Government of India.
- Oates, W. E. (1972). Fiscal Federalism. Harcourt Brace Jovanovich.
- Patel, H. (2026). A five-year budget trend analysis and evaluation of important priority areas for education financing in India (2020–2025). International Journal of Multidisciplinary Research and Growth Evaluation, 7(1), 382-387.
- Phukan, S., & Bonia, B. (2022). Budget 2022-23 analysis on education: Mega push for digital education.
- PRS Legislative Research. (n.d.). State of State Finances Report.
- PRS Legislative Research. (2022). Demand for Grants 2022–23: Ministry of Education. PRS Legislative Research.
- PRS Legislative Research. (2025). Demand for Grants 2025–26: Ministry of Education. PRS Legislative Research.
- Rao, M. G., & Sen, T. K. (1995). Fiscal Federalism in India: Theory and Practice. National Institute of Public Finance and Policy (NIPFP).
- Reserve Bank of India (RBI). (n.d.). State Finances: A Study of Budgets of 2022-23.
- Santhosh, S. (2015). Trends in India’s Education Budgeting. Centre for Civil Society.
- Sharma, M. R. (2023). Locating Contemporary Indian Federalism: Contextualising the Trends of Centralisation with Changing Dynamics. South Asian Survey, 30(1), 45-71.
- Singh, R., Bhattacharjee, S., & Nandy, A. (2024). Fiscal decentralization for the delivery of health and education in Indian states: An ongoing process is more desirable than a policy shift. Journal of Policy Modeling, 46(2), 254-271.
- Singh, U. (2019). A comparative study of the trends of public expenditure on education in India with special reference to school education. Journal of Economic & Social Development, 15(1), 111-128.
- Tiebout, C. M. (1956). A Pure Theory of Local Expenditures. Journal of Political Economy, 64(5), 416-424.
- Tilak, J. B. G. (2003). Public expenditure on education in India: A review of trends and emerging issues. In Financing Education in India.
- Tilak, J.B.G. (1989). Center-State Relations in Financing Education in India. Comparative Education Review, 33(4), 450-480.
- Tilak, J.B.G. (2018). India: The Unfulfilled Need for Cooperative Federalism. In Higher Education in Federal Countries: A Comparative Study (pp. 258-305).
- Udayakumar, K., Rajendran, S., & Sugirtha Rani, A. (2024). Public expenditure on education in India – A trend and growth. Shanlax International Journal of Economics, 12(3), 38–46. https://doi.org/10.34293/economics.v12i3.7440
LIST OF FIGURES
Figure 4.2.1. Trends in Education Expenditure by Education Department at Centre, States/UTs and Combined Level
Figure 4.2.2. Trends in Education Expenditure by Education Department + Other Department at Centre, States/UTs and Combined Level
Figure 4.2.3. Gap in Education Expenditure by Education Department at Centre, States/UTs and Combined Level
Figure 4.2.4. Gap in Education Expenditure by Education Department + Other Department at Centre, States/UTs and Combined Level
Figure 4.3.1. Gap in Education Expenditure on Elementary and Secondary Education at Centre, States/UTs and Combined Level
LIST OF TABLES
Table 4.4.1. Data Matrix: Allocation vs. Spending Reality (Case Study 1)