AUTHORS: RASHI SINGH, AROHI, ANANYA GUPTA, HANNAH, DISHA GOSWAMI, HARSHAD, PRINCE, PARVATHY
Abstract
India’s public expenditure on school education has increased over the past two decades, although independent evaluations of early learning are much lower than required competencies for grades. The difference between investment expenditure and learning outcomes achieved is precisely the issue addressed in this paper. Drawing on a state-level panel that pairs disaggregated education-budget data with structural inputs (pupil-teacher ratios) and independently assessed learning outcomes (ASER), the study progresses from macro-level trend analysis to pooled cross-sectional correlation and a first-differenced, state-fixed-effects panel. The descriptive record shows education’s share of state budgets drifting downward even as classroom staffing improved, while learning followed a non-monotonic, V-shaped path of pandemic-era decline and partial recovery. Once state heterogeneity is differenced out, neither aggregate expenditure share nor pupil-teacher ratio retains a statistically significant association with learning. Rather than implying that public spending is irrelevant, the results indicate that aggregate expenditure is a poor proxy for the quality of education: the expenditure-learning relationship in India is conditional, regime-dependent, and heterogeneous across states. The paper argues that whether, and by how much, expenditure improves learning in India’s lowest-performing states remains the critical unanswered question in Indian education finance, and it specifies threshold and quantile regression on disaggregated data as the targeted next step this baseline evidence motivates.
Keywords: public education expenditure; learning outcomes; ASER; state-level panel; fixed-effects regression; threshold regression; quantile regression; NEP 2020; NIPUN Bharat; expenditure composition; education finance; India
1. Introduction
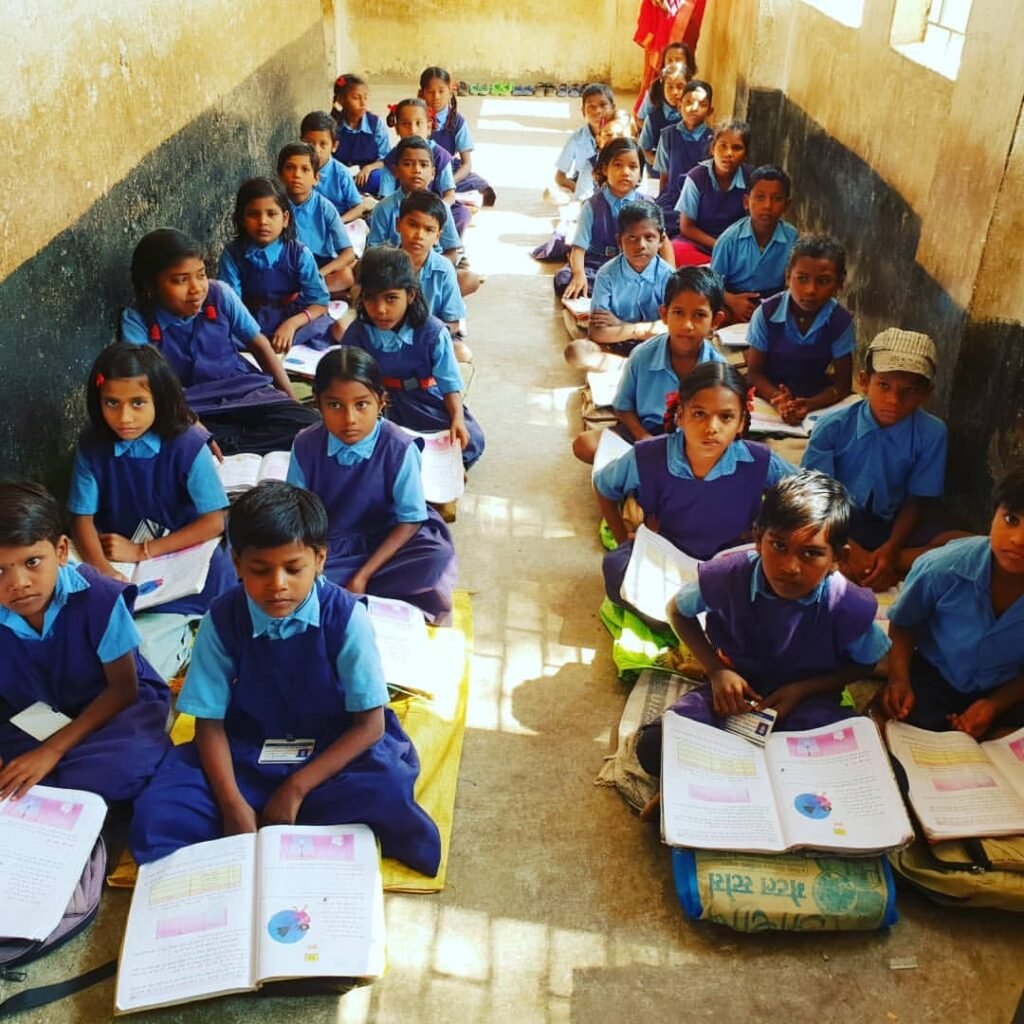
Imagine a large, three-storey building -well maintained, equipped with classrooms, laboratories, and air conditioning: a government school. You enter a Grade V classroom and, for the sake of curiosity, ask three students to solve a long-division problem. Only one can; the others visibly struggle. What went wrong?
The question is not rhetorical. A World Bank assessment reports that nearly half of India’s ten-year-olds cannot read and understand a simple text, and ASER 2024 finds that three out of four Standard III students in government schools cannot read a Standard II textbook. They are not only numbers, they represent the reality of students in government schools today. “Education is the most powerful weapon which you can use to change the world,” has been a common quote for many years, but the facts on basic education speak a different tale.
India’s school-education system presents one of the most consequential puzzles in contemporary public policy: which is an increased investment in schooling for children without any commensurate gain in learning levels. Since the introduction of the Sarva Shiksha Abhiyan program, which made universal elementary education central to national policy, there has been a significant rise in government expenditure on schooling. But when the question shifts from whether children attend school to whether they learn while attending it, the picture changes completely. The Annual Status of Education Report (ASER), which measures foundational reading and arithmetic among school-going children, has documented for nearly two decades that most children in government schools cannot read or perform arithmetic at grade-appropriate levels.
This paper uses the above dilemma as the central analytical issue and poses a series of questions: Is greater spending better for learning, and under what circumstances would the public money spent have the biggest impact on learning? The questions need to be explored with a better understanding than just asking whether there is a relationship between spending and learning. Issues such as what type of spending, spending levels, and the conditions of spending need to be considered. As equally important is the diversity of the federal education system in India where expenditures and learning outcomes differ from one state to another.
With regard to this problem, the need for an effective educational policy was greatly emphasized by the implementation of the National Education Policy (NEP) 2020, which symbolizes an unprecedented institutional change with respect to India’s perception of educational success from “schooling for all” to “learning for all.” This reframing is, in effect, an official acknowledgement that the input-expansion model of the Sarva Shiksha Abhiyan era has reached diminishing returns with respect to what ultimately matters.
The existing literature on the expenditure-learning relationship in India leaves an important gap. No prior study estimates that relationship on a multi-year, multi-state panel while simultaneously allowing for non-linear threshold effects and permitting the effect to differ between low- and high-performing states. Every earlier design falls short on at least one dimension: two-point compound-growth comparisons and single-state case studies produce findings that cannot be generalised and cannot identify the functional form of the relationship, while simple correlational designs impose linearity and assume that the relationship between spending and learning is constant across all spending levels -an assumption the literature itself predicts to be wrong.
This paper therefore examines the relationship between public education expenditure and learning outcomes across Indian states within a state-level panel framework. It advances two propositions that the ASER 2024 pedagogy-driven recovery makes plausible: first, that the composition of spending moves learning outcomes more than its volume; and second, that treating education expenditure as a single aggregate is the central measurement failure of the prior literature. The novelty of the study lies less in asking new questions than in replacing poorly posed ones with better ones, and in deploying a tiered empirical strategy in which each estimator is a targeted response to a documented failure of previous work. The analysis reported here establishes the descriptive and fixed-effects baseline; on the strength of what that baseline reveals, it specifies threshold and quantile regression on disaggregated fiscal data as the analytical program the evidence motivates.
2. Literature Review
Public expenditure on school education in India has risen substantially, in nominal and real terms, over the past two decades, yet independent assessments continue to record learning levels far below grade-appropriate competency. This chapter reviews the empirical, theoretical, and policy literature bearing on that paradox, drawing on descriptive budget-trend analyses, regression-based panel studies, efficiency-frontier estimations, systematic reviews, and state-specific case studies. The review is organised thematically rather than source by source; each section closes by stating what the evidence implies for Indian education policy and for the design of the empirical analysis undertaken here. The cumulative argument is that the expenditure-learning relationship in India is unlikely to be linear, homogeneous, or well captured by aggregate national data, and that a state-level panel design employing fixed-effects, threshold, and quantile estimators is therefore the appropriate next analytical step.
2.1 The Motivating Puzzle: Access and Spending Have Risen, but Has Learning Followed?
The starting point of this paper is a divergence, now well documented in the global education-monitoring literature, between what education systems deliver in terms of access and what they deliver in terms of learning. Varghese, Sarup, De and Sinha record that completion rates in India have improved steadily -from roughly 85 to 87 percent at the primary level, 74 to 77 percent at lower secondary, and 54 to 59 percent at upper secondary -alongside a continuous decline in out-of-school children. Because these figures are drawn from administratively reported data, they invite a further layer of interpretation: read descriptively, they are success indicators; read analytically, they change the nature of the policy problem, since once enrolment approaches saturation, additional expenditure can no longer be justified by, or evaluated against, access gains. India’s education challenge is no longer getting the children enrolled in the school. It is making sure that they are learning once getting there. Thus the education spending should be assessed by the improvements in foundational skills learning outcomes. NEP 2020 is significant because it recognize this shift at the policy level.
Data released since NEP 2020 doesn’t resolve this puzzle so much as give it sharper edges. ASER 2024, the first post pandemic nationwide survey shows a substantial recovery in foundational reading among standard Ⅲ students in government schools and notably, government schools recovered faster than private ones. Two things stand out here. First, the improvement seems to be less associated to increased aggregate education expenditure and more to targeted teaching efforts such as NIPUN Bharat, which focused on foundational learning and was implemented largely within existing budget. This supports the view that the effectiveness and composition of spending matters more than the total amount spend (Wadhwa, 2025). Second, the recovery is incomplete and uneven. Many standard Ⅲ children in government schools still cannot read a standard Ⅱ level text; arithmetic skills remain weaker than reading skills, and the progress differs from one state to another. Thus the post-NEP evidence does not answer the question of why higher spending does not consistently lead to better learning. Instead, it raises a more specific question: why do states with similar spending ends upon different learning trajectories? A state level panel design with heterogeneous effect estimators is well suited to answer this question.
The same access-learning conflation reproduces itself at the state level. Saravanakumar and Krishnamoorthy (2023) show that even in Tamil Nadu, a state widely regarded as an education leader, official policy language remains dominated by access metrics. This demonstrates that the access bias is not a symptom of educational backwardness that will disappear as states develop; it persists at the frontier of Indian educational attainment, which suggests it is embedded in how educational success is administratively defined and reported, not in resource scarcity. It also cautions against a simple convergence narrative in which laggard states need only emulate leaders, since if the leaders themselves measure the wrong outcome, emulation transmits the measurement error. This is a further reason the present study takes independently assessed learning outcomes, rather than administratively reported enrolment or completion, as its dependent variable. Even though the government budget have given more attention to skilling and digital education, the total spending on education is still below the target of 6% of GDP, which was first recommended by the Kothari Commission in 1966 and later repeated in NEP 2020 (Patel, 2026).
2.2 Theoretical Foundations: From Quantity of Schooling to Quality of Learning
The core difference is between the quantity of schooling the children receive—such as years in school, access to school, and facilities— and the quality of learning, meaning what they are actually able to read, understand, calculate, and apply. The question of whether more spending leads to better learning has been debated internationally for more than five decades. Coleman et al.(1966) and Jencks et al.(1972), based in US, found that students’ family background and socio-economic conditions explained more of the differences in academic achievement than differences in school resources. The antithesis came from the school-effectiveness literature: Purkey and Smith (1983) showed that school-level factors also matter for achievement. The implicit synthesis is important -the disagreement was never really about whether schools matter, but about whether the crude aggregate “expenditure” captures the school-level mechanisms that do. That synthesis is the intellectual origin of the disaggregation agenda this review pursues.
The subsequent econometric debate replayed the same structure at a higher level of sophistication. Hanushek’s reviews of education production-function studies find no simple, consistent relationship between expenditure and achievement once family background is controlled, while some meta-analyses reach the opposite conclusion (Hedges, Laine, & Greenwald, 1994). The disagreement was resolved only once credibly identified quasi-experimental evidence became available: Jackson, Johnson and Persico (2016) show that when funding increases are sustained and exogenous, they improve long-run educational and economic outcomes. Setting these three methodological generations side by side -vote-counting reviews, meta-analysis, and quasi-experimental identification -makes the source of the earlier disagreement visible: the answer to “does money matter?” depends on whether the spending variation studied is exogenous, sustained, and specified by level and type. The relevance to the present study is threefold. A state-level panel with fixed effects removes time-invariant state heterogeneity (the panel analogue of the family-background controls the early literature lacked); threshold regression tests, rather than assumes, whether the expenditure effect is constant across spending regimes; and quantile regression tests whether the effect is constant across the outcome distribution.
For a developing-country setting, Glewwe and Muralidharan (2015) provide the most comprehensive synthesis of causally identified evidence on education interventions. They conclude that many “standard” inputs captured by aggregate expenditure -additional textbooks, classrooms, general infrastructure -are frequently not cost-effective at improving learning, whereas specific, typically cheaper interventions are: above all, pedagogy-focused instruction targeted at children below grade level (the “Teaching at the Right Level” approach) and reforms improving governance and teacher accountability. Their headline conclusion -that the efficiency of education spending in developing countries can typically be improved more by reallocating expenditure than by increasing its aggregate amount -implies for Indian policy that the long-running debate over reaching six percent of GDP, while fiscally legitimate, is incomplete as a learning strategy. For this paper, it reframes the research question with greater precision: the issue is not only whether spending predicts learning, but under what conditions, at what levels, and for which states it does.
Not every Indian macro-study finds even a weak positive relationship, and the strongest null result deserves careful interpretation. Singh and Shastri (2020), applying ARDL bounds-testing and vector error-correction methods to national time-series data for 1987-2017, find public education expenditure statistically ineffective in influencing either educational attainment (proxied by the secondary Gross Enrolment Ratio) or unemployment. Three features of their design plausibly explain why a national time series would fail to detect an effect that exists at the state level: aggregation bias, whereby heterogeneous positive and null effects across states cancel to a statistical zero; limited identifying variation, since a slowly trending annual series offers little to identify after differencing; and outcome choice, since GER is a saturated access measure and regressing it on rising expenditure is biased towards zero by construction. Read this way, the null is not evidence that money never matters in India; it is evidence about where such an effect cannot be found. It thereby supplies the negative half of this paper’s methodological justification: if national aggregates obscure the relationship and single-state case studies cannot generalise it, a multi-state panel exploiting cross-sectional variation in both expenditure and independently measured learning is the natural remaining design space.
2.3 Trends and Inequality in Indian Education Expenditure
2.3.1 The persistent gap between policy ambition and fiscal effort
The most consistent single fact in the Indian fiscal-education literature is the six-decade failure to reach the Kothari Commission’s target of public education spending equal to six percent of national income, reiterated in every subsequent policy document up to and including NEP 2020. A target reaffirmed for sixty years without ever being met signals a structural condition, not an accident of any particular budget. Chakrabarti and Joglekar (2006) locate the turning point in the fiscal consolidation accompanying the 1991 reforms: real per-capita education spending growth fell from 6.37 percent annually in the 1980s to 4.48 percent in the 1990s. Education spending in India has behaved as a residual claimant on the budget -expanding when fiscal space allows and contracting when consolidation demands -rather than as a protected priority, and policy pronouncements have functioned as substitutes for, rather than commitments to, fiscal effort. The mechanism by which chronic underfunding affects learning is identified consistently across the literature: because the salary bill is contractually rigid, fiscal squeeze falls almost entirely on the non-salary, quality-enhancing margin -teaching-learning materials, teacher training (about one percent of school budgets; Ur and Rassendren, 2021), academic supervision, and remediation. Underfunding thus damages learning selectively, by hollowing out precisely the components most plausibly linked to instruction, giving the aggregate-spending variable a built-in attenuation problem that a disaggregated design is intended to mitigate.
Stagnation has persisted into the twenty-first century. Bose, Noopur and Nayudu (2022)show that while nominal education spending grew substantially over 2005-2020, real growth decelerated across successive Finance Commission cycles as nominal GDP growth itself slowed. The 14th Finance Commission’s reform needs careful examination because its effect on education quality could have deviated from the original objective. Though it increased states’ share of divisible tax pool from 32% to 42%, it simultaneously removed sector-specific education grants. The rationale was that the states could use the untied funds more effectively according to their needs and interests. However this greater financial freedom did not translate into increased educational expenditure across the states, nor did it reduce the disparities state-level education spending. General-purpose transfers were absorbed into competing heads, and states with weak revenue bases and weak political constituencies for education -often the same states with the worst learning outcomes -did not protect education budgets. The episode demonstrates that the composition of transfers matters as much as the quantum, and it constitutes a candidate structural break in the expenditure-outcome relationship within the panel period -a policy-generated source of the non-linearity a threshold specification is designed to detect.
2.3.2 India’s fiscal effort in comparative perspective
India’s aggregate effort is low not only against its own target but against comparable developing and emerging economies. Combined central and state education expenditure has hovered around 2.5-3 percent of GDP, a range Singh and Shastri (2020) corroborate for 1987-2017, and the FY 2023-24 Union Budget took education’s share of total Union expenditure only to 2.51 percent (Htun, 2023). Cross-country data place this effort in unflattering company: among major emerging economies, Brazil spends roughly 5.6-6.1 percent of GDP on education and South Africa about six percent, with smaller developing countries such as Bhutan (6.9 percent) and Bolivia (7.3 percent) exceeding even these (UNESCO Institute for Statistics / World Bank, 2024). Two conclusions follow. First, the constraint on Indian education spending is a matter of fiscal prioritisation, not development level. Second, the comparison also shows that high spenders are not uniformly high performers -Brazil and South Africa spend near six percent with persistently weak learning outcomes -so raising effort without attending to composition and utilisation would replicate other countries’ disappointments. Both halves of that lesson are embedded in this paper’s design. Figure 2.1 sets India’s effort against comparator economies and against the six-per-cent benchmark
Figure 2.1: Government expenditure on education as a share of GDP: India and comparator

Note. Sources: UNESCO Institute for Statistics / World Bank (2024); Htun (2023). India’s range reflects combined central and state expenditure of approximately 2.5–3.0 per cent of GDP. The dashed line marks the six per cent benchmark recommended by the Kothari Commission (1966) and reaffirmed by NEP 2020.
2.3.3 Interstate disparity, equity, and the limits of “more money”
Beneath the low national average lies widening interstate inequality. Real public expenditure per child on school education nearly tripled from ₹4,029 in 2005-06 to ₹10,972 in 2019-20, but the coefficient of variation across states rose from 26.7 to 46.2 percent for school education over the same period. This is active divergence, not slow convergence, and its equity implications are severe because the low-spending states are precisely those with the largest and fastest-growing child populations. Bihar exemplifies the pattern: relative to its own capacity its effort is high -3.7 percent of GSDP on elementary education against Haryana’s 1.24 percent -yet in absolute terms Kerala spent ₹18,203 per child in 2018-19 against Bihar’s ₹4,363. A child’s publicly funded learning opportunity is increasingly determined by state of birth, and because poorer states cannot close the gap through their own effort, the disparity is self-reinforcing; only central redistribution can break the circle. Figure 2.2 presents both movements together.
Figure 2.2: Real public expenditure per child on school education and its dispersion across states, 2005-06 and 2019-20

Note. Panel A reports real expenditure per child; Panel B reports the coefficient of variation across states for school education. Rising dispersion alongside rising means indicates divergence rather than convergence.
At the same time, the disparity data warn against reading the equity problem as purely financial, and they help explain why higher spending does not reliably translate into better outcomes. Three mechanisms recur across the literature and jointly account for the weak gradient. First, composition: where 80-90 percent of budgets are contractually committed to salaries, marginal rupees flow disproportionately into pay revisions rather than instruction. Second, utilisation and governance capacity: allocated funds are spent late, incompletely, or on audit-safe physical items rather than pedagogy, so budget data overstate effective resources most in the weakest-capacity states. Third, efficiency heterogeneity: frontier studies find that most interstate outcome variation reflects differences in the efficiency of converting resources into learning, not resource levels. Expenditure coefficients estimated on the assumption of a single linear relationship will therefore average across states operating in different regimes -below-threshold states where money is genuinely scarce, and above-threshold states where the binding constraint is organisational. Detecting that regime structure is the specific task of the threshold estimator. The design of central transfers reinforces the concern: per-child school-education grants are only mildly progressive, higher-education grants are outright regressive, and after 2015 the central share of total education expenditure fell sharply in precisely the states most dependent on it.
Figure 2.3: Fiscal effort relative to state capacity compared with expenditure 
Note. Panel A reports elementary education spending as a share of GSDP; Panel B reports expenditure per child in 2018-19. A state may record high effort against its own income base while still delivering far fewer resources per child in absolute terms.
2.4 Level- and Composition-Specific Effects of Spending
A recurring methodological complaint is that “education expenditure,” entered as a single undifferentiated variable, obscures more than it reveal. Ravde identifies the failure to distinguish spending by education level and funding agency as the central gap in the Indian evidence base: if different components of spending have effects of different sign and size on learning, then the coefficient on aggregate expenditure is an uninterpretable weighted average -it can be zero even when specific components matter greatly, and it can move over time purely because the composition shifts. A weak or insignificant overall relationship between the educational spending and learning outcomes discussed here, including Singh and Shastri, does not necessarily mean that money has no effect. Instead, it means that total spending is an inadequate measure. Because different types of spending can affect learning in different ways. This is why the present study examines expenditure by category rather than as one total figure. Ansari and Khan (2018) illustrate this issue: bulk of public education expenditure is recurrent spending rather than developmental inputs. Therefore, total education spending may be driven mainly by the components which are not directly associated with learning gains.
Disaggregation by education level reveals allocation patterns with direct consequences for foundational learning. Chakrabarti and Joglekar (2006), in a panel of 15 major states over 1980-2000, find elementary education absorbing 45-50 percent of state education budgets, with expenditure elasticities of 0.838 for secondary, 0.276 for higher, and only 0.137 for elementary education -implying that as states grow richer, incremental resources flow disproportionately away from the stage at which foundational skills are formed. Dubey’s fixed-effects study sharpens the point that levels interact rather than operate in isolation: elementary spending associates negatively, and secondary and higher spending positively, with higher-education access. The relevance to a school-focused study is that levels compete within a single state budget constraint, that misattributing effects across levels is a real risk when spending is aggregated, and that under-provision is system-wide, so reallocating between levels cannot substitute for adequacy at each level. Figure 2.4 plots these elasticities.
Figure 2.4 Expenditure elasticities with respect to state income, by level of education

Note. Source: Chakrabarti and Joglekar (2006), panel of 15 major states, 1980–2000. Elasticities below unity indicate that spending on a level rises more slowly than state income. Elementary education records the lowest elasticity of the three levels.
At all levels of education expenditure, the budget allocation poses critical concern. According to Bose et al. (2022), around 85-90% of elementary education budgets are spent on salaries. This leaves very little money for non-salary spending. As the teacher pay is determined by the pay commission, a new pay award can push the education expenditure to higher level, even when the teaching quality does not improve. Three problems arise from this. First, on the fiscal side, the salary share keeps rising while revenue grow more slowly, leaving an increasingly smaller share for non-salary spending. Second, schools may respond by hiring low-paid para-teachers to overcome salary constraints. But it may risks for teaching quality. Third, structurally, a system where the marginal rupee is captured by pay revisions cannot fix itself without either grant conditions or pay structure reforms. Prior evidence shows that tied, matching education grants have a strong flypaper effect on state spending (Smart & Bird, 2009), which the 14th Finance Commission’s move away from such grants removed. The section establishes that expenditure must enter the empirical model disaggregated by level, and that results must be interpreted in light of a salary-dominated composition that mutes the measurable link between spending and instruction.
2.5 The Allocation-Utilisation Gap and Fiscal-Federal Structural Breaks
Between an allocation in a budget document and a change in a classroom stands a chain of release, expenditure, and use, and Indian literature increasingly identifies this chain, rather than the allocation itself, as the weak link. Three strands converge on the utilisation-learning link. First, within-programme evidence: Indira and Pahwa (2020)show that per-student SSA expenditure actually utilised is strongly associated with reduced dropout and infrastructure creation, while Bose et al. (2022) document that utilisation ratios remained high even as allocations stagnated, with widening allocation-expenditure gaps in West Bengal, Bihar, Odisha and Madhya Pradesh -the states disproportionately recording the weakest ASER trajectories. Second, cross-state efficiency evidence: frontier studies estimate that the
great majority of interstate variation in learning outcomes is attributable to how resources are used rather than how much is available. Third, direct governance evidence: Khatri, Bhatia and Maheshwari (2024) find that expenditure is associated with better outcomes only where implementation, monitoring, and fiscal-federal coordination are adequate. Jointly, these strands justify treating utilisation capacity as the principal intervening variable between allocation and learning -a hypothesis this paper operationalises by testing whether the expenditure-learning relationship exhibits the threshold behaviour that a capacity-mediated relationship implies.
The fiscal-federal dimension requires critical evaluation. Bose et al.’s central finding -that the 14th Finance Commission’s enlarged united devolution failed to raise state education spending or produce convergence -is, on inspection, a natural experiment in grant design whose result contradicts the fiscal-autonomy theory on which the reform rested. The reform assumed states under-spent because tied grants distorted their preferences; the outcome revealed instead that tied grants had been propping education spending up against competing claims, and that removing the earmark exposed a sector with diffuse beneficiaries and long payoff horizons to the short-horizon political economy of state budgeting. For this paper’s design, the transition marks a policy-induced candidate structural break in the middle of the panel window -a second, independent motivation for the threshold specification. On the mechanics of weak utilisation, the literature identifies institutional capacity as the binding constraint: delayed fund releases compress spending into year-end, forcing expenditure into audit-safe civil works rather than instruction; vacancies leave funds unabsorbed; and weak monitoring severs the feedback loop between spending and learning data. Proposals for data-based, predictive-analytics governance point in a plausible direction but currently rest on thin empirical foundations, and are best treated as hypotheses for future evaluation.
2.6 Efficiency-Frontier Evidence: Separating “How Much” from “How Well”
A distinct stream of literature quantifies the utilisation argument by asking how efficiently governments convert expenditure into outcomes. Sinha (2025), estimating a stochastic production frontier on a panel of states (2014-2023) with secondary-school completion as the outcome, finds a positive and significant expenditure effect but, more importantly, technical-efficiency scores ranging from 0.68 to 0.93 (mean
≈ 0.82) and a gamma coefficient of 0.712, indicating that most interstate outcome variance reflects inefficiency in resource use rather than noise or expenditure differences. Rosario and Shanmugam (2024), applying a generalised (Ray) frontier to Indian states’ elementary outcomes over 2009-10 to 2018-19, reach the same structural conclusion -around 96 percent of outcome variation is efficiency-driven -identifying Kerala, Maharashtra, and Himachal Pradesh as efficient and Arunachal Pradesh, Sikkim, and Tripura as inefficient. This evidence is the quantitative counterpart of the qualitative conclusion reached by Glewwe and Muralidharan (2015): the binding constraint on learning is more often how spending is used than how much is available. Methodologically, frontier analysis and this paper’s threshold design are complements addressing the same heterogeneity from different directions, which is why a frontier analysis is designated as the natural robustness extension that cross-validates the threshold interpretation.
2.7 State- and Micro-Level Evidence Linking Expenditure to Learning Outcomes
This section reviews Indian evidence connecting public education expenditure to measured outcomes at the state and household level, distinguishing throughout between structural outcomes (enrolment, pupil-teacher ratios, dropout, infrastructure) and cognitive learning outcomes (independently assessed reading and arithmetic), because the central finding of the Indian literature is that expenditure reliably buys the first and unreliably buys the second. On structural outcomes the evidence is consistent and
positive: several studies find higher expenditure associated with improved GER, PTR and school infrastructure. But these gains are self-limiting (enrolment and infrastructure saturate), administratively convenient rather than welfare-fundamental (schooling is an input into learning, not the objective), and they generate a perverse measurement equilibrium in which administrations rationally report and target the fast-responding structural indicators over slow-responding learning. The distinction between structural improvement and learning quality is therefore not a nuance but the organising fact of the Indian evidence, and it dictates this paper’s choice of cognitive outcomes as dependent variables.
On cognitive outcomes, the evidence is discouraging over the pre-NEP decade and mixed thereafter. Rajeshwari and Rassendren (2021), analysing ASER 2010-2018, conclude that rising public spending did not translate into improved learning in rural government schools; Kundu and Biswas (2019) report deteriorating achievement across most states. The measurement base itself requires critical handling: Johnson and Parrado (2021) show that National Achievement Survey scores are implausibly high and uncorrelated with state income (A. Singh, 2020), whereas ASER, though volatile, behaves like a credible measure -which is why the present study uses ASER rather than NAS, treating survey-to-survey volatility with multi-year panel averaging. The state-level evidences tell the same story: Karnataka’s education spending reportedly doubled between 2015 and 2025, however, its NAS performance declined between 2017 and 2021. Madhya Pradesh also saw a large drop in the share of class Ⅴ children who could read a class Ⅱ level text, despite continued investment in education. In contrast, ASER 2024 reported a recovery in learning outcome, particularly within government schools. This recovery coincided with a stronger focus on foundational literacy and numeracy through teaching focused programme, rather than a substantial rise in overall spending. The comparison indicates that learning gains arise from strategic allocation of resources towards effective teaching and learning support. Two mechanisms explain the weak gradient: inefficiency within the public system, in which government schools spend more per student than private schools yet produce lower measured learning, and the weight of out-of-school determinants such as social status, parental literacy, and gender.
2.8 Confounding and Upstream Determinants Beyond Education Spending
A final strand warns against attributing all variation in learning to education expenditure. Kapur, Pandey and Sharma’s (2025) child-budgeting work shows that education absorbs 65-77 percent of Union child-specific expenditure while nutrition spending under Mission Poshan 2.0 has declined in real terms and child protection receives merely 1-2 percent of child-focused allocations; Early Childhood Development spending averages only 0.7 percent of Union expenditure, and ASER 2023 found 40 percent of rural children aged three to six without access to preschool or Anganwadi services. By the production-function logic above, child nutrition, health, and pre-school stimulation are inputs into the same learning process as school expenditure, they vary systematically across states, and they plausibly correlate with state education spending; omitting them therefore biases the education-expenditure coefficient, most likely upward. The empirical strategy for handling these confounders is threefold: state fixed effects absorb all time-invariant components of interstate differences in health, nutrition, and ECD environments; time-varying observable proxies are entered as controls where state-year data permit; and the residual risk of time-varying unobservables is acknowledged explicitly in the limitations rather than assumed away.
2.9 Synthesis: The Research Gap This Paper Addresses
Integrated critically, the literature yields four findings that jointly define the space for this study. First, expenditure growth has been real but has purchased access and infrastructure far more reliably than cognitive learning, with ASER 2024’s pedagogy-driven recovery underscoring that when learning has moved, composition rather than quantum moved it. Second, the treatment of expenditure as a single aggregate is identified across the literature -most explicitly by Ravde -as the central measurement failure. Third, the relationship is mediated: by utilisation capacity, by composition and level, and by pedagogy and governance, mechanisms that jointly predict non-linearity and heterogeneity rather than a constant effect. Fourth, the efficiency literature quantifies the mediation, attributing up to 96 percent of interstate outcome variation to efficiency of use rather than resource levels. These are four views of one underlying structure -an expenditure-learning relationship that is conditional, regime-dependent, and heterogeneous across states. Figure 2.7 represents this structure schematically.
Figure 2.7 Conceptual framework: the mediated relationship between public education expenditure and foundational learning

Note. The framework represents the argument synthesised from the literature reviewed in Chapter 2. Solid paths run through the mediating mechanisms; the dashed path is the direct aggregate-expenditure effect estimated in this paper. Upstream determinants that are time-invariant at state level are absorbed by the fixed-effects specification.
The research gap follows directly and can be stated in one sentence: no existing study for India estimates the expenditure-learning relationship on a multi-year, multi-state panel while simultaneously allowing for non-linear threshold effects and for the effect to differ between low- and high-performing states. Prior designs each fail on at least one count: two-point comparisons and case studies cannot identify functional form; simple correlational designs impose linearity; national time series aggregate away the very cross-state variation in which the answer resides; and the frontier studies, while quantifying efficiency, do not estimate the expenditure effect’s dependence on spending regimes or outcome position. The equity issue makes this question particularly important. It is not clear whether education spending produces better results in low- performing states than in better performing states. And none of the literature reviewed here actually estimates it. That’s the gap this study tries to fill. It builds a state level panel dataset that combines education expenditure data with independently measured learning outcomes. It first estimates a fixed-effects model to examine the average relationship between spending and learning. It then uses threshold and quantile regression to test whether this relationship differs across levels of performance. Finally, it uses an efficiency-frontier approach as a robustness check to see whether the main findings remain consistent under a different method.
3. Data and Methodology
3.1 Research Design
Previous studies have largely been limited to two-period comparison designs and have examined the expenditure-outcome relationship by using only one aggregate financial variable, simple linear regressions and non-cognitive measures of outcome such as enrolment. This study addresses these limitations by adopting a multi-year, multi-state panel design, based on 28 states. By combining expenditure data with structural inputs (the pupil-teacher ratio) and cognitive measures of learning (ASER), and using a first difference model, the design allows for the control of state-level unobservable inefficiencies and examines how changes in expenditure affect student learning. The analysis proceeds through a multi-step process that starts with macro-level descriptive trends and leads to a first-differenced, state fixed effect panel, and reserves disaggregated threshold and quantile estimations for the extended design motivated by the baseline results.
3.2 Data and Sources
The study uses three independent, official and independently sourced data sets, chosen on account of their reliability and state-level coverage. Since there is no data set that covers educational finance, school-level inputs, and independently assessed learning in Indian states, the use of more than one data source is justified. The series capture the fiscal commitment of state governments, the school-level structural input conditions and the learning outcomes of the students, covering school education in 28 major Indian states, with the outcome series restricted to rural India.
State budget expenditure: Official budget documents of state governments cover the financial years 2015-16 to 2024-25. Instead of using expenditure figures in rupees, the study measures education expenditure as a share of the total budget of the state under the heading Education, Sports, Art and Culture. Expressing expenditure as a budget share reflects the importance given to education in state government budgets rather than increases arising mainly from inflation and increase in the volume of overall government expenditure.
UDISE+ pupil-teacher ratios: The Unified District Information System for Education Plus provides pupil-teacher ratios in primary, upper-primary, secondary, and higher-secondary schools for 2022-23 and 2024-25. PTR is the key structural input indicator, since teacher availability is a major component of education expenditure and a commonly used indicator of classroom inputs. An increase in PTR indicates more teachers, but previous literature has shown that a decrease in class size does not always translate into learning gains.
ASER learning outcomes: The Annual Status of Education Report provides household-based, independently assessed measures of foundational literacy and numeracy among rural children for 2018, 2022, and 2024. ASER was chosen since the independent household administration of the test decreases chances of score inflation through schools and independent sources of expenditure, staffing, and learning reduce chances that observed relationships could be driven by the specific way of reporting at the agency involved. There are four indicators in the study: the percentage of children in Standard III and Standard V who can read Standard II material, the percentage of children in Standard III who can do subtraction, and the percentage of children in Standard V who can do division. There is one scope clarification: government schools only ASER numbers referenced in the literature review are at a different level compared to the rural data of all school types here but have the same broad V shape. There is a state GSDP per capita series, matched to the pooled sample, as a standard income indicator for the state. Both the datasets have different scope and periodicity but are complementary in terms of reflecting fiscal commitment, schooling input, and outcome respectively.
A state GSDP-per-capita series, matched to the pooled sample, is included as a standard proxy for state income. Although the datasets differ in coverage and periodicity, they complement one another: budget data reflect fiscal commitment, UDISE+ captures schooling inputs, and ASER provides an independent assessment of outcomes. Analyses are restricted to years for which overlapping observations are available, while longer-term trends are examined using compound annual growth rates. Sample sizes vary by method: the pooled cross-sectional analysis uses n = 53 state-year observations, while the first-differenced panel and multivariate analysis use n = 26 states with complete matched data across both waves. The pooled sample (n = 53) includes all available state-year observations. One observation could not be matched across both waves because of missing data and is therefore retained in the pooled analysis but excluded from the first-differenced panel.
Consequently, the matched panel comprises 26 states observed across two waves (52 observations)
Table 3.1 Datasets used in the study
|
Dataset |
Coverage |
Rationale for selection |
|
State budget expenditure accounts |
28 states, 2015-16 to 2024-25 |
Official record of approved education spending |
UDISE+ PTR data28 states, 2022-23 & 2024-25Government’s comparable staffing
database
|
ASER (rural reading & numeracy) |
2018 / 2022 / 2024 |
Independent household survey of learning outcomes |
|
State GSDP per capita |
Matched to pooled sample (n = 53) |
Standard proxy for state income (control) |
Source: Compiled by authors from state budget documents, UDISE+, ASER (Pratham/ASER Centre), and World Bank/UNESCO Institute for Statistics World Development Indicators.
Figure 3.1 Integration of the three data sources and construction of the two analytical samples

Note. The pooled cross-section retains all available state-year observations (n = 53). The first-differenced panel is restricted to the 26 states with complete matched data across both waves (52 observations). One observation could not be matched across waves owing to missing data.
3.1 Variables
Four ASER indicators are retained rather than a single index because they directly measure cognitive learning in literacy and numeracy; unlike enrolment or attendance, they capture the quality of learning, and separate reading and arithmetic measures across Standards III and V are kept because they exhibit different learning patterns over time. Education-expenditure share and PTR are treated as separate independent variables because they represent different dimensions of educational input -government financial commitment and classroom-level staffing -and are analysed both individually and jointly. GSDP per capita enters the pooled correlation analysis as a control for differences in states’ economic conditions.
Table 3.2 Variables, by category and definition
|
Category |
Variable |
Definition |
|
Dependent |
Std III / Std V reading (Std II text) |
% of children reading at Std II level (ASER) |
|
Dependent |
Std III subtraction / Std V division |
% of children performing the operation (ASER) |
|
Independent |
Education expenditure share |
Education spending as % of total state budget |
|
Independent |
Pupil-teacher ratio (PTR) |
UDISE+ PTR by school level |
|
Control |
GSDP per capita |
State income, matched to pooled sample (n = 53) |
Source: Authors’ construction, based on ASER indicator definitions and UDISE+/state budget variable classifications.
3.2 Empirical Models
The study employs two econometric models: a pooled cross-sectional model to establish baseline static associations, and a core first-differenced panel model (equivalent to a state-fixed-effects specification) to control for time-invariant state characteristics, with a joint multivariate specification used as a robustness check.
Learning Outcomeit = β₀ + β₁(Education Spending Shareit) + β₂(PTRit) + β₃(GSDP per Capitait) + εit, where i denotes the state and t the year; β₀ is the constant term; β₁ and β₂ are the coefficients to be estimated; GSDP per capita is a control for separating budgetary impacts from fluctuating economic circumstances; and ε is the error term.
ΔLearning Outcomei = β₀ + β₁(ΔEducation Spending Sharei) + β₂(ΔPTRi) + εi,
where ΔLearning Outcome represents the change in the observed value of foundational cognitive metrics for state i over the two waves, ΔEducation Spending Share is the change in the share of education spending in the overall state budget, and ΔPTR is the change in the pupil-teacher ratio. The first difference accounts for unobserved time-invariant features of the states.
Analytical strategy
This analysis is a multi-step process. First, trend analysis translates each series into a compound annual growth rate using sub-periods (2018→2022 and 2022→2024 for the outcomes), to avoid an end-period-based growth rate concealing the impact of the pandemic on the observed values. Second, pooled cross-sectional correlation tests static association -whether states that spend more, have lower PTR, or are wealthier also report better outcomes, independent of change over time -via Pearson correlation coefficients. Third, the first-differenced panel regresses changes in outcomes on changes in expenditure share and PTR across the 26 matched states, acting as a rigorous state-fixed-effects model; a joint multivariate specification is applied as a robustness check to verify that neither predictor’s effect is masked by the other.
3.3 Descriptive Findings
3.3.1 Improvement in pupil-teacher ratios, 2022-23 to 2024-25
Classroom staffing improved at every stage of schooling over the two-year window (Table 3.3). This matters for how the rest of the analysis is read: whatever the fiscal record shows about education’s priority within state budgets, the system was not, over this particular window, starving classrooms of teachers. Viewed through a production-function lens, a falling PTR represents an increase in one of the most canonical schooling inputs. Yet PTR is precisely the input that a salary-dominated budget purchases most reliably, and international evidence repeatedly finds class-size reduction to be among the less cost-effective interventions for improving learning. The improvement therefore raises, rather than settles, the question the analysis must hold open -whether a structural gain of this kind was accompanied by a commensurate gain in learning, or whether it moved largely on its own.
Table 3.3 Pupil-teacher ratio by stage, 2022-23 and 2024-25 (UDISE+)
|
Year |
Primary |
Upper primary |
Secondary |
Higher secondary |
|
2022-23 |
20.1 |
15.9 |
15.3 |
23.6 |
|
2024-25 |
17.9 |
15.0 |
13.6 |
20.5 |
Source: UDISE+. Lower values indicate smaller classes.

Figure 1. Pupil-teacher ratio by schooling stage, 2022-23 vs. 2024-25 (plotted from Table 3.3).
3.3.2 A declining fiscal priority for education
Over the same two years in which staffing improved, education’s standing within state budgets moved in the opposite direction (Table 3.4). Education’s share of total state spending declined between 2022-23 and 2024-25 -not as a short-term aberration but as the continuation of a drift running across the full decade. The distinction between rising rupee outlays and a declining budget share is analytically important, because the two measures answer different questions: the rupee series asks whether a state spends more in absolute terms, the share series whether it prioritises education more within a competing set of fiscal claims. On the priority measure, the post-pandemic period has continued rather than reversed the longer-run pattern of de-prioritisation, consistent with the view that education spending behaves less like a protected commitment and more like a residual claimant on state fiscal space. The decade-long series also supplies the within-state fiscal variation on which the panel estimators draw.
Table 3.4 Education expenditure as a share of total state spending, 2015-16 to 2024-25 (28-state mean, %)
|
Year |
Share (%) |
Year |
Share (%) |
|
2015-16 |
16.09 |
2020-21 |
15.24 |
|
2016-17 |
15.50 |
2021-22 |
15.00 |
|
2017-18 |
15.84 |
2022-23 |
15.10 |
|
2018-19 |
15.66 |
2023-24 |
14.75 |
|
2019-20 |
16.22 |
2024-25 |
14.48 |
Source: State budget documents CAGR 2018-19 to 2024-25: −1.30% per year.
Figure 3.4 Education expenditure as a share of total state spending, 2015-16 to 2024-25 (28-state mean)

Source: State budget documents (authors’ compilation), category Education, Sports, Art and Culture. Compound annual growth rate, 2018-19 to 2024-25: −1.30 per cent per year.
3.3.3 Learning outcomes: a V-shaped, not monotonic, trajectory
The path taken by learning from 2018 to 2024 is not one of the two shapes a story can reasonably be expected to tell. Contrary to both the linear decline in the fraction of the budget allocated to education, as well as the linear improvement in the PTR, the ASER indices plot a V (see Table 3.5), representing a drop during the four years 2018-2022, i.e., the years of the pandemic-induced closures of schools, followed by an actual but incomplete recovery until 2024. There are three things which are worth pointing out here. First, the 2022-2024 recovery is genuine and actually faster in percentage terms than the preceding drop.Third, and most consequential for design, the series is decisively non-monotonic. Any strategy that treats 2018-2024 as a single homogeneous period risks averaging a steep decline against an equally steep recovery, producing a misleadingly gentle drift; the V-shape is itself evidence that the expenditure-learning relationship is unlikely to be stable across time.
Table 3.5 ASER foundational learning indicators, rural India, 2018-2024, with sub-period CAGRs
|
Indicator |
2018 |
2022 |
2024 |
CAGR 18→22 |
CAGR 22→24 |
|
Std III can read Std II text |
28.8% |
20.7% |
26.8% |
−7.92%/yr |
+13.78%/yr |
|
Std V can read Std II text |
53.3% |
45.2% |
50.1% |
−4.04%/yr |
+5.28%/yr |
|
Std III can subtract |
26.2% |
23.2% |
26.1% |
−2.99%/yr |
+6.07%/yr |
|
Std V can divide |
29.8% |
24.9% |
29.3% |
−4.39%/yr |
+8.48%/yr |
Source: ASER 2018, 2022, 2024 (all rural children, across school types). Full-period (2018→2024) CAGRs, in order:
−1.23%, −1.03%, −0.06%, −0.28% per year.

Figure 3. ASER foundational learning indicators, rural India, 2018–2024, showing the V-shaped trajectory (plotted from Table 3.5).
3.3.4 A common footing across series, and the extent of state heterogeneity
Placing the fiscal, structural, and outcome series on a common growth-rate footing (Table 3.6) yields an ambiguous rather than conclusive national association. On one hand, the education budget share fell at almost exactly the pace at which reading outcomes fell -a co-movement more consistent with a genuine expenditure-learning link than the “rising spending, stagnant outcomes” disparity of the pre-pandemic decade. On the other hand, class sizes improved markedly over the same window without any corresponding improvement in arithmetic. The national aggregates can be read in either direction, which is precisely why they cannot serve as the study’s evidentiary endpoint.
Table 3.6 Compound annual growth rates across the three series
|
Series |
CAGR, 2018/2018-19 → 2024/2024-25 |
|
Std III reading (Std II level) |
−1.19%/yr |
|
Std V reading (Std II level) |
−1.03%/yr |
|
Std III arithmetic (subtraction) |
−0.06%/yr |
|
Std V arithmetic (division) |
−0.28%/yr |
|
Education exp. share of total budget |
−1.30%/yr |
|
PTR primary (2022-23→2024-25 only) |
−11.6%/yr (falling -an improvement) |
Source: Authors’ calculations, computed from Tables 3.3–3.5 (UDISE+ PTR data, ASER 2018/2022/2024, and state budget documents).
Note: the PTR series is available for two years only; its CAGR is not directly comparable to the six-year rates above it.
The state-level record sharpens the point considerably. Comparing the 2022 and 2024 ASER rounds across matched states, gains in Standard III reading ranged from a small decline in the one state that made no progress to a gain of over 25 percentage points in the best-performing state, with every other state in between. Improvement was uneven not only across states but across subjects within the same state: one high-capacity southern state, for example, combined a substantial gain in Standard III reading with a marked decline in both Standard III and Standard V arithmetic over the identical period. A spread of this width around the national mean -and this degree of internal inconsistency within individual states
-is exactly the heterogeneity a national time series averages away, and it provides the empirical motivation for the quantile approach: if a single period can produce such widely divergent outcome changes across states facing broadly similar fiscal drift, a single average coefficient cannot adequately summarise the relationship. Figure 3.7places the fiscal, structural and outcome series side by side.
Figure 3.7 Fiscal priority, structural input and learning outcome over the study window

Note. Sources: state budget documents (Panel A); UDISE+ (Panel B); ASER 2018, 2022 and 2024 (Panel C). The three series are placed on a common time frame to show that a falling budget share, an improving pupil-teacher ratio and a non-monotonic learning trajectory coincided over the same period.
3.4 Limitations
Several limitations define the scope within which the empirical results should be understood. The most important concerns are differences in data coverage: ASER assesses learning only among rural children, whereas the expenditure data represent total state-level spending across rural and urban areas, so the expenditure variable cannot be read as an exact measure of the resources available to the population ASER assesses. A second limitation relates to the measurement of expenditure: the analysis relies on budgeted expenditure reported in state budget documents rather than verified school-level utilisation, and differences in administrative capacity, delays in fund release, and implementation bottlenecks may weaken the observed relationship. The dataset is further constrained by reporting frequency -PTR is available for only two years and ASER for three non-consecutive years -which limits the number of observations for panel estimation and restricts analysis of long-term dynamics. Finally, substantial variation across states in institutional capacity, governance, and demographic characteristics means that, although the first-differenced design absorbs time-invariant heterogeneity, some unobservable time-varying factors will remain beyond the reach of the available data.
4. Discussion and Interpretation
4.1 Preliminary Regression Results
The descriptive analysis shows trends, but does not show whether there is an association between changes in expenditures and improvements in learning. The regression analyses that will be presented hereafter need to be taken into account as exploratory and not as causal: what the researcher aims to do through the use of such regressions is to check whether there is any trend in the data between expenditure/structural inputs/learning.
4.1.1 Pooled cross-sectional analysis
The pooled estimates relate learning outcomes to education-expenditure share, pupil-teacher ratio, and GSDP per capita across pooled state-year observations (n = 53). Most estimated relationships are statistically insignificant (Table 4.1). Although a few correlations -most notably Standard III arithmetic against PTR, and more marginally against the spending share -appear stronger than others, the overall evidence does not suggest a consistent association between higher expenditure and better learning, and PTR displays only limited explanatory power despite the documented improvement in staffing. These findings must be read cautiously, because pooled cross-sectional estimates combine differences across states with changes over time and cannot distinguish whether observed differences arise from expenditure itself or from broader structural characteristics that simultaneously shape spending and learning.
Table 4.1 Pooled cross-sectional correlations between outcomes and candidate inputs (Pearson r; p-values; n = 53)
|
Outcome |
vs Edu. spending share |
vs PTR (primary) |
vs GSDP per capita |
|
Std III reading |
r = +0.18, p = 0.20 |
r = +0.04, p = 0.77 |
r = +0.01, p = 0.97 |
|
Std III arithmetic |
r = −0.27, p = 0.05 |
r = −0.34, p = 0.01 |
r = +0.18, p = 0.36 |
|
Std V reading |
r = +0.13, p = 0.37 |
r = −0.02, p = 0.91 |
r = −0.13, p = 0.52 |
|
Std V arithmetic |
r = −0.03, p = 0.85 |
r = +0.04, p = 0.76 |
r = −0.19, p = 0.34 |
Source: Authors’ calculations based on ASER, UDISE+, and GSDP per capita data (pooled state-year observations, n = 53).
4.1.2 First-differenced panel analysis
To remove persistent state-specific characteristics, the analysis next estimates first-differenced regressions using matched observations across the 2022-23 and 2024-25 waves (n = 26). By focusing on changes within individual states rather than differences between them, this is equivalent to a state-fixed-effects specification. The results go further than the cross-section: all eight coefficients are statistically indistinguishable from zero (Table 4.2). Every cross-sectional association that showed even a hint of a pattern vanishes once state fixed effects are differenced out, confirming that those correlations were between-state artefacts rather than within-state relationships. Rather than implying that expenditure has no influence on learning, this indicates that the relationship is likely mediated by additional institutional and contextual factors not captured within simple linear specifications.
Table 4.2 First-differenced bivariate regressions, 2022-23 → 2024-25 (OLS on first differences; n = 26)
|
Change in outcome |
vs Δ Edu. spending share |
vs Δ PTR (primary) |
|
Δ Std III reading |
coef = −0.57, p = 0.50 |
coef = +0.001, p = 1.00 |
|
Δ Std III arithmetic |
coef = −0.64, p = 0.52 |
coef = +0.16, p = 0.71 |
|
Δ Std V reading |
coef = −1.08, p = 0.32 |
coef = +0.08, p = 0.86 |
|
Δ Std V arithmetic |
coef = +0.21, p = 0.81 |
coef = +0.15, p = 0.69 |
Source: Authors’ calculations based on matched ASER and UDISE+ data across 26 states, first-differenced 2022-23 to 2024-25.
4.1.3 Multivariate specification
The final preliminary model estimates the joint influence of expenditure and PTR, allowing each to be evaluated conditional on the other (n = 26). The results reinforce the earlier conclusions: neither variable demonstrates a statistically significant independent association with learning after controlling for the other, and the overall explanatory power of the models remains minimal -jointly, changes in the spending share and in class size explain almost none of the cross-state variation in changes in learning (Table 4.3). Average linear relationships alone are therefore insufficient to explain variation in educational performance across Indian states; outcomes appear to depend on a broader combination of fiscal, institutional, and governance-related factors that cannot be represented through expenditure or staffing indicators in isolation.
Table 4.3 First-differenced multivariate regressions, 2022-23 → 2024-25 (both regressors entered jointly; n= 26)
|
Outcome |
R² |
Δ Edu. share coef (p) |
Δ PTR coef (p) |
|
Δ Std III reading |
0.025 |
−0.73 (p = 0.45) |
−0.14 (p = 0.72) |
|
Δ Std III arithmetic |
0.017 |
−0.60 (p = 0.61) |
+0.04 (p = 0.94) |
|
Δ Std V reading |
0.046 |
−1.27 (p = 0.31) |
−0.17 (p = 0.74) |
|
Δ Std V arithmetic |
0.017 |
+0.49 (p = 0.64) |
+0.25 (p = 0.57) |
Source: Authors’ calculations based on matched ASER and UDISE+ data across 26 states, first-differenced 2022-23 to 2024-25.
4.2 Discussion
In spite of the better pupil-teacher ratio, arithmetic at Standard III revealed no significant increase, revealing the gap between education access and education quality. The structural inputs like teacher numbers positively impact the measurable variables, but the cognitive achievement is more contingent: the low correlations between Standard III reading, expenditure share, and PTR and the insignificance of the results with state heterogeneity controlled support the assertion in the literature that money alone does not guarantee any improvement in learning.
This is well supported by the regression analysis. The relationship between expenditure share and learning is not very strong and there is little variance explained in the reading score (r = 0.18, p = 0.20). The negative correlation between PTR and Standard III arithmetic (r = −0.34, p = 0.01) shows that class size has more influence on mathematics learning than money spent; however, after considering the state fixed effect, the correlations become insignificant as both expenditure share and PTR reveal insignificant p-values and trivial R² values. These findings confirm the identification problem identified by Singh and Shastri (2020) that after controlling the state heterogeneity, the aggregate expenditure explains very little about learning.
The statistical null does not mean that public expenditure is unimportant. Rather, it suggests that aggregate expenditure is a poor proxy for the quality of education -an interpretation consistent with Glewwe and Muralidharan (2015), who find that shifting spending toward pedagogy and classroom practice often yields larger learning gains than simply increasing total spending. A plausible explanation for the absence of an observable average effect over the relatively short panel studied here is the salary-heavy expenditure structure, the utilisation gaps, and the interstate governance differences documented in the literature review. The results thus support the view that educational expenditure is a conditional rather than a universal policy instrument.
The main contribution of this study is not to prove that expenditure is unrelated to learning, but to show that the average linear expenditure coefficient is an incomplete representation of the relationship. Descriptive evidence suggested a broad co-movement between declining expenditure priority and learning outcomes, yet the fixed-effects estimates indicate that neither expenditure share nor PTR alone explains short-run improvements in ASER performance. The persistently low explanatory power of the models signals that the factors driving variation in learning are not confined to aggregate fiscal allocations. These results confirm the central proposition that flows from the literature review: the efficiency of education expenditure is determined less by the amount of resources than by their composition, use, and institutional framework.
5. Conclusion
This study set out to examine whether increased public expenditure improves foundational learning across Indian states, and under what conditions public investment is most effective. Combining a decade of education-budget data with structural inputs and independently assessed ASER outcomes, it finds that education’s declining share of state budgets and its improving pupil-teacher ratios coincided with a non-monotonic, V-shaped learning trajectory -and that, once state heterogeneity is differenced out, neither aggregate expenditure share nor PTR retains a statistically significant association with learning. The relationship between education spending and learning in India is, on this evidence, conditional, regime-dependent, and heterogeneous across states, rather than the constant, linear effect that much of the prior literature has implicitly assumed.
The policy implication is clear. Adequate budgets for education remain necessary, but improvements in learning will ultimately depend on how effectively those resources are converted into classroom processes that affect what children actually learn, rather than on the volume of inputs alone. Restoring tied, matching, learning-linked grant components for foundational education, protecting the non-salary share of budgets, and stabilising the flow of funds are the levers the evidence supports. Future research should move beyond aggregate expenditure measures towards disaggregated fiscal data, longer state panels, and heterogeneous estimators -threshold and quantile regression able to identify regime-specific effects, cross-validated by efficiency-frontier decomposition. The single most policy-relevant question this study defines but cannot yet answer -whether, and by how much, expenditure raises learning in India’s lowest-performing states -is precisely the question that disaggregated, heterogeneous-effect design is built to resolve, and to which this baseline analysis points the way.
Acknowledgement
This paper is the result of a collaborative intellectual effort, and we are grateful to the many individuals and institutions whose support made it possible.
We express our sincere gratitude to the International Institute of SDGs and Public Policy Research (IISSPPR) for providing us with the institutional platform, research environment, and mentorship that made this study possible. The guidance and feedback we received through the institute’s research programme shaped both the intellectual rigour and the policy orientation of this paper in fundamental ways.We also wish to acknowledge the broader scholarly community whose work we have engaged with critically and at length in the literature review. The academics whose research we refer to, whether their findings we agree with or not, together establish the academic space that this paper intends to contribute to.
We finally thank one another. The authors of this paper are Ruchi Roy, Rashi Singh, Aarohi, Ananya Gupta, Hannah, Disha Goswami, Harshad, Prince, Seerat, Vidhushi, and Parvathy—through the challenging data, and some differences of opinion on interpretation, all of which contributed to making the analysis better. Academic collaboration being the best form of education, and this project has been that for each of us.
References:
Ansari, T. H., & Khan, M. A. (2018). An analysis of public expenditure on education in India. World Wide Journal ofMultidisciplinaryResearchandDevelopment,4(4),89-92.
ASER Centre / Pratham Education Foundation. (2025). Annual Status of Education Report (Rural) 2024. New Delhi: ASER Centre.
Bose, S., Noopur, N., & Nayudu, A. (2022). Intergovernmental fiscal transfers and expenditure on education in India: State-level analysis, 2005-2020 (NIPFP Working Paper No. 377). National Institute of Public Finance and Policy.https://www.nipfp.org.in/media/documents/WP_377_2022.pdf
Anindita Chakrabarti, & Rama Joglekar. (2006). Determinants of Expenditure on Education: An Empirical Analysis Using State Level Data. Economic and Political Weekly, 41(15), 1465–1472. http://www.jstor.org/stable/4418088
J. S., CaColemanmpbell, E. Q., Hobson, C. J., McPartland, J., Mood, A. M., Weinfeld, F. D., & York, R. L. (1966). Equality of educational opportunity. U.S. Department of Health, Education, and Welfare. http://68.77.48.18/RandD/Other/Coleman%20Report.pdf
De, A., & Endow, T. (2008). Public expenditure on education in India: Recent trends and outcomes (RECOUP Working Paper 18). University of Cambridge. https://nbn-resolving.org/urn:nbn:de:0168-ssoar-69258
Dubey, S. (n.d.). Impact of public education expenditure across different levels on higher education access in India: A panel data study. National Institute of Educational Planning and Administration. https://doi.org/10.1007/978-981-32-9061-7_11
Glewwe, P., & Muralidharan, K. (2015). Improving school education outcomes in developing countries: Evidence, knowledge gaps, and policy implications (RISE Working Paper No. RISE-WP-15/001).https://riseprogramme.org/sites/default/files/2020-11/RISE_WP-001_GlewweMuralidharan.pdf
Government of India. (1966). Report of the Education Commission, 1964–66: Education and National Development (Kothari Commission Report). Ministry of Education.
Hanushek, E. A. (1989). The impact of differential expenditures on school performance. Educational Researcher, 18(4), 45-51.https://doi.org/10.3102/0013189X018004045
Hanushek, E. A. (1997). Assessing the Effects of School Resources on Student Performance: An Update. Educational Evaluation and Policy Analysis, 19(2), 141–164. https://doi.org/10.2307/1164207
Hanushek, E. A. (2003). The failure of input-based schooling policies. The Economic Journal, 113(485), F64-F98. https://doi.org/10.1111/1468-0297.00099
Hanushek, E. A., & Woessmann, L. (2017). School resources and student achievement: A review of cross-country economic research. In Cognitive abilities and educational outcomes (pp. 149-171). Springer. https://doi.org/10.1007/978-3-319-43473-5_8
Hedges, L. V., Laine, R. D., & Greenwald, R. (1994). An exchange: Part I—Does money matter? A meta-analysis of studies of the effects of differential school inputs on student outcomes. Educational Researcher, 23(3), 5-14.https://www.jstor.org/stable/1177220
Htun, K. Z. (2023). Analysis of education expenditure in the Union Budget FY 2023-24. https://www.researchgate.net/publication/373336419_Analysis_of_FY_2023-24_Budget_for_Education_in_India
Indira, M., & Pahwa, S. (2020). Public expenditure under Sarva Shiksha Abhiyan and educational outcomes in India. https://doi.org/10.1729/Journal.23930
Jackson, C. K., Johnson, R. C., & Persico, C. (2016). The effects of school spending on educational and economic outcomes: Evidence from school finance reforms. The Quarterly Journal of Economics, 131(1), 157-218. https://doi.org/10.1093/qje/qjv036
Jencks, C., Smith, M., Acland, H., Bane, M. J., Cohen, D., Gintis, H., Heyns, B., & Michelson, S. (1972). Inequality: A reassessment of the effect of family and schooling in America. Basic Books. https://www.taylorfrancis.com/chapters/edit/10.4324/9780429494642-64/inequality-christopher-jencks-marshall-smith-henry-acland-mary-jo-bane-david-cohen-herbert-gintis-barbara-heyns-stephan-michelson
Johnson, D., & Parrado, A. (2021). Assessing the assessments: Taking stock of learning outcomes data in India. International Journal of EducationalDevelopment.https://doi.org/10.1016/j.ijedudev.2021.102409
Kapur, A., Pandey, T., & Sharma, S. (2025). Investing in India’s children: A look at child budgets. The Hindu CentreforPoliticsandPublicPolicy.
https://www.thehinducentre.com/the-arena/current-issues/investing-in-indias-children-a-look-at-child-budgets/article69076140.ece
Khatri, J., Bhatia, M., & Maheshwari, R. K. (2024). Government expenditure on education and its impact on educational outcomes. International Journal of Novel Research and Development, 9(7). https://www.ijnrd.org/papers/IJNRD2407349.pdf
Kundu, P., & Biswas, S. (2019). Trends in children’s learning achievement across Indian states. https://doi.org/10.1177/09737030221120474
Patel, H. (2026). A five-year budget trend analysis and evaluation of important priority areas for education financing in India (2020-2025). International Journal of Multidisciplinary Research and Growth Evaluation, 7(1), 382-387.https://doi.org/10.54660/.IJMRGE.2026.7.1.382-387
Purkey, S. C., & Smith, M. S. (1983). Effective schools: A review. The Elementary School Journal, 83(4), 427- 452. https://doi.org/10.1086/461325
Rajeshwari, U. R., & Rassendren, M. J. G. (2021). Does public spending on elementary education actually improve learning outcome in India? Ilkogretim Online-Elementary Education Online, 20(2), 237-250. https://ilkogretim-online.org/index.php/pub/article/view/1896
Ravde, C. (n.d.). Public expenditure on education in India: A systematic review of trends, patterns, and impacts. International Journal for Multidisciplinary Research. https://www.ijfmr.com/papers/2026/2/75151.pdf
Rosario, J., & Shanmugam, K. R. (2024). Elementary education outcome efficiency of Indian states: A Ray frontier approach (MSE Working Paper No. 264/2024). Madras School of Economics. https://mse.ac.in/wp-content/uploads/2024/09/Working-Paper-264.pdf
Rudraswamy, N. (n.d.). Beyond budget allocation: Public education expenditure and educational outcomes in Karnataka.TataInstituteofSocialSciences& FiscalPolicyInstitute.https://fpibengaluru.karnataka.gov.in/uploads/media_to_upload1777891147.pdf
Saravanakumar, Dr & Krishnamoorthi, Karuppiah. (2023). Empowering Minds: The Evolution of Higher Education in Tamil Nadu towards Innovation and Excellence.https://doi.org/10.32388/LXTI2J
Singh, A. (2020). Myths of official measurement: Auditing and improving administrative data in developing countries (RISE Working Paper). https://riseprogramme.org/sites/default/files/2020-11/RISE_WP-042-Singh.pdf
Singh, D., & Shastri, S. (2020). Public expenditure on education, educational attainment and unemployment nexus in India: An empirical investigation. International Journal of Social Economics, 47(6), 663-681. https://doi.org/10.1108/IJSE-06-2019-0396
Sinha, J. K. (2025). Efficiency of public education expenditure in India: A stochastic frontier analysis of state-level secondary school completion. Journal of Behavioral Economics and Policy, 1(2). https://doi.org/10.55121/jbep.v1i2.1205
Smart, M., & Bird, R. (2009). Earmarked grants and accountability in government. University of Toronto. https://doi.org/10.2139/ssrn.1498775
UNESCO Institute for Statistics / World Bank. (2024). Government expenditure on education, total (% of GDP) [Data set]. World Development Indicators.https://data.worldbank.org/indicator/SE.XPD.TOTL.GD.ZS
Ur, R., & Rassendren, G. (2021). Analysis of teacher training allocations within school education budgets in India. https://doi.org/10.17051/ilkonline.2021.02.24
Varghese, N. V., Sarup, R., De, A., & Sinha, S. (Eds.). (n.d.). Improving learning outcomes in schools: Understanding the challenge of quality in the Indian context.https://doi.org/10.4324/9781003664222
Wadhwa, W. (2025). ASER 2024: More than a post-pandemic recovery in learning. Ideas for India. https://www.ideasforindia.in/topics/human-development/aser-2024-more-than-a-post-pandemic-recovery-in-learning