Authors: Kislay Prajapati, Ruchi Santosh Agrawal, Lalit Shanappa Gaikwad, Varsha Rai
Abstract
Samagra Shiksha is India’s flagship school education scheme and the financial backbone behind both the Right to Education Act and NEP 2020. Yet despite pulling in a large chunk of the Ministry of Education’s budget, it keeps running into the same problem year after year: states just don’t spend what they’re allocated. This paper looks at why this gap has persisted between 2018 and 2024, and tries to pin down exactly where in the policy process it originates. It used a mixedmethods approach, crunching budget and expenditure numbers alongside a closer read of policy documents, parliamentary reports, CAG audits, and budget briefs. Lasswell’s Policy Cycle Framework provided the structure, letting me trace the scheme through formulation, budgeting, implementation, monitoring, and evaluation. What emerged is that this isn’t a temporary hiccup; it’s structural. Even with rising allocations and new initiatives under NEP 2020, states have typically spent only around two-thirds of what they were approved for. The state-level variation is striking too; Tamil Nadu, for instance, consistently outperforms Maharashtra under the very same scheme. The takeaway: fixing this needs reform across planning, fund release, implementation capacity, monitoring, and evaluation, not just bigger budgets.
Keywords: Samagra Shiksha Abhiyan, Policy Cycle Framework, Fund Utilisation Gap, Fiscal Federalism, NEP 2020, Public Expenditure Management, School Education Finance, India
Introduction
In April 2018, Government introduced Samagra Shiksha Abhiyan (SSA) by integrating Sarva Shiksha Abhiyan (SSA), Rashtriya Madhyamik Shiksha Abhiyan (RMSA), and Teacher Education for school education extending from the pre-school stage to Class 12.
Since, it is the single largest scheme of Ministry of Education, accounting approximately one third of the Ministry’s budget (PRS Legislative Research, 2023)1, it is like the principal fiscal vehicle through which the Government of India operationalises the Right of Children to Free and Compulsory Education Act, 2009 and the goals of the National Education Policy (NEP), 2020.
Between 2018-19 and 2021-22, states cumulatively spent less than two-thirds of the scheme’s approved budget in every year: 64%, 62%, 64%, and 64% respectively. By October 2022, only 22% of the 2022-23 budget had been spent. On the allocation side, the Centre itself fell short: between 2018-19 and 2021-22, GoI released only 91% cent of what it was supposed to release (Bordoloi, Kapur, and Santhosh, 2023) 2. For context, across all central school education schemes over six years from 2018-19 to 2023-24, roughly 38,589 crore went unspent out of a total allocation of 4,98,594 crore, money meant to build classrooms, train teachers, and deliver on the constitutional promise of free and quality education.
The utilisation rate across all central school education schemes of 92.3 per cent sounds acceptable, but it hides a far more troubling story specific to Samagra Shiksha. The scheme’s own approved budget utilisation has never crossed two-thirds in any full year for available data. Additionally, the data shows state-level variation e.g. Tamil Nadu spent 91% of its approved Samagra Shiksha budget in 2020-21 and 95% in 2021-22, while Maharashtra spent only 56% and then collapsed to 37% in the same two years. Uttar Pradesh fell from 69% to 50% (Bordoloi, Kapur, & Santhosh, 2023)2. Under the same scheme, the same PAB-approved rules, and the same 60:40 Centre-State cost-sharing arrangement, some states absorb funds well and others accumulate large unspent balances year after year.
This paper trying to answer the question that why there is persistent fund utilisation gap exist in Samagra Shiksha Abhiyan across states and three NEP phases (2018-2024) despite continuing allocating budget, and at which stage of the policy cycle the gap exist (2018-2024) using Lasswell policy framework (Lasswell, 1956)17? The study also assesses whether the introduction of NEP 2020 has deepened or resolved the gap. Finally, this paper recommend targeted policy reforms.
Literature Review
Three bodies of literature are directly relevant: public expenditure management theory, fiscal federalism and Centre-State dynamics in India, and scheme-specific research on Samagra Shiksha and NEP 2020. Together, they establish the theoretical foundation and the precise knowledge gap this paper fills.
Historical Context
The finance of India’s school education has never quite lived up to its policy promises. Back in 1966, the Kothari Commission called for public education spending to reach 6 per cent of GDP, a benchmark we still haven’t hit, six decades on.3 Motkuri and Revathi (2020) traced seven decades of data and found that actual public spending has hovered stubbornly around 4 per cent of GDP, even as private expenditure has outpaced it, especially from the 1990s onward.4 What’s striking is the contradiction they point to in NEP 2020, by giving private institutions the freedom to set their own fees, the policy may end up fueling the very privatisation it claims to want to rein in. That said, their work draws on national-level figures, which means it can’t really capture the state-level gaps in fund absorption, and that’s precisely where this paper tries to pick up the thread.
Rangarajan, Sharma, and Grove (2025) take a different angle. As India’s school system has ballooned to over 15 lakh schools serving nearly 600 lakh students, they argue the machinery meant to implement policy simply hasn’t kept pace.5 Surely, money gets allocated on paper, but getting it to actually move through state systems, and get used well, is another matter entirely. It’s this gap between how fast the system has grown and how slowly its capacity to absorb funds has followed that forms the structural bottleneck this paper examines, using the Policy Cycle Framework as a lens.
Public Expenditure Management Theory
Schick (1998) identifies three conditions for efficient public expenditure: aggregate fiscal discipline, allocative efficiency, and operational efficiency6. When operational efficiency fails, as the Samagra Shiksha data clearly shows, the result is systematic divergence between allocation and absorption. Allen and Tommasi (2001) show that in developing countries, budget execution is structurally undermined by rigid compliance requirements and capacity asymmetries between central and subnational governments.7
Devarajan, Swaroop, and Zou (1996) add the normative dimension: unspent social sector allocations represent foregone human capital investment with compounding intergenerational consequences.8 From a Principal-Agent Theory perspective, the Centre-State relationship in Samagra Shiksha involves classic information asymmetry: the Centre cannot perfectly monitor real-time state spending while states receive political credit for large allocations without bearing the full cost of under-utilisation.
Fiscal Federalism and the Centre-State Gap
Tripathi and Grigoriadis found out in 2023 that there is a difference between the money the central government collects and the money it spends.9 The central government gets to keep two-thirds of all the money that is collected. On the other hand, the states have to spend about two-thirds of the total public money. This is a problem for things, like Samagra Shiksha. The states have to wait for the central government to give them the money they need. The problem is that the states do not know when they will get this money. So, they have to do all their work in a short time. This is why we see a lot of spending at the end of the year. They also identify a soft budget constraint dynamic: when states rely heavily on central transfers, they lose motivation to build disciplined fund absorption systems.
Weingast (1995) theorises that in systems where subnational governments access central transfers without adequate accountability, a soft budget constraint reduces incentives for efficient absorption.10 Rao and Singh (2022) confirm that conditional, area-specific transfers like Samagra Shiksha are stimulative in theory, but that electoral cycles and political redistribution significantly mediate whether central releases translate into effective state-level spending.11
Prior Research on Samagra Shiksha
Khanna (2021) provides the most relevant prior study, analysing Samagra Shiksha financing across selected states in 2018-20.12 The study documents a persistent structural deficit between state-proposed budgets and PAB-approved outlays, no state receives 100 per cent of its proposed budget. Within approved budgets, teacher salaries consume 41.72 per cent of funds while scheme monitoring receives only 0.09 per cent and vocational education 1.30 per cent. Khanna identifies central release shortfalls as a proximate cause of underutilisation but attributes the gap to lack of coordination without empirical evidence, this paper provides the structural diagnosis Khanna could not.
Bordoloi, Kapur, and Santhosh (2023)2 provide the most comprehensive tracking of Samagra Shiksha finances, confirming that between 2018 and 2022 states spent less than two-thirds of approved budgets in every year, and that GoI releases cumulatively fell 9 per cent below Revised Estimates.2 They documented the budget well, but do not apply any analytical framework to explain it, our Policy Cycle analysis fills this gap. Malhotra, Kapur, and Pandey (2025) provide the most recent state-level data and confirm that increasing budget allocations alone has not solved utilisation problems13. However, they do not identify reason behind this, so this paper answers that question.
NEP 2020 as an Unfunded Mandate
The National Education Policy 2020 introduces the 5+3+3+4 curricular structure, NIPUN Bharat foundational literacy goals, ECCE integration, and vocational education from Class 6, without revising Samagra Shiksha’s financial norms or assessing states’ capacity to absorb these new costs (Ministry of Education, 2020)14. Sharma and Sharma (2025) identify this as the central NEP implementation risk: the policy sets massive targets, including 100 per cent enrolment from preschool to secondary by 2030, without clear financial timelines, a classic unfunded mandate.15 Ashokkumar et al. (2025) identify three barriers directly relevant to fund utilisation: outdated bureaucratic processes that delay implementation; an urban-rural resource trap where infrastructure demands cannot be met equitably; and resistance from teachers and administrators whose discretionary behaviour can nullify centrally mandated policy changes at the point of delivery16.
Research Gap
Three gaps remain in the existing literature. First, no study applies the Policy Cycle Framework to diagnose at which specific stage the Samagra Shiksha gap originates and compounds. Second, no study compares gap patterns across all three NEP phases using SSA-specific data. Third, the release-side gap i.e the Centre’s failure to release funds, and the utilisation-side gap i.e. states failure to spend released funds, have never been formally separated, a distinction essential for designing effective reform. This paper addresses all three gaps.
Methodology
Research Design
This paper used mixed-methods research design where we combine quantitative data with qualitative policy document analysis. Quantitative data shows the distribution of the budget-to-expenditure gap across states and phases, while policy document analysis identifies the institutional and procedural mechanisms that generate and sustain that gap. The analytical framework guides the Policy Cycle Framework, operationalised through it five core stages as applied to Samagra Shiksha Abhiyan: policy formulation, budgeting, implementation, monitoring, and evaluation (Lasswell, 1956)17. This framework is particularly well-suited because other framework like Rational-Comprehensive Model, Incrementalism Model, Multiple Streams Framework (Kingdon), and Advocacy Coalition Framework explain why policies change, who influences them, or how decisions are made, none of which is our focus. Our focus is to analyse the ‘how large is the gap’, but also, ‘at which stage of the policy process is the gap produced’. Therefore, Policy Cycle Framework is the most appropriate analytical tool for this study.
Data Sources
This study relies on both quantitative and qualitative data collected from a range of credible secondary sources. The main quantitative data includes Accountability Initiative and Centre for Policy Research budget briefs, which include Union Expenditure Budget documents, Demand for Grants of the Department of School Education and Literacy (2018-19 to 2023-24), Project Approval Board (PAB) minutes, state-wise fund release data, collected from RTI, etc. To complement these figures, qualitative evidence is drawn from CAG performance audits of earlier education schemes, Parliamentary Standing Committee reports, and the Ministry of Education’s Annual Work Plan and Budget guidelines (2018-2024). Together, these sources provide a comprehensive understanding of fund utilisation patterns, implementation challenges, and changes introduced under the National Education Policy (NEP), 2020.
Analytical Method
This paper analyse fund utilization at two junctures. First, the release gap which defined as the shortfall between GoI’s allocation (BE) and the amount actually released to states by a given reference date. Second, the expenditure gap, which is defined as the shortfall between funds released and funds actually spent by the state implementing societies, as reported through utilization certificate and PFMS On the similar line, the qualitative analysis applies the thematic document analysis to the policy documents against the five stages of the Policy Cycle Framework (Table.1). The findings from both analytical streams are triangulated at the synthesis stage, where quantitative patterns align with qualitative evidence of structural failure at a specific policy cycle stage, the paper treats this convergence as stronger evidence.
| Policy Cycle Stage | Applied to Samagra Shiksha |
Structural Failure Examined |
| Formulation | Scheme design such as AWP&B mechanism |
One-size-fits-all design ignoring state capacity |
| Budgeting | PAB approval Calendar, GoI release schedule, BE-AEactual gap |
Late approvals |
| Implementation | State expenditure as % of approved budget, compliance conditionality |
Compliance trap penalising low-capacity states |
| Monitoring | PAB meetings; CAG audits; Parliamentary Committee reviews |
Gaps documented annually |
| Evaluation | Phase-wise comparison across three NEP phases |
– |
Source: Authors’ framework adapted from Lasswell (1956)
Table1: Policy Cycle Framework applied to Samagra Shiksha Abhiyan
Limitations
This paper has a few limitations. First, SSA-specific state-level expenditure data is available only to 2021-22 for state breakdowns and to October 2022 for national figures, while the broader education dataset extends to 2023-24. Second, Samagra Shiksha utilisation is measured against total approved budgets including spillover from prior years, which is the standard approach given limited data on actual fund availability at state level. Third, there is no field research done; all data is taken from secondary sources. These limitations are treated as boundary conditions and are explicitly flagged in the relevant sections of the analysis.
Findings and Analysis
This section presents findings organised around the five sub-research questions and three NEP phases. All Samagra Shiksha-specific figures are from Bordoloi, Kapur, and Santhosh (2023)2.
The National Trend: Allocation, Release, and the Persistence of the Gap.
The Samagra Shiksha Utilisation Picture:
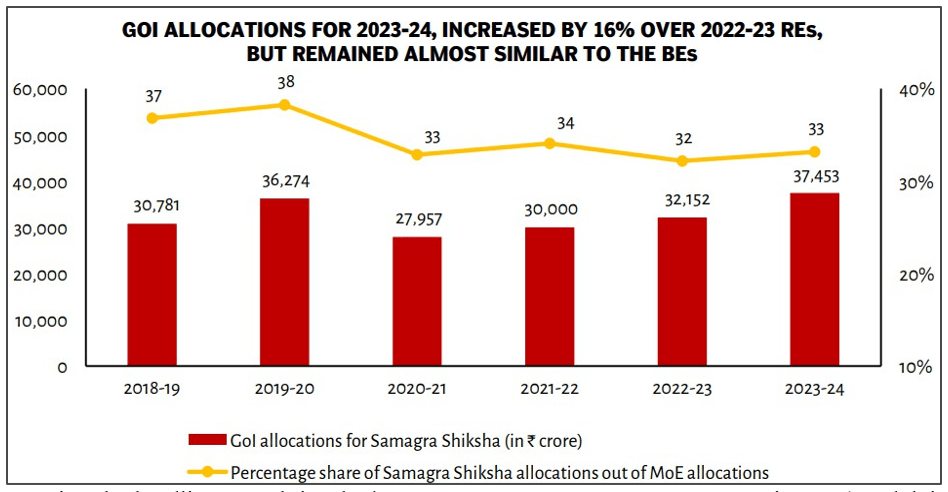
The Samagra Shiksha-specific data tells a far harder story than the overall school education headline. The scheme’s utilisation against its PAB-approved budgets has been remarkably consistent and consistently low. Figure 1 shows that GoI allocations to Samagra Shiksha grew from 30,781 crore in 2018-19 to 37,453 crore in 2023-24, a 22 per cent increase. However, the scheme’s share of total MoE allocations remained broadly stable at 32-38 per cent, dipping to 32- 33 per cent in Phase 3. Crucially, the upward trend in nominal allocations masks the fact that Revised Estimates for 2022-23 were 14 per cent lower than Budget Estimates for the same year, meaning the headline growth is a budget announcement, not a resource commitment (Bordoloi, Kapur, & Santhosh, 2023)2.
Source: (1) GoI allocations: Union Expenditure Budget, MoE, Department of School Education and Literacy, Department of Higher Education, FY 2017-18 to FY 2022-23. Available online at: www.indiabudget.gov.in. Last accessed on 10 January 2023. (2) Projections for FY 2018-19 and FY 2019-20: Rajya Sabha Standing Committee Report No. 309, February, 2019. Available online at: https://rajyasabha.nic.in/rsnew/Committee_ site/Committee_File/ReportFile/16/123/309_2019_9_15.pdf. (3) Projection for FY 2020-21: Rajya Sabha Standing Committee Report No. 312, March 2020. Available online at: https://rajyasabha.nic.in/rsnew/Committee_site/Committee_File/ReportFile/16/123/312_2020_3_12.pdf. (4) Projection for FY 2021-22: Rajya Sabha Standing Committee Report No. 323, March 2021. Available online at: https://rajyasabha.nic.in/rsnew/Committee_site/Committee_File/ReportFile/16/144/323_2021_7_15.pdf. (5) Projection for FY 2022-23: Rajya Sabha Standing Committee Report No. 336, March 2022. Available online at: https://rajyasabha.nic.in/rsnew/Committee_site/Committee_File/ReportFile/16/144/323_2021_7_15.pdf. (6) Supplementary Demands for Grants, FY 2022-2023. Available online at: https://dea.gov.in/sites/default/files/%21st%20Supplementary%20Demand%202022-23.pdf.
Figure.1: GoI allocations for Samagra Shiksha (in crore) and percentage share of MoE allocations, 2018-19 to 2023-24.
Figure 2 shows that the Centre’s own release-side failure. GoI released 95 per cent of its allocation in 2018-19, 89 per cent in 2019-20, and a record 99 per cent in 2020-21, but then fell sharply to 83 per cent in 2021-22 and 60 per cent by November 2022. This declining trend in Phase 3, when NEP 2020 demands were increasing, makes it harder for states to plan and implement. Between 2018-19 and 2021-22, GoI released 1,25,013 crore, 9 per cent less than the cumulative Revised Estimates for those four years (Bordoloi, Kapur, & Santhosh, 2023)2.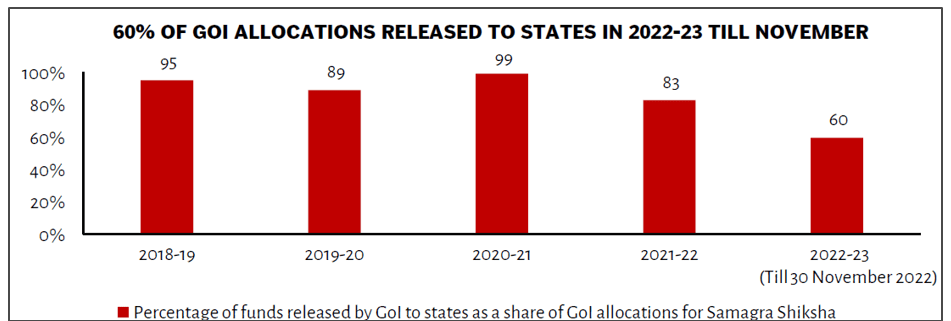
Source: (1) GoI allocations: Union Expenditure Budget, MoE, Department of School Education and Literacy, FY 2019-20 to FY 2022-23. Available online at: www.indiabudget.gov.in. Last accessed on 1 February 2022. (2) GoI release for FY 2018-19: RTI response by MoE dated 18 December 2019. (3) GoI release for FY 2019-20 and FY 2020-21: RTI response by MoE dated 23 November 2021. (4) GoI release for 2021-22 and FY 2022-23: RTI response by MoE dated 16 Dec, 2022.
Figure. 2: Percentage of GoI allocations released to states for Samagra Shiksha, 2018-19 to 2022-23.
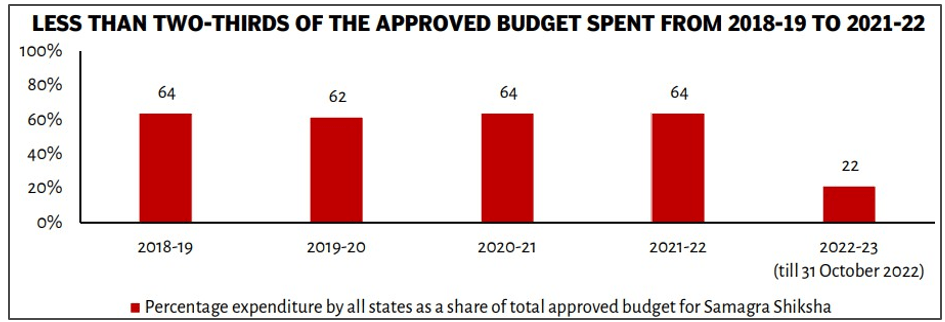
Figure.3 is the most striking chart in this paper. State expenditure as a share of the total approved budget was 64 per cent, 62 per cent, 64 per cent, and 64 per cent in the four years from 2018-19 to 2021-22, a flatline that survived both normal years and the COVID-19 disruption. By October 2022, only 22 per cent had been spent in 2022-23. This stable floor around 64 per cent is the central piece of evidence that the gap is structural rather than circumstantial.
Source: (1) Expenditures for FY 2018-19: RTI response by MHRD dated 18 December 2019. (2) Expenditures for FY 2019-20: RTI response by MoE dated 23 November 2021. (3) Expenditures from FY 2020-21 to FY 2022-23: RTI response by MoE dated 16 December 2022. (4) Approved budgets for FY 2018-19: RTI response by MHRD dated 27 December 2018. (5) Approved budgets for FY 2019-20 and FY 2022-23: Samagra Shiksha PAB minutes. Available online at: https://dsel.education.gov.in/pab-minutes. Last accessed on 10 January 2023. (6) Approved budgets from FY 202021 to FY 2021-22: RTI response by MoE dated 20 December 2021
Figure. 3: Percentage expenditure by all states as a share of total approved budget for Samagra Shiksha, 2018-19 to 2022-23
Phase-Wise Analysis
To better understand how the utilisation gap evolved, the analysis is divided into three phases (Table 2). Phase I (2018-2020) establishes the baseline, where fund utilisation remained low at 64% and 62%, suggesting that underutilisation existed from the very beginning rather than emerging gradually. Phase II (2020-2022) coincided with the COVID-19 pandemic, which disrupted school operations and infrastructure work. However, despite the Union Government releasing almost all approved funds in 2020-21, utilisation remained at 64%, indicating that the problem extended beyond temporary disruptions. Phase III (2022-2024) captures the implementation of NEP 2020. Although budget allocations increased and new initiatives such as NIPUN Bharat, ECCE, and PM SHRI were introduced, slow fund utilisation and weaker central releases suggest that existing institutional bottlenecks continue to limit effective implementation.
| Financial Year | SSA Expenditure as % of Approved Budget |
GoI Releases as % of Allocations | NEP Phase | Key Context |
| 2018-19 | 64% | 95% | Phase 1 | Scheme’s first year; structural gap established |
| 2019-20 | 62% | 89% | Phase 1 | Slight dip; release rate declined |
| 2020-21 | 64% | 99% | Phase 2 | COVID-19: GoI released 99% but states still spent only 64% |
| 2021-22 | 64% | 83% | Phase 2 | Post-COVID; GoI releases fell sharply to 83% |
|
2022-23 (till Oct 2022) |
22%* | 60% (till Nov 2022) | Phase 3 | Worst mid-year absorption on record |
| 2023-24 (GoI BEs) | 37,453 cr allocated | – | Phase 3 | 16% higher than 2022-23 REs; REs were 14% below BEs |
Source: Bordoloi, Kapur & Santhosh (2023). *Partial year figure only.
Table.2: Samagra Shiksha expenditure and GoI release rates by year and NEP phase (SSA-specific data).
State-Level Variation: The Same Scheme, Very Different Outcomes
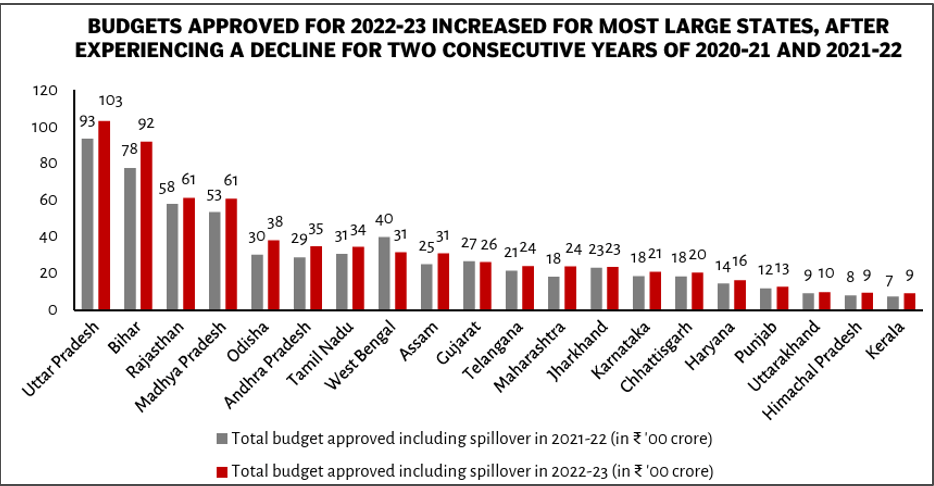
Figure 4 shows that Uttar Pradesh and Bihar receive by far the largest approved budgets, UP’s approved budget rose from 9,300 crore to 10,300 crore between 2021-22 and 2022-23. However, as the expenditure and release data shows, large approved budgets do not translate into proportionate absorption.
Source: (1) Approved budget for FY 2021-22: RTI response by MoE dated 20 December 2021. (2) Approved budgets for FY 2022-23: Samagra Shiksha PAB minutes. Available online at: https://dsel.education.gov.in/pab-minutes. Last accessed on 2 January 2023.
Figure.4: Total approved Samagra Shiksha budgets including spillover by state, 2021-22 vs 2022-23 (in Rs crore).
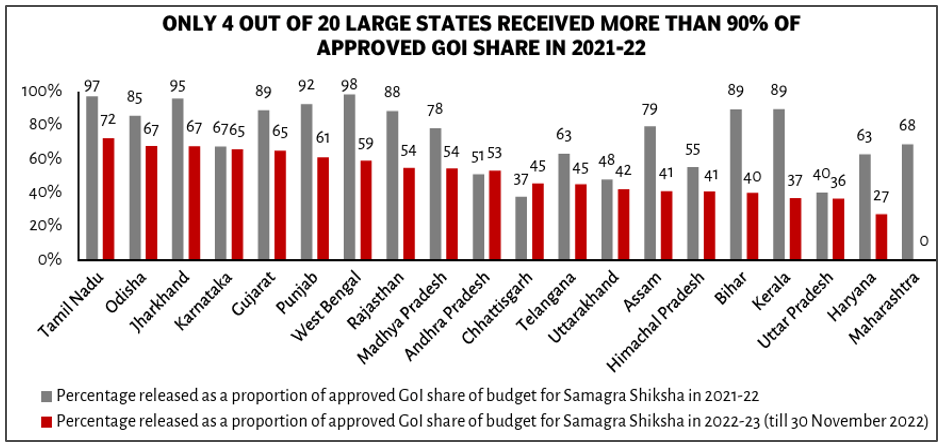
Figure 5 reveals a stark disparity in GoI release rates across states. In 2021-22, only four of the 20 large states received more than 90 per cent of their approved GoI share: West Bengal (98%), Tamil Nadu (97%), Jharkhand (95%), and Punjab (92). Uttar Pradesh received only 40 per cent and Chhattisgarh only 37 per cent. By November 2022, Maharashtra had received zero GoI funds for the year. This is a Centre-side release failure: states cannot spend money they have not received.
Source: (1) Approved GoI share of budget: Lok Sabha unstarred question 2335, answered on 1 August 2022. Available online at: http://164.100.24.220/loksabhaquestions/annex/179/AU2335.pdf. (2) GoI release for 2021-22 and FY 2022-23: Lok Sabha Starred Question 80, answered on 12 December 2022. Available online at: https://pqals.nic.in/annex/1710/AS80.pdf
Figure 5: Percentage of GoI-approved share released to large states under Samagra Shiksha, 2021-22 and 2022-23 (till November 2022).
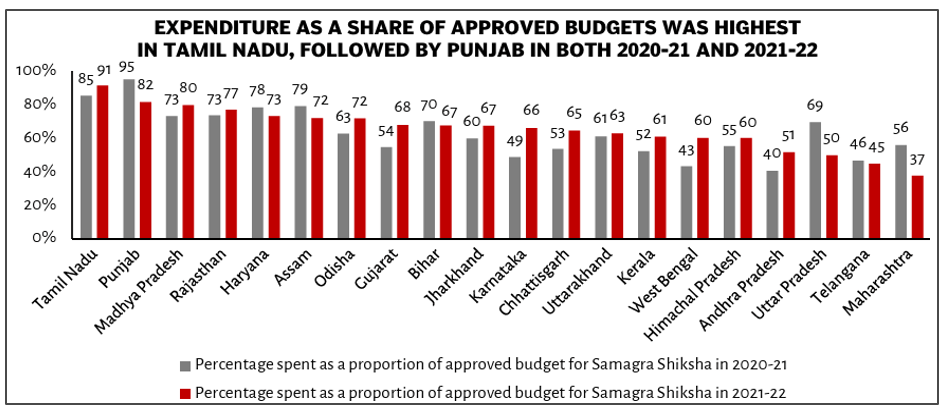
Figure 6 is the most analytically important state-level chart. Tamil Nadu achieved 85 per cent in 2020-21 and 91 per cent in 2021-22, the highest of any large state in both years. Maharashtra, by contrast, spent 56 per cent in 2020-21 and collapsed to 37 per cent in 2021-22, the lowest of any large state. Uttar Pradesh fell from 69 per cent to 50 per cent. This not random variation, Tamil Nadu has built compliance management system over the years and on the other hand, Maharashtra and UP have not, and the scheme provides no incentive or support to do so (Bordoloi, Kapur, & Santhosh, 2023)2.
Source: (1) Expenditures for FY 2020-21 and FY 2021-22: RTI response by MoE dated 16 December 2022. (2) Total approved budgets for FY 202021 to FY 2021-22: RTI response by MoE dated 20 December 2021.
Figure 6: Expenditure as a share of approved Samagra Shiksha budgets by state, 2020-21 and 2021-22.
Also, Tamil Nadu fully integrate ICT labs, teacher training and girl child education components into its Annual Work Plans (Education for All in India, 2026)18. On the other hand, UDISE+ 2023-24 data shows that one-out-of-three children in Uttar Pradesh are not enrolled at the primary level, with a Net Enrolment Ratio of only 67 per cent (Education for All in India, 2025)19. This is directly linked to the fund utilisation gap for children left out of the education system.
In low-performing states, the problem is rarely a shortage of approved money, approved ICT labs and smart classroom grants sit unused because of slow procurement processes, administrative backlogs, and weak reporting systems rather than lack of funding intent (iDream Education, 2025)20.
Further, an important development that enhances the paper’s argument. In 2024-25, the Central Government withheld all Samagra Shiksha funds from Tamil Nadu, Kerala, and West Bengal because these states refused to sign the MoU for the PM SHRI scheme (Shukla, 2025)21. Tamil Nadu alone allocated Rs. 2,151 crore for 2024-25 but received nothing. Tamil Nadu Chief Minister MK Stalin wrote to the Prime Minister stating that withholding funds would severely impact millions of children from disadvantaged backgrounds (Press Trust of India, 2024)22. This development is significant because it shows that even the best-performing states are now caught in the compliance conditionality trap, not because of their own administrative failures, but because of a new political conditionality attached to fund releases. This is the clearest evidence that the fund utilisation gap is produced by the system’s design rather than by individual state incompetence, directly confirming the Stage 3 implementation failure diagnosis.
Locating the Gap in the Policy Cycle
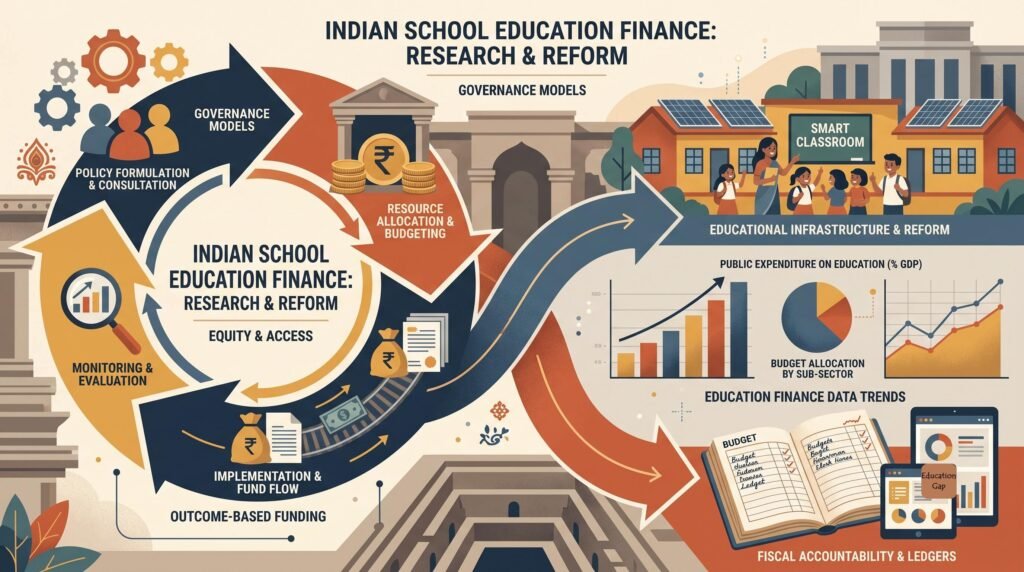
Figure 7 shows Samagra Shiksha’s fund-flow cycle across six stages i.e. Formulation, Budgeting, Fund Release, Implementation, Monitoring, and Feedback, identifying three structural gaps: PAB delays and BE-RE mismatch, late central releases, and weak utilisation certificate submission.
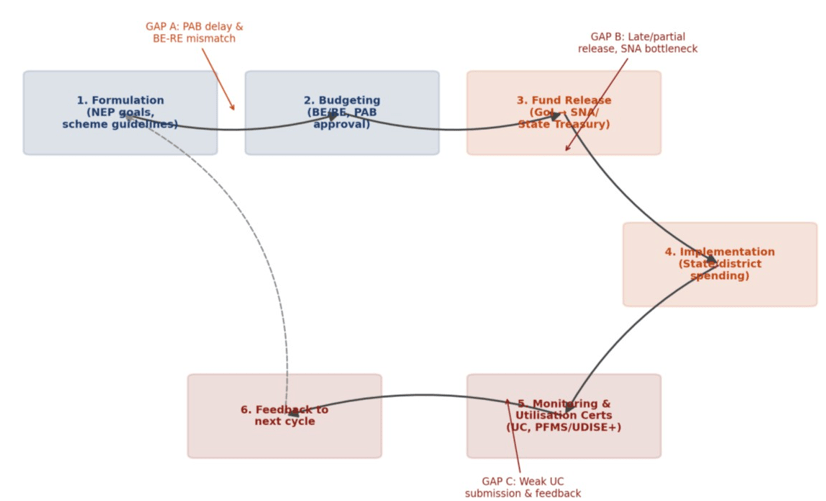
Figure 7. The Samagra Shiksha Policy Cycle and Points of Structural Fund-Utilisation Leakage.
Formulation Failure: One Design for an Unequal Federation
Samagra Shiksha’s AWP&B architecture requires every state to submit proposals through the same process, assessed by the same PAB criteria, regardless of whether that state has Tamil Nadu’s administrative capacity or a smaller North-Eastern state’s geographic challenges. Khanna (2021) documents that no state ever receives 100 per cent of its proposed budget from the PAB, creating a gap before implementation even begins.12
Source: Samagra Shiksha PAB minutes. Available online at https://dsel.education.gov.in/pab-minutes. Last accessed on 10 January 2023
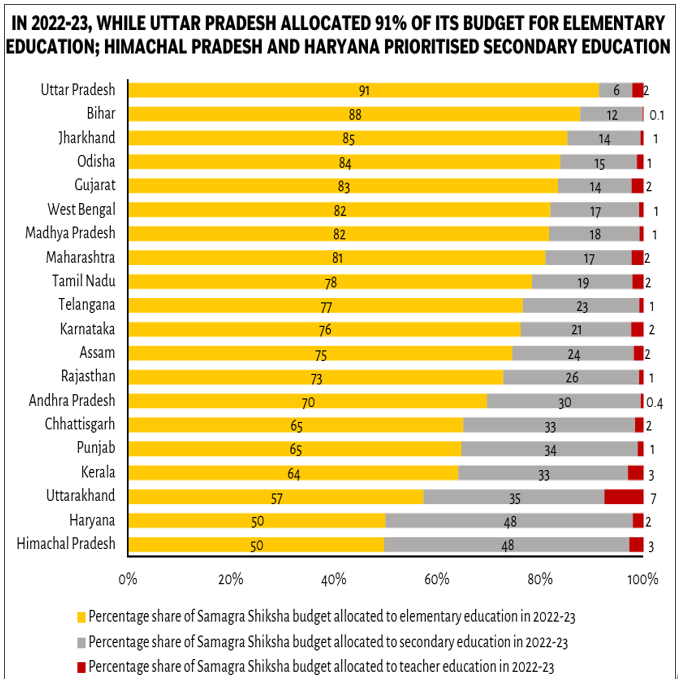
Figure 8: State-wise share of Samagra Shiksha budget allocated to elementary, secondary, and teacher education, 2022-23.
Figure 8 shows the structural concentration of resources: nationally, 78 per cent of the approved budget went to elementary education and only 1.6 per cent to teacher education in 2022-23. As Khanna (2021) notes, salary-related expenditure dominates at 41.72 per cent within approved budgets, meaning high utilisation rates often simply reflect payroll execution rather than programmatic investment in NEP-aligned quality improvements12. The scheme has no mechanism to distinguish productive absorption from salary-driven absorption, a formulation failure with direct consequences for whether spending produces outcomes.
Budgeting Failure: The PAB Calendar and the Release Gap
The PAB usually signs off on state AWP&Bs sometime in February or March, right at the tail end of the preceding year, or just as the implementation year is getting underway. This means states are left starting the year without approved ceilings at all. GoI releases then trickle in through phased tranches, each one conditional on compliance, which in practice squeezes real implementation down to maybe eight or nine months, if states are lucky.
The cumulative release data backs this up, and it’s not just a one-off glitch, it looks like a systemic pattern. Between 2018-19 and 2021-22, GoI released 9 per cent less than the cumulative Revised Estimates would suggest (Bordoloi, Kapur, & Santhosh, 2023)2. And the RE-versus-BE gap makes things worse still: in 2022-23 alone, Revised Estimates came in 14 per cent below Budget Estimates. That’s a fairly significant shortfall. States, in other words, can’t really plan implementation with any confidence when the actual money available only becomes clear at the Revised Estimate stage, which, by definition, arrives months after the year has already started.
Tripathi and Grigoriadis (2023) offer a useful explanation for why this keeps happening. Because the Centre controls roughly two-thirds of revenue collection, states are essentially waiting on transfers they have little ability to predict in advance9. The result is a familiar scramble toward year-end, when states try to spend down whatever funds have finally come through before the window closes.
Implementation Failure: The Compliance Conditionality Trap
Every tranche the Government of India releases comes with a catch: states have to submit utilisation certificates showing they’ve actually spent the previous round of funds before they see the next one. In practice, this tends to set up a kind of vicious cycle. States with fewer administrative staff take longer to file the paperwork; that delay pushes back the next disbursement; and with less time left in the fiscal year, there’s less room to spend what does arrive. Lower utilisation follows, and the whole cycle just repeats itself, seemingly by design.
Maharashtra is a good illustration of this. By November 2022, the state hadn’t received a single rupee of Samagra Shiksha funding from the Centre, yet the year before, it had posted the lowest utilisation rate among large states, at just 37 per cent (Bordoloi, Kapur, & Santhosh, 2023)2. There’s something almost perverse about that: the compliance mechanism appears to punish the very states that struggled most to absorb funding in the first place, withholding money from exactly the places that needed more runway, not less. Rather than closing the gap, it seems to widen it.
Monitoring Failure: Documentation Without Correction
The monitoring architecture around Samagra Shiksha looks comprehensive on paper, annual PAB reviews, periodic CAG audits, Parliamentary Standing Committee scrutiny. And yet the same utilisation shortfall, hovering around 64 per cent of approved budgets, shows up year after year without any real structural fix following it. CAG’s performance audits of SSA back in 2014, and of RMSA in 2017, flagged more or less the same issues: unspent balances, delayed releases, AWP&Bs approved too late in the cycle to matter. Samagra Shiksha was supposed to address exactly this. Seven years on, the pattern hasn’t really moved.
If anything, that’s the clearest sign the problem isn’t incidental, it’s structural. It survived a complete scheme redesign in 2018 more or less untouched. Malhotra, Kapur, and Pandey (2025) make a similar point: throwing more money at the allocation side doesn’t appear to fix utilisation on its own13. Monitoring that generates reports but doesn’t trigger any corrective mechanism isn’t really accountability, it’s just documentation, filed and forgotten. Take the 2021-22 PAB data: only four large states got more than 90 per cent of their approved GoI shares, a fact that was dutifully recorded but never translated into anything like a differentiated release policy (Bordoloi, Kapur, & Santhosh, 2023)2.
Has NEP 2020 Deepened or Reduced the Gap?
The evidence here points in one direction, and it’s not a flattering one for NEP 2020: the policy appears to have deepened, rather than closed, the structural gap in fund utilisation. Three findings, taken together, support this reading.
First, the money kept increasing while the spending didn’t keep pace. GoI allocations rose from Rs. 30,781 crore in 2018-19 to Rs. 37,453 crore in the 2023-24 budget estimates, yet utilisation stayed stuck around 64 per cent through Phase 2 and then fell further in Phase 3, by October 2022, only 22 per cent had been spent. More money, in other words, did not translate into more absorption. Sharma and Sharma (2025) offer a plausible explanation: NEP sets ambitious targets but doesn’t attach financial timelines or state-specific transition support, leaving states to figure out the how largely on their own.
Second, NEP’s new spending demands were layered onto a budget architecture that was already struggling. Consider the Quality Interventions component, ICT, pre-primary education, learning assessments, the things NEP explicitly prioritises. Its share of the approved budget grew from 20 per cent in 2020-21 to 27 per cent by 2022-23 (Bordoloi, Kapur, & Santhosh, 2023). That sounds like progress until you notice what actually happened: this was a reallocation within a fixed pie, not new absorption. Unspent balances essentially moved from one line item to another, which is a bit like rearranging deck chairs and calling it a renovation.
Third, and this is where the gap becomes hardest to ignore, the digital infrastructure numbers lay the implementation problem bare. NEP calls for expanded ICT use, and Samagra Shiksha is meant to fund this through the same Quality Interventions component.
Discussion
The evidence keeps pointing the same direction: the fund utilisation gap in Samagra Shiksha Abhiyan isn’t some one-off glitch, it’s baked into how the scheme actually functions. It doesn’t look like a COVID effect, the 64 per cent utilisation rate stayed put through the pandemic year and the two years before it. It doesn’t look like a budget-size problem either, since GoI allocations kept climbing while states still couldn’t absorb more than 64 per cent of what was on the table. And it’s not just one underperforming state skewing the average; underutilisation shows up across all 20 large states. What we’re likely looking at is a structural issue that compounds across four stages of the policy cycle.
Start with formulation. The one-size-fits-all AWP&B design doesn’t really account for how capacity differs from state to state, and its salary-heavy structure tends to blur the line between running payroll and actually absorbing programme funds, two fairly different things that end up looking identical on paper. Budgeting is its own headache: a 14 per cent downward revision at the RE stage, combined with PAB approvals that arrive late, squeezes the implementation window and sends states a pretty clear signal that funding isn’t something they can plan around. At implementation, the compliance conditionality setup appears to punish the states that need help most, Maharashtra hadn’t received a single rupee of GoI funds by November 2022, and, perhaps unsurprisingly, posted the lowest utilisation of any large state that year. At monitoring, the same gaps resurface year after year, and nothing structural ever seems to follow.
NEP 2020, if anything, made things worse without addressing any of the underlying issues. Folding NIPUN Bharat, ECCE, and PM SHRI into the Samagra Shiksha framework, without touching financial norms or release mechanisms, created something like an unfunded mandate sitting on top of a pipeline that was already struggling. The 2022-23 numbers tell that story well enough only 22 per cent utilisation by mid-year, and just 60 per cent of funds released by November. More ambition layered onto an unreformed structure just produces bigger piles of unspent money, not better outcomes
Tamil Nadu is probably the strongest counter-example. Its SSA expenditure rates ran to 85 and 91 per cent across the two years with available state-level data, alongside a 97 per cent release rate from the Centre. That combination suggests both sides of this problem, release and utilization, can be managed, given administrative capacity and a state government that stays ahead of compliance instead of scrambling after it. The scheme’s design, though, does little to help weaker states build that same capacity. That gap is arguably the real design failure any serious reform needs to fix.
Policy Recommendation
The analysis suggests the persistent fund utilisation gap in Samagra Shiksha builds up across different stages of the policy cycle, starting with planning and budgeting, carrying through fund release and implementation, and then getting worse because monitoring and accountability are weak. So just throwing more money at the budget probably won’t fix things. Unless the underlying administrative and institutional problems get addressed, higher allocations could just as easily turn into larger piles of unspent money. With that in mind, this paper lays out five recommendations, each mapped to the stage of the policy cycle where the gap seems to originate.
Start with planning and budgeting. Annual budgets right now tend to be built on standard estimates rather than what states can actually spend, a one-size-fits-all approach that doesn’t hold up well once you look at the numbers. Budget proposals should instead be grounded in state-level implementation capacity, past spending patterns, and how ready a given project really is. A more evidence-based approach here could narrow the gap between what’s sanctioned and what’s actually spent.
Next, fund release needs strengthening. Delays in the Centre releasing money to states tend to stall implementation on the ground, sometimes for months. Predictable release schedules, fewer administrative bottlenecks, and real-time digital tracking of transfers would likely smooth this out considerably. States would also be able to plan with more confidence if they had a clearer sense of when the money was actually coming.
Third, implementation capacity within states needs attention. The wide variation in utilisation across states suggests some governments simply have stronger administrative systems in place than others. States lagging behind may need targeted technical support, better financial management tools, regular training for officials, and closer coordination between education and finance departments. Tamil Nadu, for instance, comes up often as a state that manages this reasonably well, and its approach might offer lessons other states could adapt.
Fourth, monitoring and accountability need a shift in focus. The current emphasis is mostly on whether funds were released at all, not on how they’re being used once they arrive. Monitoring should instead track fund use in real time and flag delays early, before they snowball into bigger problems. Public dashboards, independent reviews, and stronger legislative oversight would probably help, both for transparency and for prompting faster course corrections.
Finally, policy evaluation shouldn’t be an occasional exercise; it needs to become routine. Regular assessments can surface recurring problems, show whether reforms are working, and build an evidence base for future decisions. This evaluation should also draw on feedback from states, district officials, and schools themselves, so that policy changes reflect what’s actually happening on the ground rather than what looks good on paper.
Taken together, these five recommendations follow one underlying logic: each targets a different point in the cycle where the utilisation gap tends to form. What this ultimately suggests is that fixing fund utilisation isn’t just about writing a bigger check. Without real structural changes to planning, fund flow, implementation, monitoring, and evaluation, extra money is likely to just pile up unused again.
Conclusion
Pulling the findings together, one thing becomes pretty hard to avoid: the fund utilisation gap in Samagra Shiksha Abhiyan doesn’t look like a random administrative hiccup. It looks structural, the product of four compounding failures across the policy cycle, and each of our five recommendations traces back to specific evidence laid out in Sections 4 and 5.
Take the AWP&B calendar fix. PAB approvals routinely land in February or March, which squeezes implementation into a few frantic months, and Revised Estimates for 2022-23 came in 14% below the original Budget Estimates, the kind of fiscal whiplash that makes state-level planning nearly impossible. Or consider Maharashtra: it received zero GoI funds by November 2022, yet posted the lowest utilisation rate in the sample at 37%. That pairing suggests withholding funds from low-capacity states doesn’t fix the gap so much as widen it. The case for a NEP Fiscal Transition Fund follows a similar logic, only 54% of the approved GoI share was disbursed in the scheme’s first three years, which raises a fair question about whether NEP 2020 is asking a chronically underfunded system to take on new mandates it can’t yet support. The dashboard recommendation, meanwhile, responds to something almost absurd: utilisation data mostly surfaces through RTI requests, six to twelve months after the fact, well past the point where anyone could act on it. And Tamil Nadu’s 91-95% absorption rate, achieved under identical scheme rules, seems to confirm this is a capacity and design problem rather than something inevitable.
A few limitations are worth flagging. State-level SSA expenditure data only goes up to 2021-22 (October 2022 at the national level), so some of the Phase 3 findings are inferred rather than directly observed. Utilisation is also measured against approved budgets that include spillover from prior years, which may understate how much money states actually had on hand. And the qualitative side leans entirely on public documents, internal Ministry correspondence, which might allow for real process tracing, wasn’t accessible. These gaps point toward an obvious next step: longitudinal, district-level work on how compliance conditionality plays out differently across states with varying administrative capacity.
References
- Asthana, R. (2022, February 16). Demand for grants 2022-23 analysis: Education. PRS Legislative Research.
- Bordoloi, M., Kapur, A., & Santhosh, S. (2023). Samagra Shiksha GoI, 2023-24. Budget Briefs, 15(5). Accountability Initiative, Centre for Policy Research.
- Kothari Commission. (1966). Education and national development: Report of the Education Commission 1964-66. Government of India, Ministry of Education
- Motkuri, V., & Revathi, E. (2020). Private and public expenditure on education in India: Trend over last seven decades (CESS-RSEPPG Research Brief 2). Research Cell on Education (RSEPPG), Centre for Economic and Social Studies
- Rangarajan, R., Sharma, U., & Grové, C. (2025). Inclusion and equity in India’s new National Education Policy (NEP): An analysis using the Context Led Model of Education Quality. International Journal of Inclusive Education, 29(6), 975–995. https://doi.org/10.1080/13603116.2023.2295907
- Schick, A. (1998). A contemporary approach to public expenditure management. World Bank Institute.
- Allen, R., & Tommasi, D. (Eds.). (2001). Managing public expenditure: A reference book for transition countries. OECD Publishing
- Devarajan, , Swaroop, V., & Zou, H. (1996). The composition of public expenditure and economic growth. Journal of Monetary Economics, 37(2), 313-344. https://doi.org/10.1016/S0304-3932(96)90039-2
- Tripathi, P. K., & Grigoriadis, T. N. (2023). State capacity & the soft budget constraint: Fiscal federalism, Indian style. Asia and the Global Economy, 3, Article 100058. https://doi.org/10.1016/j.aglobe.2023.100058
- Weingast, R. (1995). The economic role of political institutions: Market-preserving federalism and economic development. The Journal of Law, Economics, and Organization, 11(1), 1–31. https://doi.org/10.1093/oxfordjournals.jleo.a036861
- Rao, M. G., & Singh, N. (2022). Federal transfers and states’ own spending on development activities in fiscal federalism in India. Economic & Political Weekly, 57(36), 36-44
- Khanna, P. (2021). Financing education under Samagra Shiksha Abhiyan: An initial analysis in selected states of India. Journal of Business Thought, 12, 63-73. https://doi.org/10.18311/jbt/2021/28884
- Malhotra, , Kapur, A., & Pandey, S. (2025). Trends in finances for Samagra Shiksha. Budget Insights, 2(10). Foundation for Responsive Governance (ResGov)
- Ministry of Education, Government of (2020). National Education Policy 2020. Department of School Education and Literacy
- Sharma, , & Sharma, B. (2025). NEP 2020 to NEP 2025: A review of policy shifts and structural reforms. International Journal of Innovations in Science Engineering and Management, 4(2), 196-201. https://doi.org/10.69968/ijisem.2025v4i2196-201
- Ashokkumar, T., Raj, T. R., Rajadurai, , Abishini, A. H., & Anchani, A. H. (2025). Analyzing the impact of the new educational policy 2020: A comprehensive review of India’s educational reforms. Evaluation and Program Planning, 108, Article 102515. https://doi.org/10.1016/j.evalprogplan.2024.102515
- Banha, , Flores, A., & Coelho, L. S. (2022). A new conceptual framework and approach to decision making in public policy. Knowledge, 2(4), 539–556. https://doi.org/10.3390/knowledge2040032
- Education for All in India. (2026). School education in Tamil Nadu: Where do we stand? https://educationforallinindia.com/school-education-in-tamil-nadu-where-do-we-stand-a-comprehensive-analysis-based-on-udise-data-2021-22-to-2024-25/
- Education for All in India. (2025). Understanding UDISE+ 2023-24 enrolment ratios under Samagra Shiksha. https://educationforallinindia.com/understanding-udise-2023-24-enrolment-ratios-under-samagra-shiksha/
- iDream Education. (2026, July 9). Samagra Shiksha 2.0: What it funds and where the utilisation gap shows up. iDream Education. https://www.idreameducation.org/blog/samagra-shiksha-abhiyan-2-0-utilisation-gap/
- Sachdeva, S. (2025, February 10). Zero Samagra Shiksha funds to Kerala, West Bengal, Tamil Nadu: Government. Careers360. https://news.careers360.com/zero-samagra-shiksha-abhiyan-ssa-funds-kerala-tamil-nadu-west-bengal-pm-shri-schools-education-ministry
- Press Trust of India. (2024, August 27). Tamil Nadu CM urges PM Modi to expedite release of pending grants under Samagra Shiksha scheme. Careers360. https://news.careers360.com/tamil-nadu-cm-urges-pm-modi-expedite-release-of-pending-grants-under-samagra-shiksha-scheme