AUTHORS:
ADITI SURHA, ISHITA VIJAY, CHHAVI SAINI, AREESHA SULHA, ARSHA KAUSHIK, JAPLEEN KAUR BHINDER, KHIZAR ALI KHAN, KHUSHI MINZ, RIMI MAJHI, TANVI AGRAWAL, RACHIT SRIVASTAVA, ANNIKA GUPTA
1. ABSTRACT
Trade agreements are widely credited with boosting trade volumes, but it’s less clear whether that extra trade actually shows up as economic growth. This study looks at how trade agreement participation, trade intensity, and openness relate to GDP growth across major regional and bilateral frameworks (WTO, ASEAN, EU, NAFTA/USMCA, SAARC), drawing on secondary data from the World Bank, UNCTAD, WTO, and IMF for 2000–2019, with selected post-2020 tracking for Malaysia and Singapore. Particular attention is paid to India’s bilateral agreements (AIFTA, CEPA, CECA) and how effects vary across agriculture, industry, and services. Trade agreements do reliably raise trade volume, but they don’t consistently narrow deficits or guarantee faster growth: India’s agreements widened its trade deficits even as bilateral trade multiplied several times over, and openness itself showed no stable link to GDP growth across the sample. Germany combined high openness with the lowest growth in the group, while India, despite comparatively low openness, matched Vietnam’s high growth. Sectoral composition and tariff policy help explain some of this variation, since manufacturing- and services-led economies appear to convert openness into growth through different channels. Overall, trade liberalization looks like an enabling condition for growth rather than a guarantee of it, one that depends heavily on sector composition, productivity, and domestic policy.
2. INTRODUCTION
Trade agreements have become one of the main tools countries use to pursue growth, and they now cover a large share of world commerce. What started as a small set of multilateral commitments under the General Agreement on Tariffs and Trade, later reorganised into the World Trade Organization, has expanded into a crowded field of regional and bilateral deals, including the European Union’s single market, ASEAN, NAFTA and its successor USMCA, and SAARC, among hundreds of smaller arrangements. By the early 2000s, almost no economy sat outside this network, and openness to trade had stopped being optional and became closer to a default. The logic is simple: agreements that cut tariffs and non-tariff barriers should raise trade, and more trade should feed growth. The first half of that claim is well established; the second half is not. This study starts from the trade effect, since growth is hard to interpret without first knowing what an agreement does to trade flows.
The stakes here extend well beyond trade ministries and policy circles. Tariff schedules condition relative prices for firms and households, reshape the composition of exportable output, and redirect foreign investment, with downstream consequences for employment and its geographic distribution. For developing economies, such agreements typically secure market access for agricultural and light-manufacturing exports; for industrialised economies, they calibrate the competitive pressure borne by domestic producers. These effects are unevenly distributed: agriculture remains exposed through tariff-rate quotas, industrial outcomes track participation in global value chains, and services account for a rising share of growth as structural change proceeds. Because gains concentrate in particular sectors and countries while others register little, aggregate claims about ‘trade agreements and growth’ obscure more than they reveal. The analysis that follows therefore, disaggregates the evidence by sector, income level, and agreement type.
On whether agreements raise trade, the evidence is fairly one-sided. Cipollina and Salvatici (2010) pooled 1,827 estimates across 85 gravity-model studies and found the no-effect hypothesis rejected almost everywhere, though the size of the effect varies with data and method. Subramanian and Wei (2007) estimated the WTO lifted world trade by around 120 percent, close to US$8 trillion in 2000 alone, but found the gain concentrated among industrial countries that negotiated actively, with developing members who joined before the Uruguay Round seeing much less. Yao, Zhang, Yasmeen, Cai, and Reinsberg (2021) built a product-level index of preferential agreement coverage for 189 countries between 1990 and 2015 and found the trade-boosting effect strongest for low- and middle-income members.
Whether that extra trade turns into growth is messier. Frankel and Romer (1999) found a positive but only moderately significant link between trade and income using an instrumental-variable approach. Baier and Bergstrand (2007) showed free trade agreements do raise bilateral trade once the non-random reasons countries sign them are accounted for, though the size of the effect depends heavily on the estimation method. Other findings cut the other way: Vamvakidis (1999) found countries in regional trade agreements often grew more slowly than those pursuing broader, non-discriminatory liberalisation, and Rodríguez and Rodrik (2001) argued much of the cross-country evidence linking trade policy to growth rests on weak measures of openness and insufficient controls. So the real question here is not whether trade agreements raise trade, since that much is established, but whether, and under what conditions, that trade shows up as growth, given a country’s income level, sector mix, and how deep the agreement goes.
That kind of variation is hard to find in one study. Gravity-model research captures trade creation well but rarely follows through to growth, while growth-regression studies usually reduce agreements to a single dummy variable and say little about which sectors or income groups drive the result. Most work focuses on one agreement or region at a time, or relies on aggregate growth figures that hide how differently agriculture, industry, and services respond. Studies comparing several agreement types together, WTO membership, ASEAN, the EU, NAFTA/USMCA, and SAARC, within one framework are rare, as are studies with a long enough horizon to include both the 2008 crisis and the disruptions of the 2020s. Few account for trade openness, volume, agreement type, and tariffs alongside controls like exchange rates, FDI, and institutional quality together, which makes it hard to isolate what agreements are actually contributing.
This study tries to fill that gap. Using secondary data from the World Bank, UNCTAD, the WTO, and the IMF for 2000 to 2025, it examines how trade agreement participation and trade intensity relate to economic growth across major regional and bilateral frameworks, with attention to how this plays out differently across agriculture, industry, and services. The aim is to check whether the trade-creating effects established in the gravity literature actually show up as growth, and to work out under what conditions, income level, sector composition, agreement depth, that link is strongest. The goal is not to settle whether trade agreements work in general, but to see where they work, for whom, and how.
3. LITERATURE REVIEW
3.1 Theoretical Foundations
The Heckscher-Ohlin model and Stolper-Samuelson theorem (Stolper & Samuelson, 1941) predict that trade helps a country’s abundant factor of production and hurts its scarce factor, favouring capital and skilled labour in richer countries and land or low-skill labour in poorer ones. Heckscher’s (1919) idea, later built on by Ohlin, was that countries specialise based on their abundant resources, a thread running through much of the developing versus developed literature discussed later. A separate strand explains not who wins or loses but how much trade happens: the gravity model, proposed by Tinbergen (1962) as a comparison to Newton’s law of gravity, holds that trade depends on economic size and shrinks with distance. Anderson and van Wincoop (2003) gave this a firmer theoretical basis with multilateral resistance terms, explaining why distance and GDP alone don’t fully predict trade volumes when trade costs are high; several empirical papers here draw on this model. A third strand connects trade to long-term growth rather than one-time gains: Grossman and Helpman (1991) argued trade speeds growth by giving countries access to new knowledge through imported goods, so open economies grow faster partly by innovating faster, not merely by using resources more efficiently. Together, these ideas explain who gains and losses from trade within a country, how much two countries are likely to trade, and why openness can raise growth over time.
3.2 Trade Agreement Typology and India’s Case Studies
Not every trade agreement affects growth the same way; much of the literature treats agreement type, multilateral, regional, or deep bilateral, as mattering on its own, and India’s agreements show this clearly. Blyde and Hoekman (2016) used synthetic control methods to show trade agreements produce real export gains after signing, bigger when the partner is more developed. Singh (2021), along with Arote et al. (2026), found uneven effects across ASEAN partners but an overall positive impact from AIFTA: India’s exports to ASEAN rose from about US$871.5 million in 1990 to US$44 billion in 2022. Still, Bhattacharyya and Mandal (2016) noted these gains weren’t spread evenly across sectors, and India’s ASEAN trade deficit grew. Deeper agreements in the works promise more: Navarra et al. (2020) estimated an EU-India FTA could be worth 8 to 8.5 billion euros, and Kumar et al. (2024) projected India-EU agricultural trade could rise 238.53 percent under a future FTA. Among completed deals, Gaurav and Bharti (2018) found the India-Japan CEPA improved services market access, though businesses underused the preferences, while Ismail and Ahmed (2024) expected the India-UAE CEPA to boost exports in manufacturing, pharmaceuticals, textiles, and gems and jewellery. Ekanayake, Mukherjee, and Veeramacheneni (2010) used a gravity model across 19 Asian developing countries and found ASEAN, the Bangkok Agreement, and SAARC significantly raised trade between members, though still lower than within the EU or NAFTA. Together, these studies suggest WTO rules act as a baseline while regional and bilateral agreements produce bigger, more measurable gains, depending on agreement depth, domestic reforms, and exporter readiness, as shown by India’s underused preferences and widening deficit.
3.3 Trade Openness, Growth and Sectoral Effects
A related question is whether openness itself, separate from any single agreement, reliably drives growth; the research here is more divided. Jalil and Rauf (2021) studied 82 countries from 1960-2019 and found a solid positive relationship across methods, while Tahir and Norulazidah’s (2014) review traced how the idea has been challenged and reconfirmed repeatedly. Ederington and Ruta (2016) complicated this by showing non-tariff measures have become at least as restrictive as tariffs, sometimes nearly doubling overall trade restrictiveness once counted. India’s own numbers show how unstable this relationship can look: an ARDL model links openness to a 0.301 percent drop in GDP long run per 1 percent rise in openness, though short-run the relationship is positive and flips sign by period, negative from 1985-1991, positive post-1991, negative again from 2004-2009. A separate panel study of 13 European transition economies instead found a steadily positive relationship. Zahonogo (2016) offered a possible explanation: data from 42 sub-Saharan African countries shows an inverted-U, or Laffer curve of trade, where openness helps growth only up to a point before declining, suggesting India’s shifting results reflect its position relative to that threshold over time rather than genuine instability.
Sector level evidence adds another layer. Tahir, Mazhar, and Afridi (2019) found openness helps growth and employment in agriculture and industry but hurts services. Choudhri and Hakura (2000), building on Krugman’s technology gap theory, found import competition boosts productivity only in medium-growth industries, with proximity to the global technology frontier mattering more than openness alone. Martinez-Zarzoso and Marquez-Ramos (2008) found openness raises labour productivity overall, more strongly where institutions are weaker, supporting the same manufacturing-versus-services divide. Kovak (2013) took this to the regional level using Brazil’s early-1990s liberalisation: regions exposed to bigger tariff cuts saw wages grow roughly 4 percentage points more slowly per 10-point cut, depending on local industry mix. Hur and Park (2012) found FTAs don’t reliably raise GDP growth on their own but do change how partner countries grow relative to each other, echoing the uneven, sector- and region-dependent gains running through this section. Overall, the openness-growth relationship isn’t one number that applies everywhere; it depends on the period, non-tariff barriers, existing openness, and which sector or region is examined.
3.4 Developing vs Developed Economies: Uneven Gains from Trade
Whether trade helps developing and developed economies equally is a question this literature mostly answers with a no, though papers differ on why. Smits (2014) found trade widened the income gap between developing and developed countries from 1990-2012, with developed nations benefiting more. Dorn, Fuest, and Potrafke (2022) found no strong general link between globalisation and inequality, arguing the effect depends on each country’s own institutions: its tax system, education, and governance quality. Bernhardt (2014) argued the real problem is the rules behind trade: WTO agreements on intellectual property and investment protect tools rich countries used during their own development, while poorer countries have little say in how rules are set in Geneva. Pavcnik (2017) showed outcomes depend on the type of trade shock: import competition caused lasting, concentrated harm in Brazil and India’s more exposed rural districts, while export driven growth reduced poverty in Vietnam and shifted jobs out of agriculture in China. Together, these papers suggest the simple developing versus developed split doesn’t capture much; unequal outcomes seem to reflect bargaining power, the trade shock faced, and labour mobility more than income level alone.
3.5 Summary of Literature Review
Across all four themes, the research agrees that trade, whether through a specific agreement or general openness, tends to help growth and trade volumes, but only under the right conditions; theory explains why, through specialisation, gravity-driven trade volumes, and faster access to new technology. Deeper agreements tend to produce bigger gains than shallow tariff cuts, and how much shows up depends on domestic reforms. The research disagrees on distribution and stability: whether developing or developed economies gain more seems to depend on bargaining power and trade shock type rather than income level, and sector-level evidence shows gains split unevenly too, with services losing out to agriculture and industry in some studies. India’s own openness-to-GDP relationship has flipped sign across three decades, which the threshold literature suggests may reflect nonlinearity rather than real instability. Overall, trade agreements and openness look like necessary but not sufficient conditions for growth, depending on agreement depth, non-tariff barriers, sector, and a country’s ability to turn access into real gains.
3.6 Research Gap
The biggest limitation is that studies in this review measure trade openness in incompatible ways: some use tariff levels, others use trade-to-GDP ratios, globalisation indexes, or counts of non-tariff measures, and each draws on a different country sample. This makes it hard to directly compare, for instance, the ARDL-based estimate of India’s openness-GDP link with the panel study of 13 European transition economies, since neither uses the same measure of openness. A more specific gap is sectoral: most sector-level evidence in Theme 3 comes from outside India (Brazil, sub-Saharan Africa, cross-country panels), and none of it covers India’s post-2020 agreements such as the UAE CEPA, so it remains unclear whether India’s recent trade deals are producing the same uneven, sector-by-sector gains found elsewhere. This review addresses the measurement-comparability gap by flagging where estimates rely on different openness measures, leaving India-specific, post-2020 sector-level research as a clear next step.
4. METHODOLOGY
4.1 Sample & Technique
Judgmental purposive sampling was used to select key trade agreements across regional and bilateral contexts (WTO, ASEAN, EU, NAFTA/USMCA, SAARC). The sample period covers 2000–2019, with selected post-2020 data for Malaysia and Singapore, chosen to capture long-term shifts in trade intensity and growth across major global policy phases. Macro-level sectors (agriculture, industry, and services) were also selected based on their differential contribution to GDP growth across economies.
4.2 Research Design
The study adopts a descriptive-cum-explanatory correlational design to examine the relationship between international trade agreements, trade volumes, and economic growth across countries.
This design enables the systematic description of trade and growth patterns while testing whether changes in trade participation and intensity are associated with economic performance and helps explain how trade agreements influence growth through market access, export diversification, and increased trade flows.
4.3 Nature of Research
The research is quantitative, relying primarily on secondary economic and trade datasets. This approach is suitable given the need to measure variables such as GDP growth, export-import volumes, and trade agreement participation through statistical comparison and correlation, thereby strengthening the objectivity, comparability, and empirical robustness of the findings.
4.4 Variables Used
The dependent variables are GDP growth rates at the national, agricultural, industrial, and service levels. The main independent variable is trade openness (regional, bilateral, multilateral, and overall Indian); trade volume, agreement-type dummies, and tariff rates are additional independent variables. Exchange rate, FDI, the number of non-tariff barriers, and institutional development serve as control variables.
4.5 Ethical Considerations
The study maintains accuracy in data use, proper citation of secondary sources, and objectivity in analysis. Methodological transparency is upheld through clear disclosure of data sources, variable selection, and analytical procedures, with intellectual property rights respected through careful acknowledgment of datasets, reports, and published literature.
4.6 Limitations
The study depends on secondary data, which may vary in quality, coverage, and comparability across countries. Differences in economic structures, policy regimes, and time periods may complicate isolating the effect of trade agreements from other growth determinants. These limitations are minimized through careful dataset selection, consistent indicators, and cautious interpretation of results.
Some specific data-related limitations are noted below:
i. Korea’s 2016 and 2017 total trade figures are identical ($15,785 million). These figures should be verified against the Embassy source in case it’s a potential duplication in the dataset rather than a genuine flat year.
ii. Korea’s pre-CEPA window is limited to only three years. Extending the period to 2000–2006 using UN Comtrade/WITS could strengthen the comparison and remove the need for the ‘matched window’ caveat.
iii. A discrepancy exists between the KITA/Embassy figure for the 2010 figure ($17.1bn per Embassy/KITA vs. $13.6bn per UN Comtrade); this analysis uses the Embassy series throughout as a stated methodological choice.
5. DATA ANALYSIS
This section studies India’s bilateral trade before and after four preferential trade agreements: the India–ASEAN FTA (AIFTA), the India–Korea CEPA, and, within the ASEAN relationship, Malaysia and Singapore individually. Each case uses matched pre- and post-agreement windows of national trade statistics, with all available annual observations included.
India–ASEAN Trade (AIFTA, in force 1 January 2010)
AIFTA was signed on 13 August 2009 and took effect on 1 January 2010. Bilateral trade rose from about $43 billion in 2009-10 to $97 billion in 2018-19 (peaking near $132 billion in 2022-23 before slipping to $121 billion in 2023-24), lifting ASEAN’s share of India’s total trade from 9.4% to 11.5%.
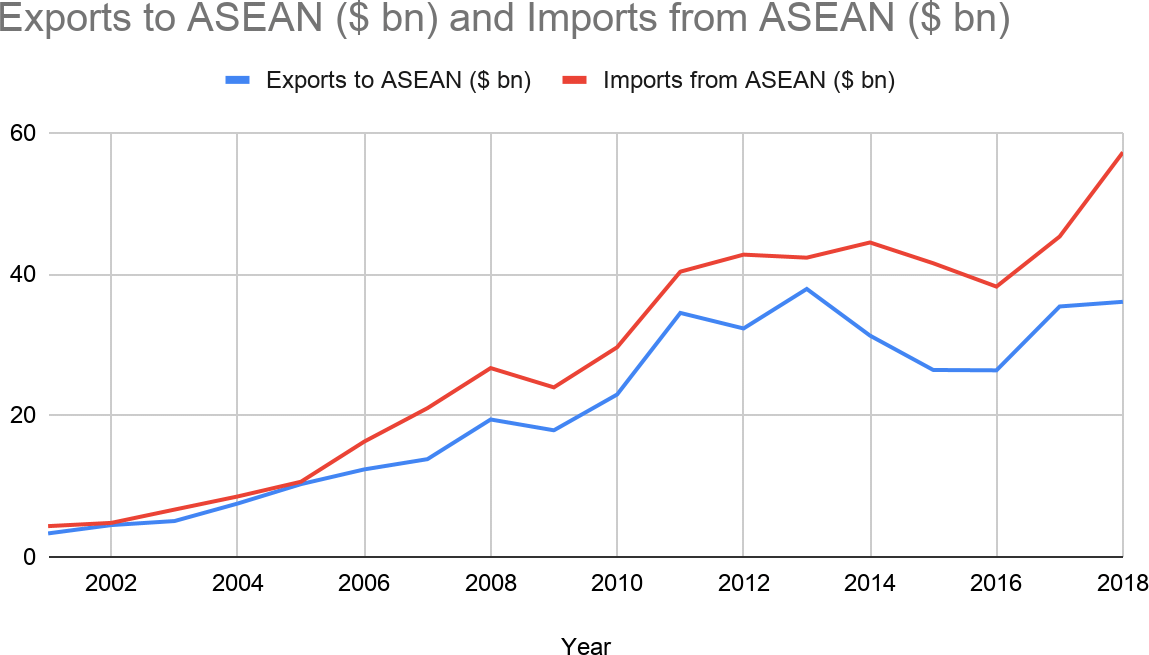
Exports to ASEAN and imports from ASEAN ($ bn). Source: India Business and Trade, case study on the India–ASEAN FTA.
Over matched nine-year pre- and post-agreement windows (2001–09 vs. 2010–18), average trade volume roughly tripled, though the CAGR fell from 23.6% to 7.4%, a base effect rather than a slowdown, since post-agreement growth started from a much larger trade volume. Imports from ASEAN grew faster than exports throughout, widening India’s deficit with the bloc.
India–Korea Trade (CEPA, in force 1 January 2010)
CEPA was signed on 7 August 2009 and took effect on 1 January 2010, with Korea phasing out tariffs on 90% of Indian exports and India on 85% of Korean exports. Bilateral trade rose 40% in the first year to over $17 billion. India’s exports to Korea grew from $3.6 billion (2010) to $7.09 billion (2021), while imports rose from $9.96 billion to $17.07 billion, a deficit of about $8.5 billion in Korea’s favour. Trade fell short of the $30 billion target set for 2014, reaching only $18.05 billion.
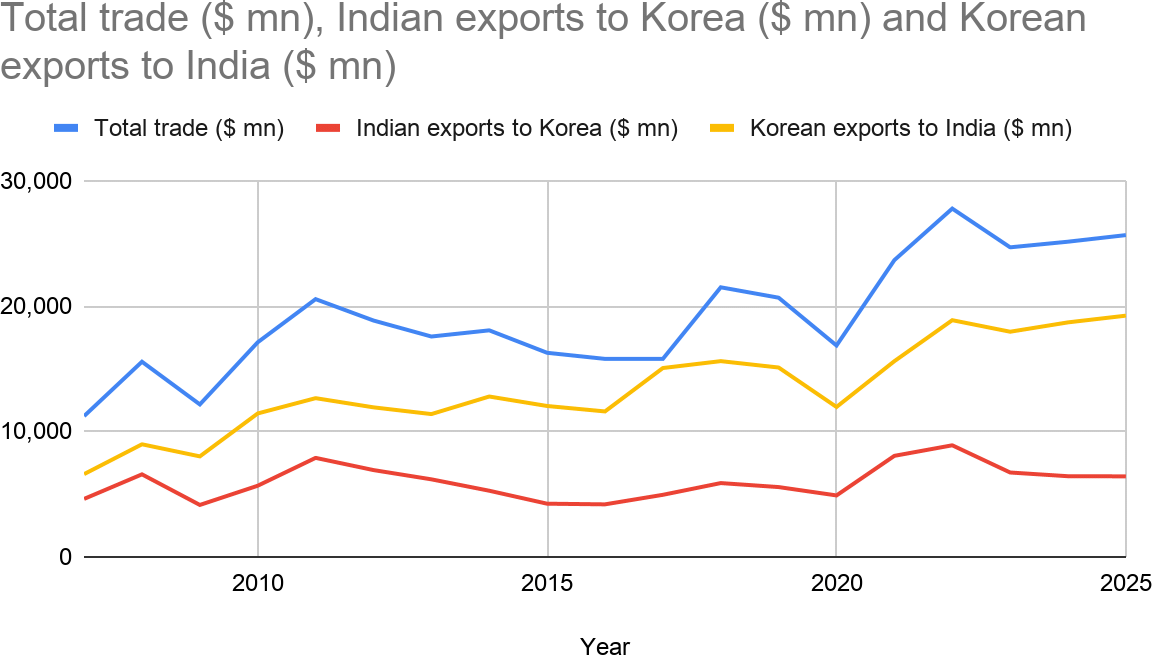
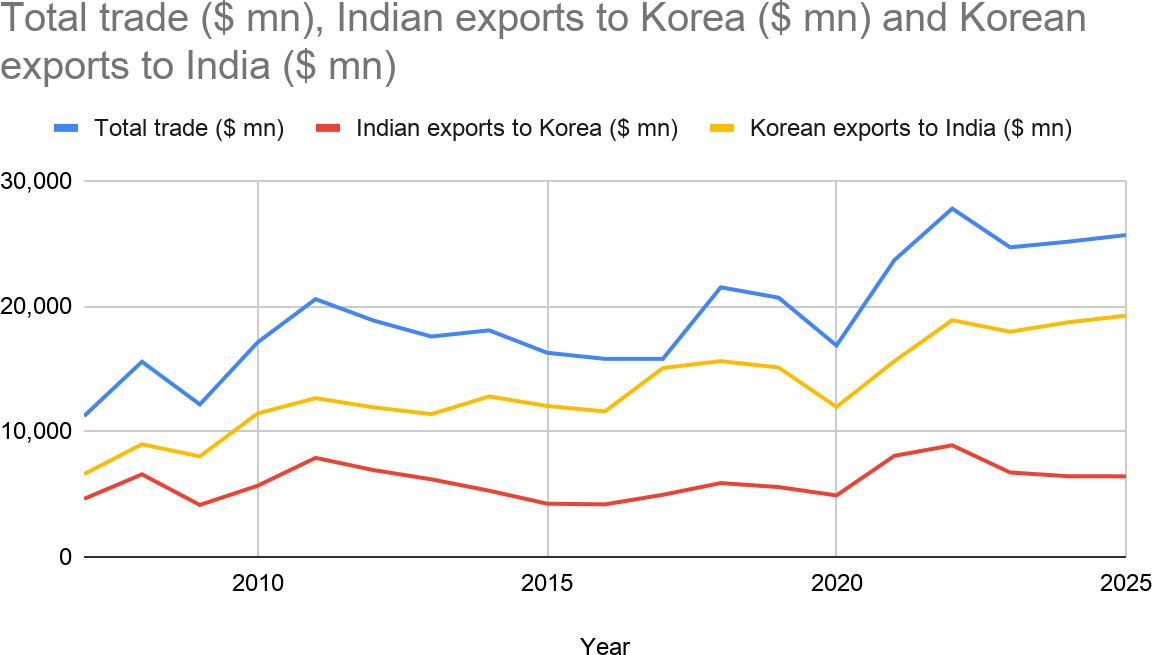
Total trade, Indian exports to Korea, and Korean exports to India ($ mn). Source: Embassy of India, Seoul.
On a matched three-year window (2007–09 vs. 2010–12, limited by data availability), average trade rose 45% post-agreement, without the growth-rate collapse seen in the AIFTA case since the shorter window is less base-inflated. As with ASEAN, the deficit widened in Korea’s favour.
Cross-agreement comparison at a glance
| Metric | AIFTA (ASEAN) | Korea CEPA (matched window) |
| Avg. trade growth, pre → post | +206.0% | +45.1% |
| Deficit direction | Widened (~3.4x) | Widened (~1.9x) |
| Post-period CAGR | 7.42% | 4.95% |
These two agreements aren’t directly comparable (ASEAN is a bloc, Korea a single partner, and the windows differ in length), so read this as directional, not statistical.
India–Malaysia Trade (AIFTA)
Using matched five-year pre- (2006–11) and post-AIFTA (2020–25) windows, average exports rose from US$15.33 billion to US$32.06 billion (+109%) and imports from US$20.73 billion to US$40.32 billion (+94%), widening the average deficit from –US$5.40 billion to –US$8.26 billion.
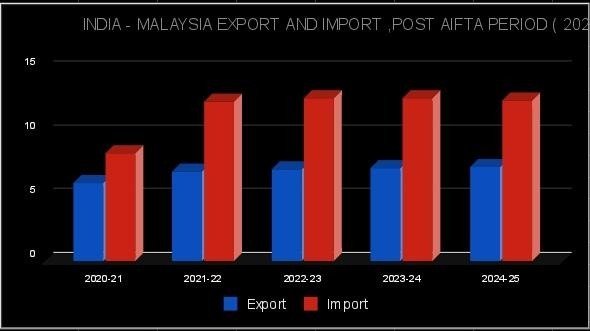
India–Malaysia exports and imports, post-AIFTA period (2020–2025).
Imports consistently exceeded exports throughout, and ASEAN’s share of India’s exports rose from 8.5% (1996–2010) to 10.4% (2010–2024): AIFTA raised trade volumes substantially, but the imbalance persisted and widened in dollar terms.
India–Singapore Trade (CECA/CEPA, 2005)
Singapore is India’s largest ASEAN trading partner, with total bilateral trade of about US$34.27 billion in 2024–25, a fivefold rise from US$6.65 billion in 2005–06.
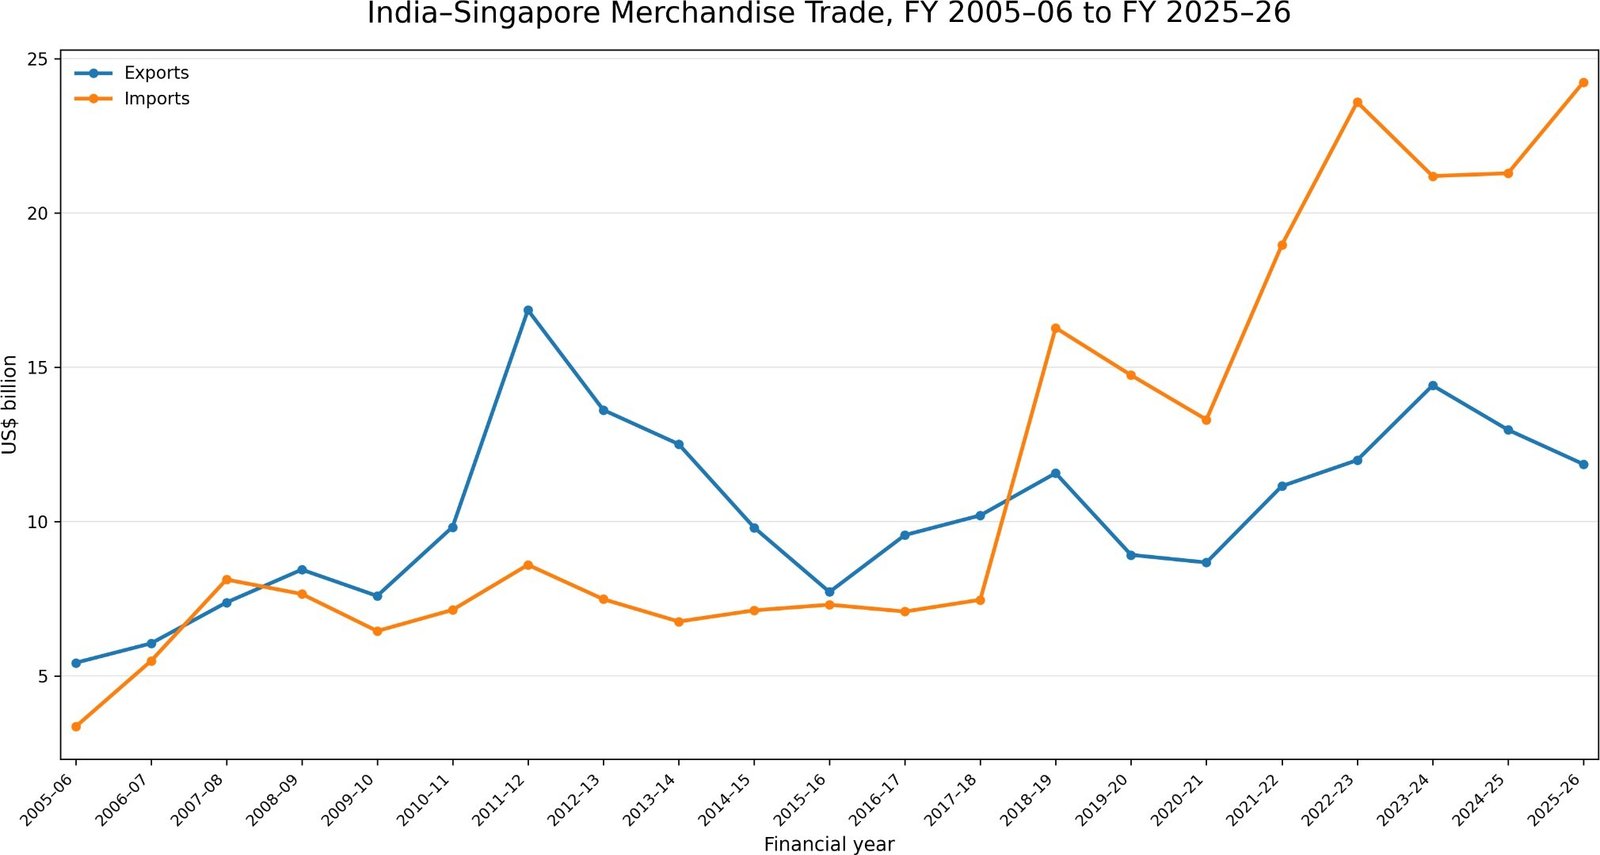
India–Singapore Merchandise Exports and Imports, FY 2005–06 to FY 2025–26
Post-CEPA, average annual exports rose from about US$2.36 billion to US$10.5 billion (+344%) and imports from US$2.37 billion to US$12.0 billion (+406%). As with ASEAN and Korea, the deficit widened, from US$1.35 billion to about US$8.31 billion. Despite the imbalance, CECA made Singapore India’s leading ASEAN partner and its largest single FDI source (about 25% of inflows).
5.2 Sectoral Export Composition
This section looks at the composition of export growth (agriculture, industry, and services) rather than its volume alone, since sectoral structure shapes how trade openness translates into GDP growth.
United States and France
The USA’s industrial exports surged from $1,096 billion (2000) to $3,430 billion (2025), far outpacing France’s rise from $390 billion to $1,124 billion, with the USA leaning on high-value, capital-intensive manufacturing trade, France on a more diversified sectoral spread. Both dipped around the 2008–09 financial crisis and accelerated after 2020 despite the pandemic; in both, agriculture remained the smallest contributor, with manufacturing and services the main channels linking trade openness to growth.
India and China
India’s export structure is comparatively diversified, with services, especially IT and other knowledge-intensive activities, playing a significant role alongside industry, pointing to skill-driven, technology-enabled trade. China’s growth, by contrast, is overwhelmingly industry-and manufacturing-led, consistent with its role as a global manufacturing hub.
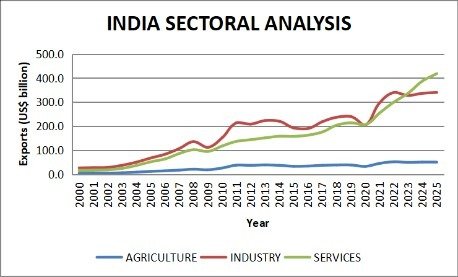
India: exports by sector (agriculture, industry, services), 2000–2025.
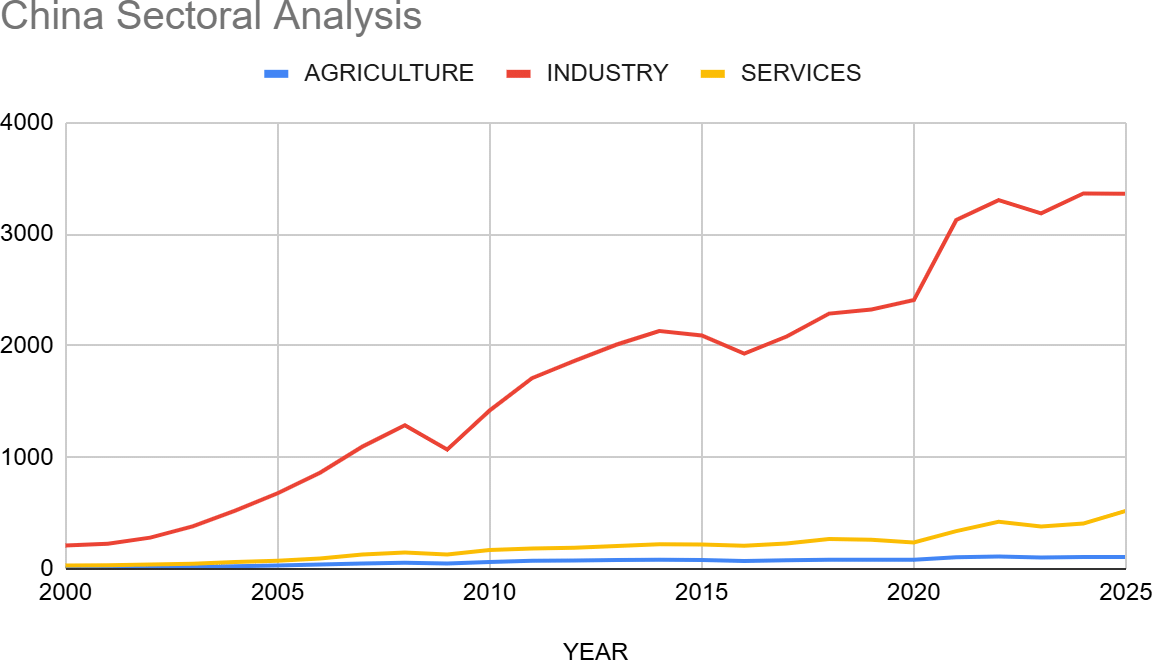
China: exports by sector (agriculture, industry, services), 2000–2025.
Both saw a temporary slowdown around 2008–09 and a strong post-pandemic recovery, with agriculture the smallest contributor in each. India’s growth increasingly runs through services and knowledge-intensive exports; China’s remains rooted in manufacturing, two distinct sectoral pathways linking trade openness to growth.
5.3 Trade Openness GDP Growth
This section examines trade openness and GDP growth in the USA, India, Germany, and Vietnam (2000–2025), four economies representing different levels of trade integration, from the USA’s large domestic market to Vietnam’s export-oriented model. Annual data on trade openness (% of GDP) and GDP growth (annual %) are from World Bank WDI.
Trade openness, 2000–2025
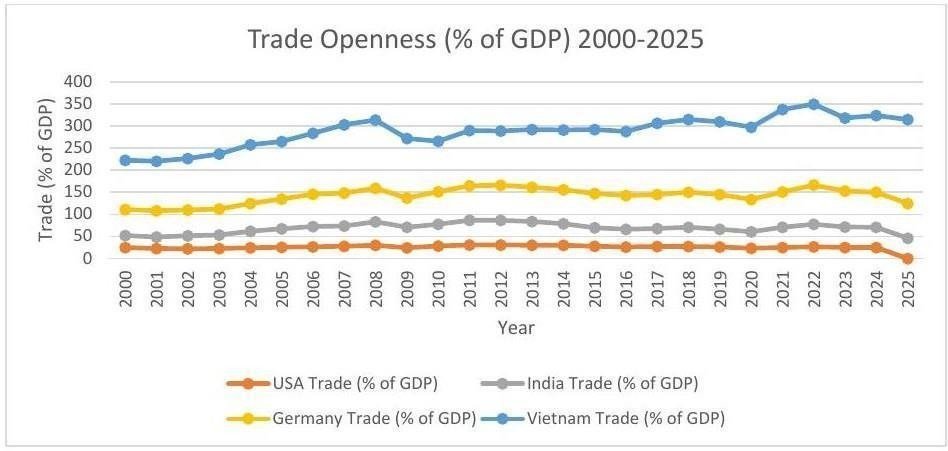
Figure 1. Trade openness (% of GDP), 2000–2025. Source: World Bank, WDI (2025).
Vietnam records the highest trade openness throughout, rising from 111.4% of GDP (2000) to around 190% (2025). Germany follows, rising from 59.2% to a peak of 88.8% (2022). India rises from 26.9% (2000) to 55.8% (2012), before declining and recovering to 46.3% (2025). The USA remains least open, generally 22–31%, a low ratio driven by domestic market size rather than limited trade. As the GDP trends below show, higher openness doesn’t necessarily mean higher growth.
GDP growth, 2000–2025
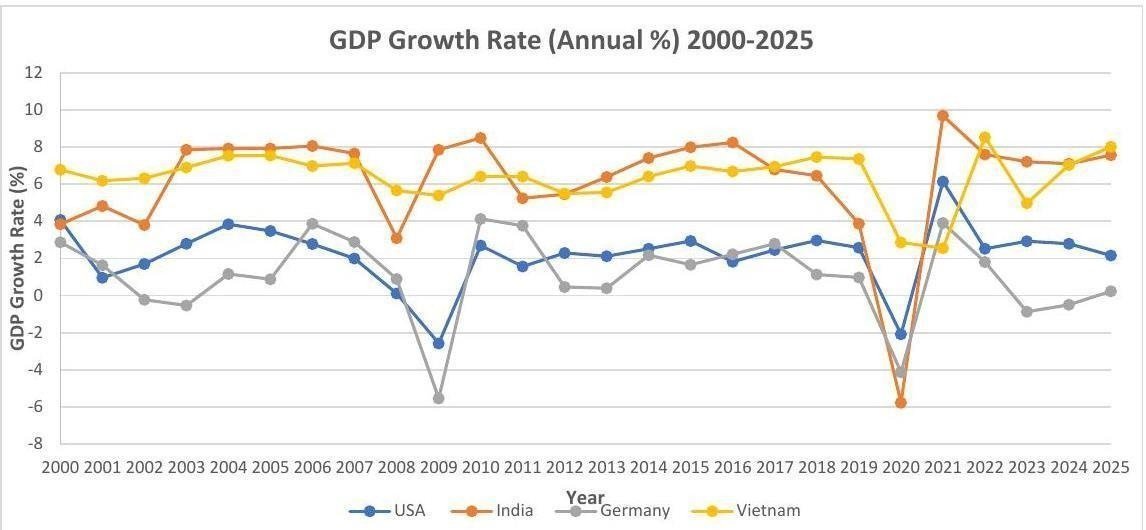
Figure 2. GDP growth rate (annual %), 2000–2025. Source: World Bank, WDI (2025).
GDP growth varies considerably, with the 2009 crisis and 2020 pandemic standing out clearly. In 2020 the USA, Germany, and India contracted (−2.08%, −4.13%, −5.78%), while Vietnam stayed positive at 2.87% despite being the most open economy in the sample, suggesting trade openness alone doesn’t determine how economies weather external shocks; domestic policy, economic structure, and investment matter too.
Average trade openness vs. average GDP growth
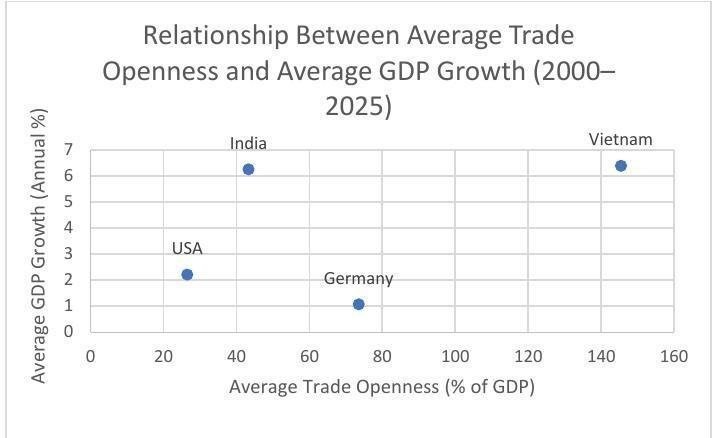
Figure 3. Relationship between average trade openness and average GDP growth, 2000–2025.
Source: authors’ calculation based on World Bank WDI.
Vietnam has both the highest average openness (145.5%) and growth (6.39%). India combines lower openness (43.3%) with similarly high growth (6.25%). Germany has relatively high openness (73.6%) but the lowest growth (1.08%); the USA has the lowest openness (26.5%) and moderate growth (2.22%). This points to a positive but inconsistent association: Germany shows high openness doesn’t guarantee high growth, India shows strong growth is achievable at low openness. With only four observations, these findings are descriptive, not causal: openness’s effect on growth appears conditional on how well an economy converts it into productivity, investment, and infrastructure gains.
5.4 Tariffs & Terms of Trade
Net Barter Terms of Trade Index
The Net Barter Terms of Trade Index captures the ratio of export to import prices over time, based to 2015 (=100), for the United States, Germany, Vietnam, and Indonesia (2005–2024), sourced from World Bank WDI.
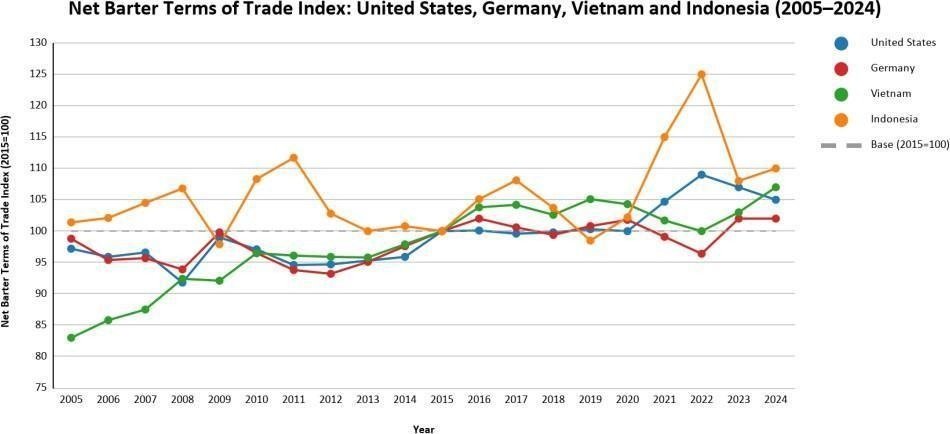
Net Barter Terms of Trade Index: United States, Germany, Vietnam, and Indonesia (2005–2024).
Source: World Bank, WDI.
Vietnam started lowest (83.0 in 2005) and rose steadily, crossing 100 by 2015 and closing at 107.0 by 2024, a gradual climb reflecting strengthening export prices. The US and Germany stayed within a narrower band (roughly 91–110), both dipping in 2008 and recovering within a year or two, closing at 105.0 and 102.0 respectively in 2024. Indonesia is the outlier, swinging from 97.9 (2009) to 111.7 (2011), down to 98.5 (2019), up to a dataset-high 125.0 (2022), then falling to 108–110, reflecting its exposure to commodity price swings. Developed status here tracks more with stability than with higher values; Vietnam’s steady rise and Indonesia’s volatility mark two very different developing-economy trajectories.
Average Applied MFN Tariff Rate
This measure captures the average tariff a country charges on imports from all WTO members, before any preferential agreement, for Germany, the US, Singapore, and India (2000–2022), sourced from the World Bank.
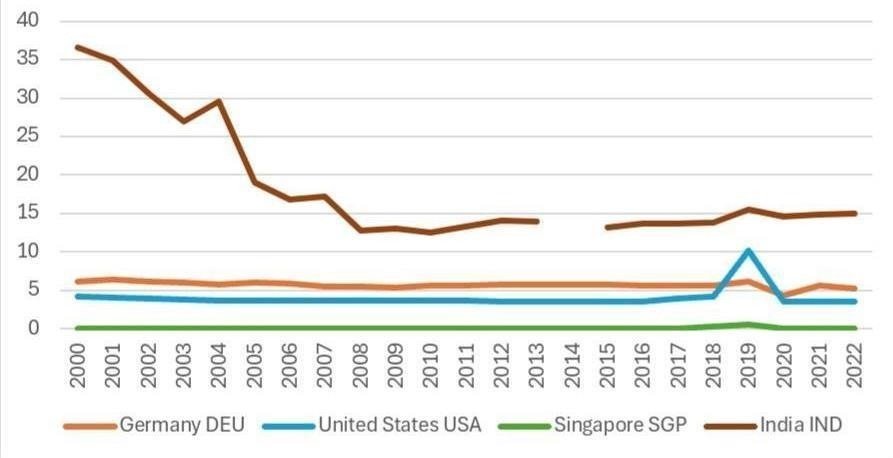
Average Applied MFN Tariff Rate: Germany, United States, Singapore, and India (2000–2022).
Source: World Bank.
India has the highest tariffs (36.56% in 2000), falling sharply to ~13% by 2008–10 and holding at 13–15% through 2022, still highest of the group, reflecting continued protection of domestic industry (2014 data is absent from the series). Germany held a stable 5–6% (consistent with EU trade policy); the US held 3–4% for most of the period, spiking in 2019 before returning to 3–4%. Singapore’s rate is the lowest, at roughly 0% throughout.
5.5 Synthesis and Convergence
Taken together, the four analyses point to a consistent, conditional story about trade and growth rather than a simple ‘more trade, more growth’ relationship.
- Trade agreements reliably raise trade AIFTA and CEPA both produced large, in some cases multi-fold, increases in bilateral trade with ASEAN, Korea, Malaysia, and Singapore over one to two decades.
- But agreements haven’t corrected India’s trade deficits. In every bilateral relationship studied, imports grew faster than exports after the agreement, widening the deficit even as total trade grew.
- Openness alone does not predict growth. Germany combines high trade openness with the lowest average GDP growth among the four countries studied, while India combines comparatively low openness with growth on par with Vietnam, the most open economy in the sample.
- Sectoral composition helps explain why: the USA and China lean on capital-intensive industry and manufacturing, while France and India lean more on services and a diversified mix: different pathways through which the same trade openness can (or can’t) translate into growth.
- Tariff policy and terms of trade add a further layer: India’s still-elevated tariffs reflect continued protection even as specific bilateral agreements liberalise, while shifts in terms of trade (Vietnam’s steady rise, Indonesia’s volatility) show that prices, not just volumes, shape how much economies actually gain from trade.
Overall, the evidence supports treating trade openness and trade agreements as enabling conditions for growth rather than guarantees of it. Their effect on GDP depends on complementary factors like export composition, productivity, domestic policy, and how deficits and tariffs are managed, each examined from a different angle in this report.
-
DISCUSSION AND CONCLUSION
The bilateral case studies in Section 2 confirm a pattern consistent enough to call a finding rather than a coincidence: AIFTA, CEPA, and the Singapore CECA all produced substantial, multi-fold increases in trade volume within a decade or two of entering into force. Yet in every relationship examined, ASEAN, Korea, Malaysia, and Singapore alike, the post-agreement deficit widened rather than narrowed. This suggests that preferential trade agreements are effective at generating trade but are largely neutral, or even mildly adverse, with respect to India’s terms of engagement within that trade. A plausible explanation is structural rather than agreement-specific. India’s partners in this set (Korea, Singapore, and the more industrialised ASEAN members) supply capital goods, electronics, and intermediate inputs that Indian industry depends on, while India’s exports remain comparatively less diversified up-market. Liberalisation under an FTA lowers the cost of both flows at once, but the partner side appears to respond more elastically, consistent with what the report terms the “asymmetric-gains pattern.” Section 4 poses the report’s most direct challenge to conventional trade-growth narratives. If trade openness mechanically produced growth, Germany, whose openness is nearly double India’s, should outperform India on GDP growth; instead the reverse holds by a wide margin (1.08% vs. 6.25% average annual growth). Vietnam is the case that keeps the openness thesis alive at all, pairing the highest openness with the highest growth, but even here the sectoral data in Section 3 suggests openness is working through a specific channel, namely export-oriented manufacturing integrated into global supply chains, rather than acting on its own. Read together, Sections 3 and 4 support a channel-dependent model of trade and growth: openness matters to the extent an economy has converted it into a productive export base, whether manufacturing scale for China and the USA or services and knowledge-intensive exports for India, rather than functioning as an independent growth input. India’s tariff trajectory in Section 5 (36.6% in 2000, falling to a persistent 13–15%) sits awkwardly alongside its simultaneous pursuit of AIFTA, CEPA, and CECA. Rather than reading this as inconsistency, the more useful interpretation is that India has pursued a dual-track trade strategy: liberalising selectively through bilateral and regional agreements while retaining a comparatively high MFN baseline to protect domestic industry from non-preferential competition. This is consistent with India’s export structure remaining services-weighted rather than manufacturing-led (Section 3.2); tariff protection has plausibly slowed the kind of large-scale manufacturing liberalisation that characterises Vietnam’s or China’s growth model.
The evidentiary base underlying these conclusions carries real constraints that should be kept in view. Section 5.3’s openness-growth relationship rests on only four country-level observations, enough to describe a pattern but not enough to establish causality or control for confounds such as domestic investment or institutional quality. The bilateral case studies in Section 5.1 use pre/post windows of different lengths (three, five, and nine years) depending on data availability, which makes cross-agreement comparisons directional rather than statistically comparable. The Korea-CEPA analysis also notes a real conflict between Embassy/KITA and UN Comtrade figures for 2010, resolved by a stated but unavoidably subjective methodological choice to favour the Embassy series. And more broadly, none of the four sections isolates trade policy as a causal driver of growth; all four describe associations that are consistent with, but do not prove, the causal story implied in the synthesis.
Across bilateral trade volumes, sectoral composition, macro-level openness, and tariff policy, this report’s four analyses converge on the same qualified conclusion: trade liberalisation reliably increases the quantity of trade but does not, by itself, determine its distributional outcome or its contribution to growth. Agreements widened India’s deficits even as they multiplied trade values; high openness coincided with both the best (Vietnam) and worst (Germany) growth performance in the sample; and tariff policy suggests India has treated liberalisation as compatible with continued domestic protection rather than as a substitute for it. The consistent thread is that trade openness functions as an enabling condition whose growth payoff is mediated by sectoral composition, productivity, and domestic policy choices, not as a standalone growth mechanism. Future work on this theme would benefit from a longer and more uniform panel to reduce the window-matching problem identified in Section 2, a larger cross-country sample for the openness-growth analysis, and disaggregated tariff data by sector to test whether India’s protection is concentrated in the industries where its trade deficits are widest.
REFERENCES
Arote, P., Sagara, H., Chakradhar, J., Desai, G., Pravin, J., & Bandhu, D. (2026). The impact of India-ASEAN free trade agreement on trade flows: An application of augmented gravity model. PLOS ONE, 21(6), e0350036.
Bernhardt, T. (2014). North-south imbalances in the international trade regime: Why the WTO does not benefit developing countries as much as it could. Consilience, (12).
Bhattacharyya, R., & Mandal, A. (2016). India–ASEAN Free Trade Agreement: An ex post evaluation. Journal of Policy Modeling, 38(2), 340–352.
Blyde, J., & Hoekman, B. (2016). The impact of trade agreements: New approach, new insights (IMF Working Paper No. 2016/117). International Monetary Fund.
Choudhri, E. U., & Hakura, D. S. (2000). International trade and productivity growth: Exploring the sectoral effects for developing countries. IMF Staff Papers, 47(1), 30–53.
Dorn, F., Fuest, C., & Potrafke, N. (2022). Trade openness and income inequality: New empirical evidence. Economic Inquiry, 60(1), 202–223.
Economic Diplomacy. (2026). https://economicdiplomat.in
Ederington, J., & Ruta, M. (2016). Non-tariff measures and the world trading system (World Bank Policy Research Working Paper No. 7661). World Bank.
Ekanayake, E. M., Mukherjee, A., & Veeramacheneni, B. (2010). Trade blocks and the gravity model: A study of economic integration among Asian developing countries. Journal of Economic Integration, 25(4), 627–643.
Embassy of India, Seoul. (n.d.). India-ROK trade and economic relations.
Gaurav, K., & Bharti, N. (2018). India–Japan CEPA. Foreign Trade Review, 53(3), 189–203.
Grossman, G. M., & Helpman, E. (1991). Trade, knowledge spillovers, and growth. European Economic Review, 35(2–3), 517–526.
High Commission of India, Kuala Lumpur. (2026). Bilateral relations: India–Malaysia. High Commission of India, Singapore. (2025). https://www.hcisingapore.gov.in
Hur, J., & Park, C. (2012). Do free trade agreements increase economic growth of the member countries? World Development, 40(7), 1283–1294.
IBEF. (2025). Exploring India Malaysia trade and economic relations. IMPRI. (2025). Advancing free trade through AITIGA reforms.
India Business and Trade. (2019). Case study: India-ASEAN FTA.
Ismail, S., & Ahmed, S. (2024). Economy-wide impacts of India–UAE CEPA: A CGE analysis. The Indian Economic Journal, 73(4).
Jain, M. (2020). Review of ASEAN-India free trade agreement using revealed comparative advantage index. International Journal of Business & Economics, 5(2), 56–65.
Jalil, A., & Rauf, A. (2021). Revisiting the link between trade openness and economic growth using panel methods. Journal of International Trade & Economic Development, 30(8), 1168–1187.
Khati, P., & Kim, C. (2022). Impact of India’s free trade agreement with ASEAN on its goods exports: A gravity model analysis. Economies, 11(1), 8.
Kumarasamy, D. (2023). Strengthening regional value chain between India and South Korea (KIEP Research Paper, World Economy Brief 23-10). Korea Institute for International Economic Policy.
The Korea Herald. (2015). https://www.koreaherald.com
Kovak, B. K. (2013). Regional effects of trade reform: What is the correct measure of liberalization? American Economic Review, 103(5), 1960–1976.
Kumar, S., Yeligar, S. S., Venkatesh, P., Kingsly, I., Nain, M. S., Paul, R. K., Madhurima, U., & Mouzam, S. M. (2024). Impact analysis of the India-EU Free Trade Agreement on Indian horticulture. Indian Journal of Agricultural Economics, 79(3), 341–348.
Martinez-Zarzoso, I., & Marquez-Ramos, L. (2008). The effect of trade facilitation on sectoral trade. The B.E. Journal of Economic Analysis & Policy, 8(1), Article 42.
MEA, Government of India. (2025). India-Malaysia bilateral relations.
Pavcnik, N. (2017). The impact of trade on inequality in developing countries (NBER Working Paper No. 23878). National Bureau of Economic Research.
Singh, L. B. (2021). Impact of India-ASEAN Free Trade Agreement: An assessment from the trade creation and trade diversion effects. Foreign Trade Review, 56(4), 400–414.
Smits, E. (2014). International trade and the income inequality gap between developed and developing countries [Bachelor’s thesis, Erasmus University Rotterdam].
Stolper, W. F., & Samuelson, P. A. (1941). Protection and real wages. Review of Economic Studies, 9(1), 58–73.
Tahir, M., & Pg Haji Omar Ali, D. N. B. (2014). Trade openness and economic growth: A review of the literature. Asian Social Science, 10(9), 137.
Tahir, M., Mazhar, T., & Afridi, M. A. (2019). Trade openness and sectoral growth in developing countries: Some new insights. Journal of Chinese Economic and Foreign Trade Studies, 12(2), 90–103.
World Bank. (2025). World Development Indicators. https://data.worldbank.org/
Zahonogo, P. (2016). Trade and economic growth in developing countries: Evidence from Sub-Saharan Africa. Journal of African Trade, 3(1–2), 41–56.