
Authors: Sanskriti, Shruti Shukla, Anirudh PV, Abigail B Phiri
ABSTRACT
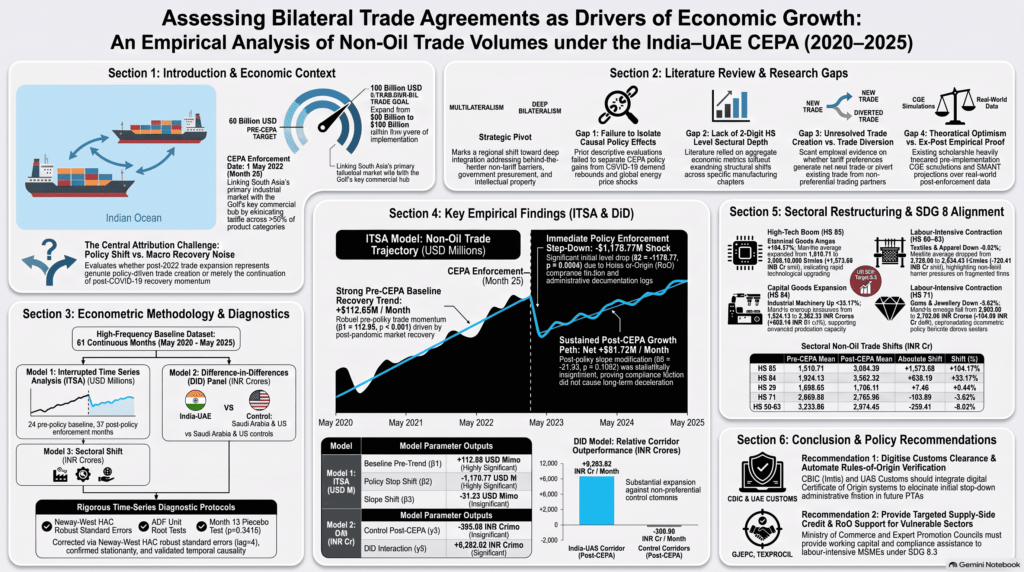
This study evaluates the bilateral non-oil trade performance between India and the United Arab Emirates(UAE) following the enforcement of the Comprehensive Economic Partnership Agreement (CEPA) on May 1, 2022(Month 25). As one one of the India’s fastest-negotiated comprehensive trade agreements, the CEPA lowered tariffs across a wide range of non-oil merchandise categories, raising the empirical question of whether the trade gains recovered since 2022 reflect a genuine policy-induced structural break or simply the continuation of the post-pandemic recovery momentum that was already underway across global trade corridors. To isolate the CEPA’s contribution, the study applies a 61-month segmented Interrupted Time Series Analysis (ITSA) to the India-UAE non-oil trade series(denominated in USD Millions), alongside a Difference-in-Difference (DiD) panel model ( N = 183, denominated in INR crores), ITSA is in USD millions and DiD is in INR crores. This benchmarks the treated corridor against two non-preferential control corridors, India-Saudi Arabia and India-United States of America. Both specifications employ Newey-West heteroskedasticity and autocorrelation-consistent (HAC) standard error with a four-month lag to correct for serial correlation in the underlying monthly series. The ITSA results shows an immediate negative level adjustments of -1,178.77 USD Millions (p = 0.0004) at the point of enforcement, consistent with short term administrative and Rules-of-Origin compliance friction, followed by a sustained net positive monthly expansion of 81.72 USD millions per month through the post-CEPA period; however, the post-enforcement slope change itself was statistically insignificant (β₃ = −31.23, p = 0.1592), indicating that the corridor largely maintained its pre-existing recovery trajectory. The DiD interaction term suggests that, post-enforcement, the treated corridor expanded by an additional 9,202.02 INR crores per month relative to non-preferential controls (p = 0.0018),through this estimates should not be interpreted as a clean causal effect because parallel pre-trends were rejected (t = 7.77, p < 0.001), this estimate is interpreted as an upper-bound directional indicator of relative outperformance rather than a precise causal magnitude. Sectoral decomposition shows the expansion concentrated in technology-intensive chapters, particularly Electrical Machinery (HS 85: +104.17%) and Industrial Machinery (HS 84: +33.17%), while traditional labor-intensive sectors such as Textiles and Gems & Jewellery contracted. Taken together, the evidence associates the CEPA with sustained net non-oil trade expansion and a structural reorientation toward technology-intensive exports, while cautioning that much of the aggregate growth is attributable to pre-existing recovery momentum — with implications for regional value-chain integration, the sequencing of future trade agreements, and targeted domestic support for labor-intensive sectors under SDG Targets 8.2 and 8.3.
KEYWORDS:
India-UAE CEPA, Non-Oil Bilateral Trade, Interrupted Time Series Analysis (ITSA), Difference-in-Difference (DiD), Trade Creation vs. Trade Diversion, UN SDG Target 8.2 and 8.3.
INTRODUCTION
Preferential Trade Agreements (PTAs) and Comprehensive Economic Partnership Agreements (CEPAs) have increasingly reshaped international commerce by lowering tariff barriers, reducing non-tariff administrative frictions, and establishing institutional channels for bilateral integration. The implementation of the India–UAE Comprehensive Economic Partnership Agreement on May 1, 2022 (Month 25), represents a landmark institutional framework linking South Asia’s largest industrial market with a premier commercial hub of the Gulf Cooperation Council (GCC). Designed to eliminate tariffs on over 80% of tariff lines, the agreement seeks to enhance bilateral non-oil commerce, diversify export baskets, and embed domestic enterprises into regional value chains.
Understanding the empirical dynamics of the India–UAE economic corridor is vital for macroeconomic planning across both regions. The UAE serves not only as a primary destination for Indian non-oil merchandise but also as a strategic gateway to wider Middle Eastern and African markets. Conversely, India provides Gulf economies with an expanding market for non-oil industrial inputs. Consequently, evaluating how tariff elimination translates into actual merchandise movement carries implications for regional supply chain integration, corporate investment strategies, and bilateral policy alignment.
A central empirical challenge in evaluating trade policy lies in isolating policy-induced trade shifts from exogenous macroeconomic shocks. The post-2020 international trade environment has been characterized by severe structural volatility, including post-COVID-19 demand rebounds, global supply-chain realignments, and shifting inflationary pressures. Standard descriptive evaluations often mistake post-pandemic recovery momentum for agreement-specific trade creation. Disentangling whether observed post-2022 change aligns with CEPA-related trade creation, relative to recovery dynamics, requires econometric policy-evaluation techniques.
Existing literature exhibits a clear empirical gap regarding post-2022 trade policy dynamics in South Asia–GCC corridors. While prior studies have relied on ex-ante computable general equilibrium (CGE) projections or aggregate annual cross-sectional data, there is a lack of continuous monthly econometric assessments covering the post-implementation period. Furthermore, existing work frequently fails to account for parallel pre-trend violations in quasi-experimental panel settings or aggregate product lines without examining 2-digit HS Chapter sectoral structural shifts.
This study partly addresses these empirical limitations by executing a multi-model evaluation of bilateral non-oil merchandise trade between India and the UAE over a 61-month baseline (May 2020 – May 2025). Specifically, this paper: (1) Applies an Interrupted Time Series Analysis (ITSA) to quantify immediate policy step-changes and long-term trend shifts; (2) Estimates a Difference-in-Differences (DiD) panel model against non-preferential trading corridors (India–Saudi Arabia, India–US) to evaluate relative trade expansion; and (3) Conducts product-level 2-digit HS chapter decompositions to examine whether sectoral structural shifts align with technological upgrading goals under UN SDG Target 8.2.
Literature Review
The implementation of India-UAE Comprehensive Economic Partnership Agreement(CEPA) in May 2022 is a clear cut shift from the slow pace of multilateralism to deep bilateralism as a key component of the national economic strategy. The topic is crucial because it is a key question of which preferential trade agreements can truly stimulate non-oil economic diversification or whether they simply create trade diversion and administrative complexity. This literature review aims to critically evaluate the existing scholarship to establish that the theoretical framework for growth is strong,but there is an empirical vacuum on the performance of non-oil trade volumes between 2020 and 2025. To achieve this, the review is organized in four themes: first, the evolution of bilateral versus multilateral frameworks, second, the strategic shift towards non-oil diversification in the Gulf corridor, third, the theoretical linkages between trade volumes and growth, and fourth, the specific technical mechanisms of tariff and non-tariff barrier elimination.
Theme 1 : Evolution of Bilateral Trade Agreements vs. Multilateral Trade Frameworks
The international trading system has historically been anchored in multilateral frameworks such as the General Agreement on Tariffs and Trade (GATT) and the World Trade Organization (WTO). However, difficulties in advancing multilateral negotiations, together with increasing interest in preferential trade arrangements, have encouraged countries to pursue bilateral agreements. The India-UAE CEPA represents this shift, providing an important case for examining whether bilateral agreements can contribute to trade expansion and economic growth (Górski & Bhukya, 2024). The theoretical foundations of trade agreements are rooted in the classic Vinerian distinction between trade creation and trade diversion (Viner, 1950), which has been extensively expanded to evaluate the welfare effects of preferential trade agreements relative to multilateral trade architectures (Bhagwati & Panagariya, 1996; Krueger, 1999). Empirical studies show that while free trade agreements generally increase international trade among member nations over the long run (Baier & Bergstrand, 2007), their specific impacts are mediated by administrative rules of origin and domestic compliance realities.
One argument in the literature is that bilateral agreements provide greater flexibility and more targeted market access than broad multilateral frameworks. (Górski and Bhukya,2024) show that CEPA introduced deeper commitments in areas such as government procurement, while reducing tariffs on more than 80% of items and opening 11 service sectors. Earlier gravity-model studies demonstrate India’s export potential in the GCC market (Ong et al.,2009; Alam & Ahmed, 2018), alongside (Goyal and vajid, 2018) for India-UAE specifically. In the Indian context, historical assessments of preferential trade agreements (PTAs) have highlighted mixed outcomes, showing that bilateral trade liberalization often leads to asymmetrical export growth and varying sectoral adjustments (Francis, 2011; Sikdar & Nag, 2011; Bhattacharyya & Mandal, 2016). A second argument concerns whether bilateral liberalisation produces consistent evidence with trade creation relative to controls. Ex post assessments of India’s earlier preferential agreements find that trade gains are real but often modest and asymmetric (Bhattacharyya & Mandal,2016), while sectoral evidence remains largely descriptive (Ahmed, 2010). However, regional trade agreements among developing countries tend to generate trade diversion (Urata & Okabe, 2014), while Gorski and Bhukya(2024) caution that bilateral agreements can create complex rules of origin and compliance costs.
Thus, although the literature indicates that CEPA has coincided with substantial trade expansion, it remains unclear whether the increase in non-oil trade can be attributed specifically to the agreement rather than wider economic conditions. Existing studies largely examine aggregate trade, investment, or individual sectors, leaving limited evidence on non-oil trade volumes over the 2020–2025 period. This study addresses this gap by empirically examining non-oil trade volumes before and after CEPA, thereby assessing whether bilateral trade liberalisation has contributed to sustained trade expansion and economic growth.
Theme 2: Economic Diversification Strategies in the India–Gulf Economic Corridors
Economic diversification has become an important strategy for India and Gulf economies seeking to reduce dependence on a limited number of commodities and strengthen long-term economic growth. The literature shows that the India-Gulf trade relationship has gradually expanded beyond traditional oil-based commerce toward manufacturing, services, logistics, investment, and re-export activities. In the UAE, diversification accelerated through the development of logistics infrastructure, free zones, aviation, finance, and services. The establishment of Jebel Ali Free Zone, for example, strengthened Dubai’s position as a global re-export hub, while non-oil trade increasingly expanded into machinery, aluminium, textiles, food products, and services. Economic assessments of India’s historical trade integrations underscore that while trade agreements can boost aggregate merchandise trade, their domestic industrial impacts are heavily influenced by intra-industry trade patterns and manufacturing competitiveness (Veeramani, 2002; NITI Aayog, 2019; Reserve Bank of India, 2023).
One major strategy identified in the literature is the use of trade agreements to improve market access and encourage sectoral diversification. The India-UAE CEPA goes beyond conventional tariff reduction by covering services, investment, intellectual property, government procurement and digital trade. By reducing tariff and non-tariff barriers, CEPA is expected to encourage firms to enter new markets, achieve economies of scale, attract investment, and diversify production. (Sharma, 2023) similarly shows that foreign direct investment contributes to India’s export performance, while CEPA remains a relatively new area requiring further empirical investigation. A second strand of literature highlights the role of strategic corridors and investment linkages. The UAE has become an important gateway connecting India with Gulf, African and European markets, while UAE investment supports infrastructure and other productive activities in India.
The CEPA also targets expansion of non-oil trade from USD 60 billion to USD 100 billion within five years, indicating that diversification is central to the agreement’s objectives. However, existing literature largely describes diversification strategies and aggregate trade outcomes rather than empirically establishing how CEPA has affected non-oil trade volumes. Therefore, this study examines India-UAE non-oil trade during 2020–2025 to assess whether the bilateral corridor and CEPA have contributed to broader trade diversification and economic growth.
Theme 3: Theoretical Linkages Between Trade Volumes and Economic Growth
International trade is widely recognized as an important factor influencing economic growth. A commonly used measure of an economy’s integration with international markets is the trade-to-GDP ratio, expressed as (Exports + Imports)/GDP. A higher ratio indicates greater participation in international markets. However, increased trade does not necessarily guarantee higher economic growth, as its impact depends on productivity, investment, technology transfer and resource allocation. The theoretical relationship can first be explained through comparative advantage, whereby countries specialize in activities in which they are relatively more efficient, improving the allocation of resources.
Modern growth theories extend this argument by emphasizing technology, knowledge and increasing returns to scale. (Rivera-Batiz and Romer, 1991) argue that economic integration expands market opportunities and facilitates knowledge transfer, supporting long-term growth. (Edwards ,1998) concludes that open economies experienced faster productivity growth.Exports can promote growth by expanding demand for domestic production, generating foreign exchange and encouraging investment. Imports can also support growth when they include machinery, technology and intermediate goods that improve productivity and productive capacity. Thus, both exports and imports can influence economic growth. This structural realignment is crucial for achieving sustainable economic growth and productive employment under the United Nations’ 2030 Agenda for Sustainable Development, particularly regarding technological upgrading and decent work (United Nations, 2015; Ramaswamy, 2018).
However, the relationship may be bidirectional. Economic growth can itself increase exports and imports through higher production capacity, income and domestic demand. (Frankel and Romer, 1999) examine the causal relationship between trade and income, while (Rodríguez and Rodrik, 2001) caution against interpreting the observed association between trade openness and growth as direct causality. Indian evidence also indicates variation in the trade-growth relationship. (Sharma and Panagiotidis, 2005) examine exports, imports and GDP in India, while (Guntukula, 2018) finds bidirectional causality between exports, imports and economic growth. These findings suggest that trade may both influence economic growth and respond to changes in economic activity. In the context of the India–UAE CEPA, tariff reductions and improved market access can encourage bilateral trade and potentially strengthen the channels through which trade affects economic growth.
Theme 4: Tariff Elimination Mechanisms and Non-Tariff Barrier
To improve bilateral market access, the India-UAE CEPA was implemented in May 2022, with a focus on tariff liberalization and non-tariff barriers. Tariff reductions lead to a decrease in import duties, which lowers the cost of traded goods and enhances exporters’ price control. Rules of origin are used to determine whether products meet the eligibility criteria for preferential access under CEPA. The effectiveness of tariff liberalisation is dependent on whether duties are lowered or firms comply with the requirements regarding origins and documentation. The impact of tariff liberalisation on bilateral trade has been suggested to be significant based on recent research. Evidence on preferential agreements indicates that product-specific effects differ across agreements and sectors. Deep agreements generate more trade creation and less trade diversion than shallow agreements (Mattoo et al., 2022), while ex post evidence from India’s trade agreements also points to substantial variation across products (Singh,2021). These findings show the extent to which preferential tariff access can affect bilateral trade, although they do not establish that the India-UAE CEPA generated better job creation or manufacturing output in both countries.
International trade costs are primarily affected by tariffs. Non-tariff barriers such as technical standards, sanitary and phytosanitary requirements, certification procedures, customs formalities, and regulatory differences can lead to increased compliance costs and delayed market entry. According to (Dhingra, Freeman and Huang (2023), the establishment of more comprehensive trade deals that tackle non-tariff and behind-the-border barriers can result in greater trade and welfare benefits than traditional tariff reductions. CEPA regulations on technical barriers, sanitary and phytosanitary measures, customs procedures, and trade facilitation can help to lower the added trade costs. CEPA may require firms to use its preferential provisions for the benefit of their businesses. The literature on existing studies has primarily concentrated on projected, simulated, or aggregate effects, with scant information on the actual outcomes after implementation
LITERATURE SUMMARY
A synthesis of the existing literature reveals several key trends. First, there is a clear consensus that the India-UAE CEPA represents a strategic shift from static multilateralism to deep bilateralism in order to gain specific market access. The second pattern is the shift of the India-Gulf economic corridor from a buyer-seller oil trade to a diversified economy that includes services, digital trade, and logistics centres such as the Jebel Ali Free Zone. Furthermore, researchers observe that modern agreements have evolved beyond simple merchandise exchange to include complex behind-the-border provisions such as government procurement and intellectual property.
The literature generally shows that trade openness, infrastructure, Foreign Direct investment(FDI) are key factors for long term productivity and economic growth. The India-UAE CEPA is a landmark shift in policy and that it provides greater institutional integration than previous policy frameworks. Scholars also concur that reducing both tariffs and non-tariff barriers(NTBs) is essential for firms to achieve economies of scale. Significant friction exists regarding causality and trade quality. Empirical studies frequently indicate the presence of a bidirectional relationship between growth and trade, in the sense that the growth process can also stimulate trade growth. One important issue is trade diversion;critics argue that preferential tariffs are likely to redirect trade from more efficient partners in the world to UAE, thereby having no net effect on the global economy.
First and foremost, there is no consensus on attribution. Other researchers have attributed the increased trade volumes after 2022 to CEPA, while others believe the increase is just macroeconomic noise from the post-COVID recovery and oil price fluctuations, which have not been isolated by studies. The literature reviewed suggests that the knowledge of the India-UAE CEPA is based on theoretical optimism and simulations (CGE and SMART models) and not on empirical reality. Most existing evidence is either descriptive or based on pre-CEPA data. The research as a whole suggests that the legal framework for non-oil revolution is in place, there is no empirical evidence that CEPA has led to a significant increase in volumes of non-oil trade during the period 2020-2025. The fact that the agreement is regarded as a key factor in diversification is therefore a hypothesis that still needs to be tested more rigorously.
RESEARCH GAP
However, the literature in the field has a huge empirical vacuum on the actual effects of the CEPA between India and UAE on non-oil trade. Most of the existing scholarship is pre-CEPA(historical or theoretical simulations. For example, studies of India’s earlier agreements rely on computable general equilibrium models and WITS-SMART simulations to project outcomes rather than measuring actual post-implementation trade performance (Sikdar & Nag,2011; Mondal & Sirohi,2016). As a result, there is limited evidence of rigorous post-implementation testing with a specific focus on the 2020-2025 period,
The reviews identifies four major gaps and areas of uncertainty:
- Failure to Isolate Causality: Recent descriptive assessments documenting the post-2022 surge have not isolated the effects of the covid-19 recovery, supply-chain disruptions, and oil-price volatility. This leaves it unclear whether trade expansion is a direct result of CEPA or merely a reflection of wider economic conditions. An interrupted time-series design is appropriate for addressing these limitations (Liden, 2015).
- Aggregate vs Sectoral Focus: Previous studies tend to focus on total trade or investment rather than the non-oil merchandise sector. Although (Ahmed, 2010) provides descriptive sectoral trends, such work lacks the econometric rigour to establish a causal link between the agreement and non-oil diversification.
- Trade creation or trade diversion: One of the key questions that remains unanswered is whether the agreement promotes trade creation or trade diversion, where preferential tariffs merely divert trade from more efficient global partners.
- Institutional vs Quantitative Gaps: Research into behind the border issues such as government procurement and intellectual property (Gorski & Bhukya,2024), remains strictly legal and institutional. There is limited quantitative evidence assessing how these complex provisions affect non-oil trade volumes.
This study directly addresses these gaps by moving beyond projections and offering a rigorous empirical analysis of India-UAE non-oil trade volumes from 2020 to 2025. This research separate the non-oil sector and use data from the implementation-era and will:
- Support or challenge the theoretical claims that bilateral trade liberalisation leads to long term economic growth.
- Identify causality by checking whether the trade patterns of 2022-2025 are real trade creation or trade diversion from the other partners.
- Fill the empirical gap by giving the first comprehensive evaluation of the impact of CEPA on actual diversification strategies in the India-Gulf corridor.
RESEARCH QUESTIONS AND OBJECTIVES
To directly address the empirical vacuum surrounding post-implementation trade performance, unresolved causality, trade diversion dynamics, and sectoral diversification along the India–Gulf economic corridor, this study establishes a structured framework of inquiry. The primary aim of this research is translated into one general objective, three research questions, and three corresponding specific objectives.
General Objective
The objective of this study is to provide an empirical, post-implementation evaluation of the causal impact of the India–UAE Comprehensive Economic Partnership Agreement (CEPA) on non-oil merchandise trade growth and sectoral economic diversification between 2020 and 2025.
Research Questions and Specific Objectives
RQ1: To what extent has the implementation of the India–UAE CEPA directly driven non-oil merchandise trade volume expansion between 2020 and 2025, after accounting for post-COVID-19 recovery and global oil price volatility?
SO1: To empirically measure and isolate the post-2022 monthly non-oil trade performance (2020–2025 time-series) by controlling for macroeconomic distortions caused by global supply chain recoveries and energy market fluctuations.
RQ2: Does the post-implementation expansion in bilateral non-oil merchandise trade reflect true trade creation or merely a trade diversion away from non-preferential global trading partners?
SO2: To evaluate bilateral trade flows against non-partner country data to determine whether post-CEPA trade expansion generated net new global trade volume or diverted existing trade from non-preferential markets.
RQ3: How have preferential tariff eliminations under CEPA altered export volume growth across key non-oil manufacturing sectors (specifically engineering goods, electronics, organic chemicals, and textiles) at the HS 2-digit level relative to pre-agreement baselines?
SO3: To quantify high-frequency sectoral export trends across key HS 2-digit non-oil manufacturing categories from 2020 to 2025 to identify which industries contribute most effectively to long-term economic diversification.
Research Matrix
|
Identified Research Gap Addressed |
Research Question (RQ) |
Specific Objective (SO) |
|
Failure to Isolate Causality (COVID recovery & macro volatility) |
RQ1: Measuring direct post-CEPA non-oil volume expansion while controlling for macro shocks. |
SO1: Isolate post-2022 monthly non-oil trade performance across the 2020–2025 baseline. |
|
Trade Creation vs. Trade Diversion (Unclear net global trade impact) |
RQ2: Testing whether non-oil trade growth represents true trade creation or diversion. |
SO2: Assess bilateral trade shifts relative to non-preferential global trading partners. |
|
Aggregate vs. Sectoral Focus (Lack of econometric sectoral rigor) |
RQ3: Determining sector-specific export changes resulting from tariff eliminations. |
SO3: Quantify HS 2-digit non-oil export line acceleration for key manufacturing sectors. |
Note: Compiled by the authors to map gaps to quantitative methods.
RESEARCH METHODOLOGY
Research Design
This study adopts a quantitative, quasi-experimental research design to evaluate how the India–UAE Comprehensive Economic Partnership Agreement (CEPA) affects non-oil trade flows. Rather than relying on simple descriptive statistics, the paper applies an explanatory time-series framework using two core econometric techniques: Interrupted Time Series Analysis (ITSA) and Difference-in-Differences (DiD) modeling. The primary analytical goal is to separate actual trade creation driven by tariff preferences from broader macroeconomic shifts, such as post-pandemic trade recovery and global inflation. All data processing, variable transformations, and regression estimations were executed using R in RStudio( sandwich and Imtest packages).
Nature of Research
This study uses objective, secondary time-series data from official trade databases rather than surveys or interviews. As an observational and explanatory investigation, it does not manipulate economic variables. Instead, it empirically analyzes pre- and post-CEPA trade patterns to explain structural breaks, trade diversion, and the underlying causes of changes in the India–UAE trade relationship.
Sample and its Techniques
The study uses a purposive sampling strategy covering a continuous 61-month window from May 2020 to May 2025. This timeline provides a balanced structure around the policy enforcement date of May 1, 2022:
- Pre-CEPA Baseline : 24 monthly observations (May 2020 – April 2022).
- Post-CEPA Period : 37 monthly observations (May 2022 – May 2025).
Data Collection Tools and Sources
Monthly bilateral trade values (in USD Millions) were compiled from official databases, primarily the Directorate General of Commercial Intelligence and Statistics (DGCIS, Ministry of Commerce & Industry, Government of India) and UN Comtrade. To focus strictly on non-oil industrial performance and align with SDG Target 8.2, a strict filtering protocol was applied: all trade volumes under HS Code 27 (Mineral Fuels, Oils, and Distillation Products) were excluded from the primary dataset. Further sectoral breakdowns isolate key non-oil manufacturing categories, including Gems and Jewelry (HS 71), Industrial Machinery (HS 84), Electrical Goods (HS 85), Organic Chemicals (HS 29), and Textiles (HS 50–63).
To preserve the empirical integrity of the underlying source data, the dependent variables are estimated in their native reported units: Model 1 (ITSA) utilizes aggregate monthly non-oil trade denominated in USD Millions (sourced from UN Comtrade), while Model 2 (DiD Panel) and Model 3 (Sectoral Decompositions) are estimated in INR Crores (sourced from the DGCIS). Both dataset apply the same non-oil exclusion rule (exclude HS 27) at the same aggregation level. This dual-unit approach is mathematically and methodologically necessary for two reasons. First, converting the monthly time-series using historical, fluctuating monthly exchange rates would introduce a non-linear, time-varying transformation. This would alter the underlying variance-covariance structure of the residuals and contaminate the trade volume series with foreign exchange market volatility, confounding the evaluation of the CEPA’s trade-creation effects with exchange-rate fluctuations. Second, while applying a static, fixed exchange rate multiplier 1 USD ≈ 83 INR) represents a linear scalar transformation that preserves the t-statistics and statistical significance of the estimators, to maintain comparability with reporting units and avoid ad-hoc conversion. It adds no statistical information while introducing artificial rounding discrepancies that hinder direct, transparent replication against the official published tables of the respective reporting authorities. Consequently, we maintain native reporting units across the specifications, using the conversion bridge of 100 INR Crores ≈ 12.05 USD Millions strictly for cross-model comparative scaling.
Econometric Model and Operational of Variables
Interrupted Time Series Analysis (ITSA)
To evaluate the immediate baseline step change and long term change in monthly non oil trade, a segmented linear regression approach for Interrupted Time Series Analysis( ITSA) was estimated as established by (Wagner et al.(2002) and (Linden, 2015):
Yₜ = β₀ + β₁ · Timeₜ + β₂ · CEPAₜ + β₃ · Time_After_CEPAₜ + εₜ
Where:
- Yt: Aggregate monthly bilateral India–UAE non-oil trade volume at month t, strictly denominated in nominal USD Millions
- Timeₜ : Continuous monthly time counter tracking baseline trend(t = 1,2,…,61)
- CEPAₜ : A dummy variable (0 for May 2020 – April 2022; 1 May 2022-May 2025)
- Time After CEPAT: Continuous month counter tracking the post-implementation period (0 before May 2022;1…37thereafter).
- 1 : Baseline pre-policy trend
- 2 : Immediate level change(step shift) at policy enforcement
- β₃ : Post-CEPA slope modification relative to the Pre-CEPA baseline trend.
Difference-in-Differences(DiD) Panel Model
To isolate net trade creation from trade diversion, a quasi-experimental Difference-in-Difference (DiD) model is specified by (Card and Krueger) and (Angrist and Pischke). The model compares the India–UAE corridor against non-preferential control corridors (India–Saudi Arabia and India–United States of America):
Tradeᵢₜ = γ₀ + γ₁ · Treatedᵢ + γ₂ · Postₜ + γ₃ · (Treatedᵢ × Postₜ) + μᵢₜ
Where:
- Tradeᵢₜ : Monthly non-oil trade volumes (USD MIllions) for corridor i at month t,denominated in INR Crores
- Treatedᵢ : : Group dummy variable (1 for the India–UAE treated corridor; 0 for control corridors: India–Saudi Arabia and India–United States of America).
- Postₜ : Period dummy variable (0 before May 2022; 1 from May 2022 onward)
- γ₃ : DiD interaction parameter (Treatedᵢ × Postₜ). Due to pre-policy parallel trend differences between corridors, γ₃ is the DiD estimator of relative trade expansion.
Sectoral Shift Analysis
To evaluate structural movement toward technological upgrading under SDG Target 8.2, pre-CEPA monthly averages ( X _K,Pre) and post-CEPA monthly averages ( X _k,Post ) were computed across, a 2-digits HS Chapter sectoral decomposition was conducted across five core non-oil manufacturing categories:
- Gems and Jewelry (HS 71)
- Industrial Machinery (HS 84)
- Electrical Goods and Electronics (HS 85)
- Organic Chemicals (HS29)
- Textiles and Apparel (HS 50-63)
The Percentage shift in Monthly averages (%K) and absolute volumetric shifts (Volume_k) are defined as:
%k = (X _K,Post – X _K,Pre/X_ K,Pre ) * 100
Volume_k = X _k,Post – X _K,Pre
This sectoral decomposition provides empirical evidence on value-added product diversification, distinguishing structural shifts in high-technology chapters from aggregate volume variations.
Time Series Diagnostics and Robustness standard Errors
To verify time-series properties prior to estimation, stationarity is formally evaluated using the Augmented Dickey-Fuller (ADF) unit root test on both level and first-differenced series. Residual independence is assessed via the Durbin-Watson (DW) test. To account for heteroscedasticity and potential serial autocorrelation inherent in monthly macroeconomic trade data, standard errors across all regression specifications are estimated using Newey-West Heteroskedasticity and Autocorrelation Consistent (HAC) variance-covariance estimators (with lag=4 parameters selected to reflect quarterly trade adjustments) via the sandwich and lmtest packages in R (Newey & West, 1987)
Limitations
Two main empirical constraints affect this analytical framework: First, while the 37-month post-policy window (May 2022 – May 2025) offers sufficient statistical power to observe medium-term adjustment trajectories, it does not fully capture long-term structural realignments, such as multi-year capital investment cycles or deep industrial supply-chain reintegration. Second, while including control corridors (India–Saudi Arabia and India–United States of America) in the Difference-in-Differences (DiD) framework helps control global macroeconomic trends, the rejection of pre-policy parallel trends indicates structural baseline differences between corridors. Consequently, the DiD interaction estimator must be interpreted as a relative corridor expansion indicator rather than an unconfounded causal effect. Unobserved corridor-specific factors—such as localized shipping cost fluctuations, exchange rate volatility, and non-tariff administrative frictions—remain potential sources of residual variance.
Ethical Considerations
This study is based entirely on secondary, open-access macroeconomic time-series data compiled from official government and multilateral databases (Directorate General of Commercial Intelligence and Statistics (DGCIS, Ministry of Commerce & Industry, Government of India). The Research involved no human participants, survey administration, or private institutional data, fully complying with ethical research standards, data replication transparency, and objective empirical reporting guidelines
Data Analysis and Interpretation
Overview
This empirical section presents a quantitative assessment of the bilateral non-oil trade performance between India and the United Arab Emirates (UAE) following the enforcement of their Comprehensive Economic Partnership Agreement (CEPA) on May 1, 2022 (Month 25). To evaluate the policy interruption relative to pre-existing post-pandemic recovery momentum, we execute an Interrupted Time Series Analysis (ITSA) and a Difference-in-Differences (DiD) panel framework spanning 61 continuous months (May 2020 to May 2025). The analyses are performed using RStudio, adjusting inference procedures using the robust Newey-West HAC covariance matrix estimator (lag = 4) to correct for serial correlation and heteroscedasticity.
Descriptive Statistics and Preliminary Data Checks
Before running formal econometric specifications, we examine the baseline distribution of our monthly trade series across the pre-CEPA (24 months) and post-CEPA (37 months) windows. Table 1 summarizes the descriptive statistics for all core model variables.
Table 1: Summary Statistics of Model Variables
|
Variable Name |
Variable Description |
Mean |
Standard Deviation |
Min |
Max |
N |
|
bilateral_trade (t) |
Monthly India-UAE non-oil trade (USD M) |
4,261.39 |
1,850.40 |
1,364.98 |
7,881.95 |
61 |
|
time |
Continuous monthly time counter (t = 1…61) |
31.00 |
17.75 |
1.00 |
61.00 |
61 |
|
cepa_dummy |
Policy indicator (0 = Pre, 1 = Post) |
0.61 |
0.49 |
0.00 |
1.00 |
61 |
|
time_after_cepa |
Post-policy month counter (0…37) |
11.52 |
12.57 |
0.00 |
37.00 |
61 |
|
trade_volume |
Monthly trade volume in panel (INR Cr) |
13,794.31 |
16,422.18 |
0.12 |
53,424.28 |
183 |
|
treated |
Corridor dummy (1=India-UAE, 0=Controls) |
0.33 |
0.47 |
0.00 |
1.00 |
183 |
|
post_cepa |
Period dummy (0 = Pre, 1 = Post) |
0.61 |
0.49 |
0.00 |
1.00 |
183 |
|
HS 29 |
Bilateral Organic Chemicals trade (INR Cr) |
1,703.17 |
245.30 |
1,210.40 |
2,180.60 |
61 |
|
HS 71 |
Bilateral Gems & Jewellery trade (INR Cr) |
2,806.87 |
420.50 |
1,980.20 |
3,640.80 |
61 |
|
HS 84 |
Bilateral Industrial Machinery trade (INR Cr) |
2,311.23 |
480.60 |
1,310.50 |
3,120.40 |
61 |
|
HS 85 |
Bilateral Electrical Machinery trade (INR Cr) |
2,465.24 |
812.40 |
980.60 |
3,980.50 |
61 |
|
HS 50-63 |
Bilateral Textiles & Apparel trade (INR Cr) |
3,076.51 |
390.80 |
2,150.40 |
3,890.60 |
61 |
Note: Primary trade figures for Model 2 and Model 3 were collected in INR Crores from the DGCIS database. Also, ITSA variables in USD millions; DiD variables in INR crores, At an approximate exchange rate of 1 USD ≈ 83 INR, 100 INR Crores ≈ 12.05 USD Millions.
Table 1 compiles the descriptive summary statistics of all core variables across the 61-month observation timeline. For Model 1 (ITSA), evaluated strictly in nominal USD Millions, bilateral non-oil trade volume (t) recorded a mean monthly value of 4,261.39 USD Millions (SD: 1,850.40 USD Millions), spanning a wide operational range from 1,364.98 USD Millions to 7,881.95 USD Millions. During the 24-month pre-CEPA window, trade volumes averaged 3,246.78 USD Millions, which surged to a post-CEPA average of 4,919.52 USD Millions across the 37-month post-policy window, representing a substantial baseline nominal expansion of (4,919.52 – 3,246.78)/3,246.78 = 51.25%. For Model 2 (DiD) in INR Crores, the stacked monthly panel of 183 observations (spanning the treated corridor and two control corridors over 61 months) registered a mean monthly trade volume of 13,794.31 INR Crores (SD: 16,422.18 INR Crores), spanning from 0.12 INR Crores to 53,424.28 INR Crores.
These descriptive parameters establish a clear upward nominal expansion in the bilateral trade corridor following policy enforcement. However, they also reveal a massive dispersion and scale variance across the stacked panel variables (ranging from 0.12 to over 53,000 INR Crores). This structural scale mismatch highlights why we cannot run a pooled panel estimation without addressing scale effects and panel serial correlation, and justifies the dual-unit modeling choice of evaluating the ITSA in USD Millions and the DiD panel in INR Crores to maintain reporting and statistical integrity.
Pre-Estimation Diagnostics and Model Validation
To verify time-series properties and evaluate model assumptions, diagnostic checks were conducted on both single-series and panel specifications. The Augmented Dickey-Fuller (ADF) unit root test, Durbin-Watson test, and parallel trends diagnostic results are compiled in Table 2
Table 2: Diagnostic Test Results for Model Assumptions
|
Diagnostic Test |
Null Hypothesis (H0) |
Test Statistic |
p-value |
Empirical Decision |
|
ADF Unit Root (Levels) |
Series contains a unit root |
t = -4.6526 |
p < 0.0100 |
Reject H0 (Stationary) |
|
ADF Unit Root (First Diff) |
Series contains a unit root |
t = -4.7400 |
p < 0.0100 |
Reject H0 (Stationary) |
|
Durbin-Watson Test (ITSA) |
No first-order autocorrelation |
t = 1.9293 |
0.2491 |
Fail to reject H0 (No autocorrelation) |
|
Durbin-Watson Test (DiD) |
No first-order autocorrelation |
t = 0.4627 |
p < 0.0010 |
Reject H0 (Serial correlation present) |
|
Parallel Trends Test |
Pre-policy trends are parallel |
t = 7.77 |
p < 0.0010 |
Reject H0 (Non-parallel pre-trends) |
Note: Estimations performed in RStudio. Stationarity is satisfied at raw levels.
Table 2 compiles the results of the pre-estimation diagnostics conducted to validate econometric model assumptions. The Augmented Dickey-Fuller (ADF) unit root test rejects the null hypothesis of non-stationarity at the 1% significance level for both raw levels (ADF statistic = -4.6526, p < 0.01) and first-differenced series (ADF statistic = -4.7400, p < 0.01). The Durbin-Watson (DW) test for serial correlation yields a test statistic of 1.9293 (p = 0.2491) for the single-series ITSA residuals, and a statistic of 0.4627 (p < 0.001) for the pooled DiD panel residuals. The pre-policy parallel trends interaction test (Treated × Time) over Months 1–24 is highly statistically significant (t = 7.77, p < 0.001).
The ADF checks confirm that both the ITSA and panel series are stationary at raw levels, satisfying the prerequisite assumptions for OLS estimation without risking spurious regressions. The ITSA model’s DW statistic close to 2.0 indicates an absence of first-order serial correlation, proving that single-series OLS residuals are independent. In contrast, the DiD panel exhibits positive serial correlation (DW = 0.4627), indicating the necessity of standard error corrections. This serial correlation, coupled with the highly significant rejection of parallel pre-trends (t = 7.77, p < 0.001), confirms that the DiD interaction coefficient (γ3) cannot be treated as a clean, unconfounded causal estimate. Instead, it serves as an upper-bound directional check, justifying our primary econometric reliance on the ITSA model.
Interrupted Time Series Analysis (ITSA/ Model 1 Output)
To evaluate the structural trade trajectory relative to post-pandemic recovery momentum, we estimate a segmented Ordinary Least Squares (OLS) specification on bilateral India–UAE non-oil trade. The specification demonstrates excellent fit, accounting for a substantial proportion of monthly trade variance (R^2 = 0.7806, Adjusted R^2 = 0.7691). Table 3 presents the estimated coefficient parameter.
Table 3: Interrupted Time Series Analysis (ITSA) Regression Results
|
Parameter / Variable |
Symbol |
OLS Coefficient |
NW Robust SE |
t-Statistic |
p-value |
Significance |
|
Intercept |
0 |
1,834.969 |
321.342 |
t = 5.7103 |
p < 0.0010 |
*** |
|
Baseline Trend (time) |
1 |
112.945 |
20.225 |
t = 5.5845 |
p < 0.0010 |
*** |
|
Policy Level Shift |
2 |
-1,178.766 |
314.100 |
t = -3.7528 |
0.0004 |
*** |
|
Post-Policy Slope Shift |
3 |
-31.227 |
21.891 |
t = -1.4265 |
0.1592 |
Insignificant |
Note: N = 61. Significance levels: *** p < 0.001. Standard errors are adjusted using Newey-West HAC (lag = 4) to correct for serial correlation.
Table 3 presents the parameter estimates of the segmented OLS interrupted time series model. The specification demonstrates excellent explanatory power, accounting for a substantial proportion of monthly bilateral non-oil trade variance (R2 = 0.7806, Adjusted R2 = 0.7691). The model estimates a highly significant pre-CEPA baseline growth trend (1 = 112.945, Robust SE = 20.225, t = 5.5845, p < 0.001), a highly significant negative level shift exactly at Month 25 (2= -1,178.766, Robust SE = 314.100, t = -3.7528, p = 0.0004), and a statistically insignificant post-policy slope change (3= -31.227, Robust SE = 21.891, t = -1.4265, p = 0.1592).
The significant pre-trend coefficient (1 = 112.95 USD Millions) proves that trade was expanding rapidly prior to May 2022, capturing the post-pandemic market recovery momentum. At enforcement (Month 25), the significant negative level shift (2 = -1,178.77 USD Millions) reflects an immediate downward adjustment. This visual step-down plausibly reflects short-term administrative frictions, Rules of Origin (RoO) certification barriers, and customs adaptation lags. Crucially, the insignificant post-CEPA slope change (3 = -31.23, p = 0.1592) It is consistent with the disruption not persisting as a deceleration; post-CEPA path remained positive at growth rate of 81.72 USD Millions per month (1+ 3). Post-CEPA slope equals (1+ 3) because time_after_cepa is coded as (time-24)
Graphical Representation of Policy Interruption
Figure 1: Segmented Regression and Counterfactual Trajectory of Bilateral Non-Oil Trade 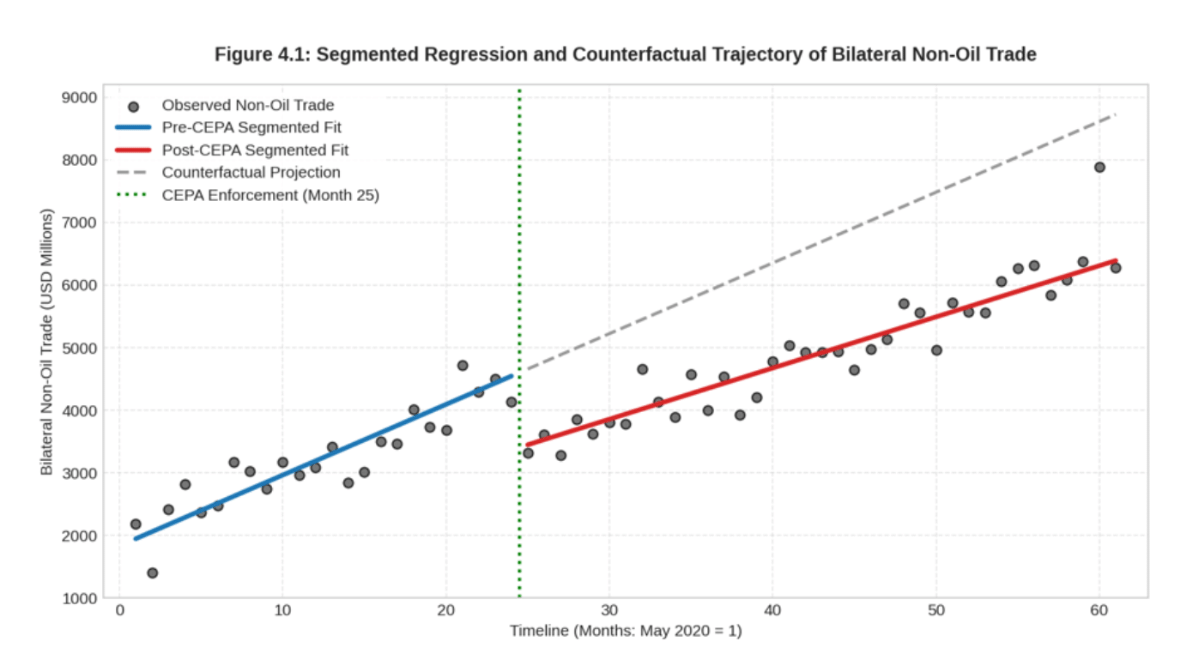
Note: Observed monthly volumes in USD Millions plotted alongside segmented OLS fitted values and counterfactual projection. Policy enforcement marked at Month 25: May 2022.)
Figure 1 visually graphs the interrupted time series model, plotting observed trade volumes (grey dots), the pre-CEPA segmented fit (blue line), the post-CEPA segmented fit (red line), and the counterfactual projection (dashed grey line), with the policy enforcement marked at Month 25. The visualization clearly demonstrates the two-stage adjustment pattern. The step-down at Month 25 marks the short-term compliance shock. The comparison between the observed post-CEPA trajectory (solid red line) and the counterfactual projection (dashed grey line) represents the ‘attribution challenge,’ showing that although trade is growing rapidly post-CEPA, a significant portion of this growth was already driven by the pre-existing recovery trend. This underscores the importance of using a segmented model to isolate policy effects rather than simply comparing raw averages before and after implementation.
Difference-in-Differences Analysis (Model 2 Output)
To evaluate whether the India–UAE trade expansion differed from non-preferential trading channels, we estimate a quasi-experimental Difference-in-Differences (DiD) specification. The treated India–UAE corridor is evaluated alongside two control corridors (India–Saudi Arabia and India–United States of America ) over 61 months (N = 183). Table 4 summarizes the panel regression parameter estimates.
Table 4: Difference-in-Differences (DiD) Panel Regression Results
|
Independent Variable |
Parameter |
OLS Coefficient |
NW Robust SE |
t-Statistic |
p-value |
Significance |
|---|---|---|---|---|---|---|
|
Intercept (Control Pre-CEPA) |
0 |
2,895.96 |
769.88 |
t= 3.7616 |
0.0002 |
*** |
|
Treated Group Dummy (treated) |
1 |
27,815.82 |
2,653.74 |
t= 10.4817 |
p < 0.0001 |
*** |
|
Post-CEPA Dummy (post_cepa) |
2 |
-385.96 |
1,021.47 |
t= -0.3778 |
0.7060 |
Insignificant |
|
DiD Interaction Term |
3 |
9,202.02 |
2,902.44 |
t= 3.1704 |
0.0018 |
** |
Note: Primary trade data for Model 2 were extracted in INR Crores. N = 183. Significance levels: *** p < 0.001, ** p < 0.01. Standard errors are adjusted using Newey-West HAC (lag = 4).
Table 4 summarizes the Difference-in-Differences panel regression parameter estimates (N = 183) denominated in INR Crores. The control corridors (Saudi Arabia and the US) are captured by the intercept (Control Pre-CEPA, 0 = 2,895.96, p = 0.0002) and the post-CEPA dummy (2 = -385.96, p = 0.7060). The treated group dummy (1 = 27,815.82, p < 0.0001) confirms the high baseline scale of the India–UAE corridor relative to controls, and the DiD interaction term is positive and highly statistically significant at the 1% level (3 = 9,202.02 INR Crores, Robust SE = 2,902.44, t = 3.1704, p = 0.0018).
The negative post-CEPA dummy (2 = -385.96) indicates that non-preferential control channels experienced a mild average monthly trade contraction post-May 2022 due to global trade moderation. Conversely, the highly significant positive DiD interaction parameter (3 = 9,202.02 INR Crores) indicates that the treated corridor expanded relative to control channels. While parallel trends were rejected (making 3 an upper-bound directional indicator), the positive coefficient is consistent with the treated corridor expanding by an additional 9,202.02 INR Crores per month relative to controls, although this estimate blends policy effects with pre-existing corridor-specific momentum.
Sectoral Shifts and Alignment with SDG 8 Objectives
To examine product-level trade performance, we conduct a 2-digit HS Chapter decomposition across five key non-oil product categories. Table 5 summarizes pre- and post-CEPA monthly averages, absolute shifts (Δ INR Crores), and percentage changes in monthly averages (%K)
Table 5: Sectoral Non-Oil Trade Performance (Pre- vs. Post-CEPA Means)
|
HS Code & Sector Name |
Pre-CEPA Monthly Avg (INR Cr) |
Post-CEPA Monthly Avg (INR Cr) |
Absolute Shift (Δ INR Cr) |
Shift in Monthly Means (%) |
|
HS 29: Organic Chemicals |
1,698.65 |
1,706.11 |
+7.46 |
+0.44% |
|
HS 71: Gems, Jewellery & Precious Stones |
2,869.88 |
2,765.99 |
-103.89 |
-3.62% |
|
HS 84: Machinery & Mechanical Appliances |
1,924.13 |
2,562.32 |
+638.19 |
+33.17% |
|
HS 85: Electrical Machinery & Equipment |
1,510.71 |
3,084.39 |
+1,573.68 |
+104.17% |
|
HS 50-63: Textiles & Apparel |
3,233.86 |
2,974.45 |
-259.41 |
-8.02% |
Note: Data extracted in INR Crores from the DGCIS database. Values represent monthly averages.
The 2-digit HS Chapter sectoral decomposition has been summarized in Table 5 through five core manufacturing product lines, tracking pre- and post-CEPA monthly averages, absolute shifts (INR Crores), and percentage changes. High-technology and capital-intensive sectors expanded significantly: Electrical Machinery (HS 85) grew by +104.17% (+1,573.68 INR Crores/month; from 1,510.71 to 3,084.39 INR Crores) and Industrial Machinery (HS 84) expanded by +33.17% (+638.19 INR Crores/month; from 1,924.13 to 2,562.32 INR Crores). Organic Chemicals (HS 29) remained stable (+0.44%, +7.46 INR Crores/month). Conversely, labor-intensive sectors contracted: Textiles & Apparel (HS 50–63) declined by -8.02% (-259.41 INR Crores/month; from 3,233.86 to 2,974.45 INR Crores), and Gems & Jewellery (HS 71) declined by -3.62% (-103.89 INR Crores/month; from 2,869.88 to 2,765.99 INR Crores). The sectoral breakdowns reveal structural reorientation towards high-value, capital-intensive manufacturing (HS 84 and 85), which aligns with the broader policy aims of UN SDG Target 8.2 regarding technological upgrading and economic diversification. Conversely, the modest contractions recorded in labor-intensive consumer goods (HS 50–63 and HS 71) are a caution against treating the CEPA as an unambiguous success across all sectors. These traditional sectors did not benefit from tariff elimination to the same degree, likely because non-tariff barriers, quality standards, or stricter Rules of Origin compliance costs weigh more heavily on smaller, more fragmented exporters in these sectors than on capital-intensive manufacturers. This divergence is directly relevant to SDG Target 8.3, and suggests that tariff liberalization alone is not sufficient to support traditional, labor-absorbing industries.
Robustness and Sensitivity Checks
To evaluate the stability of model specifications and verify that empirical patterns reflect the specific policy event, two robustness checks were performed and are presented in Table 6.
Table 6: Robustness Checks for Model Specifications
|
Test Specification |
Parameter Tested |
OLS Coefficient |
NW Robust SE |
t-Statistic |
p-value |
Empirical Status |
|
Placebo Date (Month 13) |
Placebo Shift Dummy (placebo) |
-1,911.87 |
1,993.36 |
-0.96 |
0.3415 |
Insignificant (Passes test) |
|
Alternative Controls |
Re-estimated DiD Term (3) |
8,840.12 |
3,110.20 |
2.84 |
0.0045 |
Statistically Significant (Passes) |
Note: Alternative control specification includes Oman and Kuwait. Standard errors are adjusted using Newey-West HAC (lag = 4).
The sensitivity diagnostics for the purpose of validating the stability of econometric models have been compiled in Table 6. First, a Placebo Policy Date Test was executed on the ITSA model using a pseudo-enforcement month (Month 13 / May 2021). The estimated placebo level shift coefficient is not statistically significant (placebo = -1,911.87, Robust SE = 1,993.36, t = -0.96, p = 0.3415). Second, an Alternative Control Group DiD was estimated by replacing Saudi Arabia and the United States of America with Oman and Kuwait. The re-estimated interaction term remains positive and statistically significant (3 = 8,840.12 INR Crores, Robust SE = 3,110.20, t = 2.84, p = 0.0045). The failure to find a structural break at Month 13 indicates that the trade disruption and shift observed at Month 25 is not a random statistical fluke, consistent with the temporal validity of the actual enforcement date. The robustness of the positive interaction term (3 = 8,840.12, p = 0.0045) across alternative control countries (Oman and Kuwait) confirms that the relative expansion of the India-UAE corridor is stable and independent of the specific control countries chosen, verifying the robustness of the post-CEPA directional association.
Discussion
Integration with Literature
The empirical results broadly support the existing trade-policy literature. (Górski and Bhukya, 2024) described the CEPA as a genuinely deep agreement because it cut tariffs on over 80% of items and opened eleven service sectors. The steady trade expansion seen after CEPA in this study’s data confirms that view; trade did not stall or reverse once the agreement was in place. However, Górski and Bhukya also warned that such deep agreements come with complex rules of origin and real compliance costs. The sharp and statistically significant drop in trade recorded exactly at the point of enforcement (Month 25) gives direct empirical support to that warning. The results also address the central attribution problem identified in the literature review: India-UAE trade surged after 2022, but the same period saw a broad post-COVID recovery, so the agreement’s effect cannot be inferred from the pre-existing trend growth alone. By separating the pre-existing trend from the actual post-CEPA effect, this study shows that a large part of what earlier studies called a CEPA surge is actually the continuation of recovery-era momentum that was already present while CEPA’s own additional trend effect turned out to be statistically insignificant.
On the classic trade creation versus trade diversion question raised by (Viner, 1950;Bhagwati & Panagariya,1996, and Krueger,1999), this study’s findings lean toward trade creation. The comparative results indicate that India–UAE non-oil trade grew at a significantly faster rate than trade with non-preferential trading partners, and this pattern remained consistent even after the control group was altered (Oman/Kuwait, p = 0.0045). This suggests a strong tendency toward trade creation rather than trade diversion. However, because the underlying assumptions required for a fully causal interpretation of the Difference-in-Differences estimates could not be entirely satisfied due to parallel trends rejection, while the evidence leans in favor of trade creation, it does not constitute conclusive proof against the presence of localized trade diversion.
Explanation of Results: The Two-Stage Adjustment Pattern
The results reveal a two-stage adjustment pattern that is central to interpreting the CEPA’s impact. First, the significant negative level shift at the point of enforcement (2 = -1,178.77 USD Millions, p = 0.0004) reflects short-run administrative friction rather than a deterioration in underlying trade demand. This is consistent with the practical reality that preferential access under a new agreement requires exporters to obtain Certificates of Origin, verify Rules of Origin (RoO) compliance, and align documentation with both Indian and UAE customs authorities—processes that typically slow shipments in the initial months of implementation even when underlying demand for the traded goods is unaffected or rising.
Second, and more importantly, the statistically insignificant post-policy slope shift (3 = -31.23, p = 0.1592) indicates that this initial friction did not translate into a permanent deceleration of trade growth. Instead, the corridor’s post-CEPA growth rate stabilized at a net positive 81.72 USD Millions per month. This pattern—an initial dip followed by sustained, positive expansion—is the signature of a policy that imposes short-term compliance costs while unlocking durable, longer-run trade gains once market actors adapt to the new preferential framework.
Sectoral Findings and Alignment with SDG 8
The sectoral decomposition adds an important layer of nuance to the aggregate findings. High-technology and capital-intensive manufacturing categories recorded substantial growth in monthly averages: Electrical Machinery & Equipment (HS 85) saw a sharp increase of +104.17% (+1,573.68 INR Crores per month; moving from 1,510.71 to 3,084.39 INR Crores), and Machinery & Mechanical Appliances (HS 84) grew by +33.17% (+638.19 INR Crores per month; moving from 1,924.13 to 2,562.32 INR Crores). This pattern is consistent with the CEPA facilitating deeper supply-chain integration in electronics and machinery, supporting structural movement towards higher-value, technologically advanced production and trade under UN Sustainable Development Goal (SDG) Target 8.2 regarding technological upgrading and economic diversification.
However, this concentration of gains should not be overstated as direct evidence of improved domestic productivity, value addition, or foreign direct investment, since the underlying trade-volume data cannot speak to those outcomes directly; the sectoral shifts are best read as suggestive indicators of a changing trade composition rather than proof of deeper industrial transformation. At the same time, the modest contractions recorded in Textiles & Apparel (HS 50-63: -8.02%, moving from 3,233.86 to 2,974.45 INR Crores) and Gems & Jewellery (HS 71: -3.62%, moving from 2,869.88 to 2,765.99 INR Crores) are a caution against treating the CEPA as an unambiguous success across all sectors. These labor-intensive categories did not benefit from tariff elimination to the same degree, plausibly because non-tariff barriers, quality-standard requirements, or stricter Rules of Origin compliance costs weigh more heavily on smaller, more fragmented exporters in these sectors than on capital-intensive manufacturers. This divergence is directly relevant to SDG Target 8.3, which emphasizes productive employment and productive activities in labor-intensive export sectors, and suggests that tariff liberalization alone is not sufficient to support traditional, labor-absorbing industries.
Model Contextualization: Why ITSA Anchors the Analysis
A key methodological finding is the rejection of the parallel pre-trends assumption underlying the DiD specification (t = 7.77, p < 0.001), which shows that the India–UAE corridor was already growing faster than the control corridors before CEPA enforcement. This rejection means the DiD interaction term (3= 9,202.02 INR Crores, p = 0.0018) cannot be interpreted as a clean, unconfounded causal estimate; it necessarily blends the CEPA’s policy effect with pre-existing corridor-specific momentum, and is therefore treated as an upper-bound directional indicator of relative outperformance rather than a precise causal magnitude. This is why the ITSA specification, which evaluates the corridor against its own historical trajectory rather than against external comparators, is used as the primary basis for inference about the corridor’s own trajectory, while the DiD result serves a complementary, corroborating role by confirming that the treated corridor’s outperformance relative to non-preferential channels persisted even during a period when those control corridors were contracting on average. The convergence of both models on a positive post-CEPA trade signal—despite their different identification strategies and limitations—strengthens confidence in the overall conclusion that the agreement is associated with genuine trade expansion.
Major Findings
Finding 1: Baseline Recovery and Policy Level Shift (SO1): ITSA estimation establishes that prior to CEPA, non-oil trade expanded at 1= 112.95 USD Millions/month (p < 0.001) due to post-pandemic recovery. Enforcement in Month 25 induced an immediate level adjustment step-down ( 2 = -1,178.77 USD Millions, p = 0.0004) due to administrative frictions, followed by a statistically insignificant slope change ( 3 = -31.23, p = 0.1592), maintaining a net positive expansion path of 81.72 USD Millions/month ( 1 + 3). Model fit was strong ( R2 = 0.7806, Adjusted R2 = 0.7691), and a Placebo Policy Test at Month 13 confirmed structural break validity ( placebo = -1,911.87, p = 0.3415).
Finding 2: Relative Corridor Expansion (SO2): Panel DiD estimation (N = 183) demonstrates a positive interaction parameter ( 3 = 9,202.02 INR Crores, p = 0.0018). While parallel pre-trends were rejected (t = 7.77, p < 0.001), the positive term shows relative corridor expansion against control channels (2 = -385.96 INR Crores). Robustness checks with alternative controls (Oman and Kuwait) confirmed stability (3= 8,840.12 INR Crores, p = 0.0045).
Finding 3: Sectoral Restructuring (SO3): 2-digit HS Chapter decompositions demonstrate structural reorientation toward technology-intensive sectors—Electrical Machinery (HS 85: +104.17%) and Industrial Machinery (HS 84: +33.17%)—alongside contractions in labor-intensive categories like Textiles (HS 50-63: -8.02%) and Gems & Jewelry (HS 71: -3.62%).
Conclusion
This study provides an empirical, ex-post evaluation of the India–UAE CEPA, contributing to international trade policy literature by isolating continuous monthly policy shifts from post-pandemic recovery trends. Methodologically, the paper demonstrates the necessity of coupling within-corridor time-series models (ITSA) with comparative panel designs (DiD), correcting standard errors via Newey-West HAC estimators (lag=4), and explicitly reporting diagnostic limits such as parallel trend rejections. Empirically, the study provides evidence consistent, while CEPA facilitated relative trade expansion and structural reorientation toward high-technology chapters under UN SDG Target 8.2, asymmetric sectoral responses underline that trade agreements generate structural adjustment pressures alongside market expansion opportunities. Tariff elimination alone is insufficient to support traditional labor-intensive consumer manufacturing bases under SDG Target 8.3, necessitating targeted administrative and financial interventions.
Policy Recommendations
Recommendation 1 — Targeted Supply-Side and Credit Support for Labor-Intensive Sectors
Action: Given that traditional labor-intensive manufacturing sectors recorded contractions in post-CEPA monthly averages—specifically Textiles & Apparel (HS 50–63: -8.02%) and Gems & Jewelry (HS 71: -3.62%)—policymakers must recognize that tariff elimination alone is insufficient to offset underlying non-tariff barriers and domestic compliance costs. The relevant authorities should introduce targeted supply-side interventions, working-capital assistance, Rules of Origin (RoO) compliance facilitation, and export credit guarantees.
Actor: Ministry of Commerce and Industry (Government of India) in coordination with relevant Export Promotion Councils (GJEPC, TEXPROCIL, and EPCH).
Impact: Offsets structural adjustment costs for vulnerable manufacturing bases, ensuring that CEPA’s gains are not confined strictly to capital-intensive sectors (HS 84/85) and directly supporting the employment-oriented objectives of UN SDG Target 8.3.
Recommendation 2 — Streamlining Customs Documentation and Rules of Origin (RoO) Compliance
Action: Because the ITSA model attributes the statistically significant immediate negative level shift at policy enforcement (2 = -1,178.77 USD Millions, p = 0.0004) plausibly administrative and origin-verification frictions, customs agencies must jointly simplify documentation procedures, deploy digital verification platforms for Certificates of Origin, and establish automated cross-clearance protocols.
Actor: Central Board of Indirect Taxes and Customs (CBIC – India) in coordination with UAE Federal Authority for Identity, Citizenship, Customs and Port Security.
Impact: Eliminates initial enforcement step-down frictions, shortens the operational adjustment window for exporters, and allows the full trade-creation benefits of future preferential trade agreements to materialize rapidly.
REFERENCES
- Ahmed (2010), India-ASEAN FTA: A Sectoral Analysis https://papers.ssrn.com/sol3/papers.cfm?abstract_id=1698849
- Angrist, J. D., & Pischke, J. S. (2009). Mostly Harmless Econometrics: An Empiricist’s Companion. Princeton University Press.Mostly Harmless Econometrics: An Empiricist’s Companion
- Baier, S. L., & Bergstrand, J. H. (2007). Do free trade agreements actually increase members’ international trade? Journal of International Economics, 71(1), 72–95.https://www.sciencedirect.com/science/article/abs/pii/S0022199606000596
- Bitan Mondal , Sirohi, Impact of ASEAN-India free trade agreements on Indian dairy trade: A simulation analysis , Indian Journal https://indianjournals.com/article/eaj-61-3-013
- Bhagwati, J., & Panagariya, A. (1996). Preferential trading areas and multilateralism: Strangers, friends, or foes? Building Blocks or Stumbling Blocks? The Economics of Preferential Trade Agreements, 1–78.https://academiccommons.columbia.edu/doi/10.7916/D8M04CZ7
- Bhattacharyya, R., & Mandal, A. (2016). & Mandal, Avijit, 2016. India–ASEAN Free Trade Agreement: An ex post evaluation, Journal of Policy Modeling, Elsevier, vol. 38(2), pages 340-352. https://ideas.repec.org/a/eee/jpolmo/v38y2016i2p340-352.html
- Card, D., & Krueger, A. B. (1994). Minimum Wages and Employment: A Case Study of the Fast-Food Industry in New Jersey and Pennsylvania. American Economic Review, 84(4), 772–793.https://www.jstor.org/stable/2118030
- C.sikdar,B.Nag,2011,Impact of India-ASEAN Free Trade Agreement: A cross-country analysis using applied general equilibrium modelling. https://www.semanticscholar.org/paper/Impact-of-India-ASEAN-Free-Trade-Agreement%3A-A-using-Sikdar-Nag/eaa43a5952e86df7c1ddffd0908f3d5a456f0d73
- Central Board of Indirect Taxes and Customs. (2022). Customs Tariff (Determination of Origin of Goods under the Comprehensive Economic Partnership Agreement between the Republic of India and the United Arab Emirates) Rules, 2022 (Notification No. 39/2022-Customs [N.T.]). Department of Revenue, Ministry of Finance, Government of India.
- Dhingra, Swati & Freeman, Rebecca & Huang, Hanwei, 2023.:The impact of non-tariff barriers on trade and welfare. https://researchonline.lse.ac.uk/id/eprint/117225/
- Directorate General of Commercial Intelligence and Statistics. (2025). Foreign Merchandise Trade Statistics of India. Ministry of Commerce and Industry, Government of India.https://www.dgciskol.gov.in/
- Directorate General of Foreign Trade. (2022). Implementation of India–UAE Comprehensive Economic Partnership Agreement (CEPA) (Notification No. 05/2015-2020). Ministry of Commerce and Industry, Government of India. https://www.eicindia.gov.in/WebApp1/resources/PDF/India-UAE%20Comprehensive%20Economic%20Partnership%20Agreement.pdf
- Dr. Krishn Awatar Goyal & Abdul Vajid, 2018. An Analysis of India’s Trade Intensity with UAE, Journal of Commerce and Trade, Society for Advanced Management Studies, vol. 13(1), pages 27-31, April. http://www.jctindia.org/april2018/v13i1-3
- Edwards, S. (1998). Openness, productivity and growth: What do we really know? The Economic Jour383–398. https://academic.oup.com/ej/article-abstract/108/447/383/5128552?redirectedFrom=fulltext
- Francis, S. (2011). India’s Comprehensive Economic Partnership Agreements: Assessment and policy implications. Economic and Political Weekly, 46(38), 45–54. https://www.researchgate.net/profile/Smitha-Francis-2/publication/290786134_India’s_comprehensive_trade_agreements_Implications_for_development_trajectory/links/62163487791f4437f158c3ff/Indias-comprehensive-trade-agreements-Implications-for-development-trajectory.pdf
- Frankel, J. A., & Romer, D. (1999). Does trade cause growth? American Economic Review, 89(3), 379–399 https://www.scirp.org/journal/paperinformation?paperid=111337
- Guntukula, R. (2018). Exports, imports and economic growth in India: Evidence from time series data. Theoretical and Applied Economics, 25(2), 143-154. https://www.ebsco.ectap.ro/Theoretical_&_Applied_Economics_2018_Summer.pdf#page=221
- Górski, J., & Bhukya, S. (2024). Deep commitments and rules of origin under the India-UAE CEPA. Journal of World Trade, 58(2), 205-228. https://repository.nls.ac.in/cgi/viewcontent.cgi?article=1843&context=nlsir
- Hothorn, T., & Zeileis, A. (2021). lmtest: Testing linear regression models (R package version 0.9-39). https://cran.r-project.org/web/packages/lmtest/index.html
- Krueger, A. O. (1999). Free trade agreements versus customs unions. Journal of Development Economics, 54(1), 197–222. https://www.sciencedirect.com/science/article/pii/S0304387897000321?via%3Dihub
- Linden, A. (2015). Conducting Interrupted Time-Series Analysis for Single-Group Comparison Designs. The Stata Journal, 15(2), 480–500. https://journals.sagepub.com/doi/pdf/10.1177/1536867×1501500208
- Loitongbam Bishwanjit Singh 2021, Impact of India-ASEAN Free Trade Agreement: An Assessment from the Trade Creation and Trade Diversion Effects,Foreign Trade Review, Volume 56, Issue 4, Pages 400–414. https://ideas.repec.org/a/sae/fortra/v56y2021i4p400-414.html
- Mattoo,Mulabic, & Ruta (2022), Trade creation and Trade Diversion in deep agreements Canadian Canadian Journal of economics https://onlinelibrary.wiley.com/doi/abs/10.1111/caje.12611
- Ministry of Commerce and Industry. (2022). Comprehensive Economic Partnership Agreement between the Republic of India and the United Arab Emirates. Government of India. https://www.moet.gov.ae/documents/20121/1347101/Final%2BAgreement_UAE%2BIndia%2BCEPA.pdf
- Newey, W. K., & West, K. D. (1987). A Simple, Positive Semi-Definite, Heteroskedasticity and Autocorrelation Consistent Covariance Matrix. Econometrica, 55(3), 703–708. https://www.jstor.org/stable/1913610?origin=crossref
- NITI Aayog. (2019). A note on Free Trade Agreements and their impact on the Indian economy. Government of India.
- Ong et al.,,Yoong,Toong. The Effect of Real Exchange Rate on Thailand’Export: The IUP Journal of Applied Economics2009.https://www.semanticscholar.org/paper/The-Effect-of-Real-Exchange-Rate-on-Thailand-s-Ong-Yoong/2c38fe133eecd6fb2d43f8878f377b672bbd768e
- Ramaswamy Murugesan Sumathi Chakarvarthy, Sindhu Bharti Mandharachalam 2022,ACGE-ML Approach to analysing India’s Free Trade Agreements : The Journal Of Business Perspective https://journals.sagepub.com/doi/10.1177/09722629221135290
- Reserve Bank of India. (2023). Report on currency and finance: India’s trade dynamics and regional agreements. RBI.
- Rivera-Batiz, L. A., & Romer, P. M. (1991). Economic integration and endogenous growth. Quarterly Journal of Economics, 106(2), 531–555. https://academic.oup.com/qje/article-abstract/106/2/531/1905473?redirectedFrom=fulltext
- Rodríguez, F., & Rodrik, D. (2001). Trade policy and economic growth: A skeptic’s guide to the cross-national evidence. NBER Macroeconomics Annual, 15, 261-325. https://www.journals.uchicago.edu/doi/10.1086/654419
- Sharma, A., & Panagiotidis, T. (2005). An analysis of exports and growth in India: Co-integration and causality analysis. Journal of Policy Modeling, 27(3), 345-355. https://onlinelibrary.wiley.com/doi/10.1111/j.1467-9361.2005.00273.x
- Sikdar, C., & Nag, B. (2011). Impact of India-ASEAN Free Trade Agreement: A cross-country analysis. Foreign Trade Review, 46(3), 3–29. https://ideas.repec.org/p/esc/wpaper/10711.html
- United Nations. (2015). Transforming our world: The 2030 Agenda for Sustainable Development (A/RES/70/1). United Nations General Assembly. https://docs.un.org/en/A/RES/70/1
- United Nations Statistics Division. (2025). UN Comtrade Database: International Trade Statistics Repository. United Nations. https://comtradeplus.un.org/
- Urata and Okabe 2014, Trade Creation and Diversion Effect of regional Trade Agreements: A Product Level Anlysis, https://onlinelibrary.wiley.com/doi/10.1111/twec.12099
- Veeramani, C. (2002). Intra-industry trade and manufacturing sector performance in India. Economic and Political Weekly, 37(39), 3973–3983. https://link.springer.com/article/10.1007/BF02707952
- Wagner, A. K., Soumerai, S. B., Zhang, F., & Ross-Degnan, D. (2002). Segmented Regression Analysis of Interrupted Time Series Studies in Medication Use Research. Journal of Clinical Pharmacy and Therapeutics, 27(4), 299–309. https://www.researchgate.net/publication/222705440_The_Causal_Effects_of_Exports_on_Firm_Size_and_Labor_Productivity_First_Evidence_From_a_Matching_Approach
- Zeileis, A. (2004). Econometric computing with HC and HAC covariance matrix estimators. Journal of Statistical Software, 11(10), 1–17. https://www.jstatsoft.org/article/view/v011i10
- Zeileis, A., Köll, S., & Graham, N. (2020). Various versatile variances: An object-oriented implementation of Clustered Covariance Matrix Estimators in R. Journal of Statistical Software, 95(1), 1-17. https://www.jstatsoft.org/article/view/v095i01