Authors: Krishnan Anicode , Lakshya Vohra , Khushboo Garg , Sakshi Mishra
Introduction
India’s aspirations to become a knowledge- based economy rests on the shoulders of schooling system in India. However, the education system has unfortunately repeatedly fallen short of its expectations. Six decades, after its independence, India has not come close to meeting its expectations in terms of both education output and input. Combined centre-state expenditure has oscillated between 2.6 and 3.1 per cent of GDP, making India the lowest public spender on education among the BRICS and only comparatively higher to Angola. Why has a democracy with constitutional commitments to education, a large and growing youth population, and sustained economic growth for over two decades, consistently failed to honour even a sixty-year-old fiscal benchmark? This research argues that India’s education financing challenge is threefold in character. The first is chronic underinvestment. The second dimension is distributional inequity: The third is 1 utilisation failure: fund utilisation under the Department of School Education and Literacy fell to a nadir of 83 per cent of Budget Estimates in 2014–15. Understanding how these three dimensions interact with persistently weak learning outcomes is the central question of this research. India’s constitutional framework adds a distinctive complexity. Education falls on the Concurrent List, yet states bear approximately 85 per cent of total public education expenditure despite widely varying fiscal capacities. The Centre’s share has risen from 12 per cent in 2000–01 to 24 per cent by 2015.
If allocation is determined by administrative and political convenience rather than educational necessity, can increasing the volume of central transfers reduce inter- state inequality or will it simply reproduce existing disparities at a larger scale? The consequences of this threefold failure are visible in outcomes that have remained weak despite rising investment. ASER (2024) records that only 27.1 per cent of Standard III children nationally could read a Standard II-level text, and government school students have 2 historically lagged private school students by approximately 20 percentage points in reading proficiency even where per-student government expenditure is comparable. If students associate higher public investment with better access and learning conditions, but experience pedagogical failure as a more immediate barrier, what does this imply about the sequencing of reform and is more funding sufficient without simultaneous governance and curriculum transformation?
There is a need of simultaneous examination of the quantum of investment, the equity of its inter-state distribution, and the efficiency of its 3 scheme-level utilization — triangulated with primary evidence of how these failures manifest in student experience. This research addresses that gap, pursuing three objectives: first, to document and analyse the structural causes of the persistent gap between the 6 per cent GDP benchmark and actual spending; second, to examine inter-state disparities in allocation and assess whether intergovernmental transfers have corrected or perpetuated them; and third, to analyse the allocation-utilisation gap in major education schemes and connect macro-level financing failures to their micro-level consequences for educational quality, digital access, and equity of opportunity. The study draws on secondary data from governmental, intergovernmental, and intragovernmental sources, supplemented by primary survey data and unstructured interviews conducted among the student fraternity, to construct a multidimensional account of India’s education financing challenge that is analytically richer, and more policy-actionable, than any single-dimensional treatment.
Abstract
Education is one of the most important pillars of our country’s future yet it’s expenditure is not incurred as provided in the budget neither India follows the benchmark of 6% of GDP to public education given by Kothari Commission in 1964-66. The study aimed to investigate the possible reasons of gap between the education budget and expenditure in India and the problems faced by the education system as chronic underinvestment, distributional inequity and utilisation failure. We followed a mix of both qualitative and quantitative methods for our study including the primary and secondary data. We collected the primary data through unstructured interviews, surveys and secondary data through various official government, statistical reports and comparative analysis of various states/countries. The survey states that India’s education challenge is not only limited to spending level but also due to quality and equity of resources. Respondents highlight the importance of skill-based learning, practical learning, better infrastructure and digital resources to improve the results. The study concludes that reducing India’s education budget financing gap requires not only increased budget allocation but also equitable distribution, improved fund utilisation and reformed governance.
Keywords: Education financing, public expenditure, budget allocation, India, GDP, inter-state disparity, fund utilisation, learning outcomes.
`
Literature Review
The study on financing and public expenditure in education in India has its origins in the recommendations of the Kothari Commission (1964–66), which was an ad hoc committee. It proposed that public expenditure on education should gradually be increased to 6 per cent of GDP.
However, the challenges before India is not merely one of increasing expenditure, but of ensuring equitable allocation and efficient utilization. In the last few years, the research has gradually transformed from examining the education spending to determining how federal institutions determine and influence financial allocation.
Umendra Singh (2019) provides a detailed assessment of India’s educational financing from the early 2000s to 2018–19. The study shows that public expenditure on education increased from around 2.6 per cent of GDP in 2007 to approximately 2.9 per cent in 2016, making India one of the lowest public spenders on education among the BRICS countries. Singh further highlights considerable interstate disparities in educational spending. The per student expenditure in Uttar Pradesh ranges from around Rs. 7500/- to even around Rs. 15000/- in Chattisgarh. The study argues that inadequate public investment and the uneven allocation between the states has contributed significantly to disparities in educational infrastructure and learning opportunities among students of different states
While Singh primarily examined the public expenditure, Jhingran and Sankar (2015) through their paper shift attention towards the allocation of educational resources within the federal system. Their analysis of the Sarva Shiksha Abhiyan (SSA) demonstrates that fund allocation depended on administrative structure rather than on educational needs. Similarly, centre-state conflict too has hampered budget allocation to states for education. PM-Shri Yojana was designed to benefit by developing over 14,000 schools. However, refusal of states like Kerala, Odisha or Tamil Nadu to come on board with the scheme resulted in the Union Government halting the Samagra Shiksha Funds (to the tune of Rs.1,158 crore).
The federal character of education further complicates public expenditure. As, Anuradha De and Tanuka Endow through their paper ‘Public Expenditure on Education in India (2008)’ analysed the expenditure pattern; they have observed a major shift in priorities with special focus on elementary education; with approximate share of 50%.
Existing literatures also observe that while the Union Government formulates national policies and centrally sponsored schemes, states undertake the actual implementation. Consequently, educational outcomes depend not only on central allocations but also on the fiscal capacity and administrative efficiency of individual states. Most publicly available budget analyses, including those published by PRS Legislative Research, focus primarily on Union Government expenditure, with little focus on the state wise or district wise expenditure.
Research has also increasingly focused on the utilisation of allocated funds rather than allocation alone. Pravesh Tamang (2011) observes that 1% increase in government expenditure on education per labour will lead to 0.11% increase in GDP per labour. Dutta (2017) makes the point that rising public investment in education does not, by itself, translate into improved outcomes. The Centre for Budget and Governance Accountability (2018) notes that a sizeable share of allocated education funds tends to go unspent, largely delays in fund release and the administrative bottlenecks, and weak financial planning at the implementation level. The underutilisation has adverse impacted the recruitment of skilled teachers, lack of adequate infrastructure. The National Institute of Public Finance and Policy (2022) has further lent support to this argument.
As per the PRS India statistics, 85% of the funds have been used for the Samagra Siksha Abhiyan, the rest of the schemes have performed poorly, while the rest 15% for the other schemes resulting in an uneven distribution. The utilisation of funds under PM-USHA has remained extremely low, largely because of delayed state proposals and limited implementation capacity.
Recent policy analyses further broaden this debate by questioning whether achieving the six per cent target alone would be sufficient. Studies based on NEP 2020 projections suggest that education expenditure has historically increased alongside economic growth but not at a pace adequate to achieve the policy target. Without deliberate fiscal prioritisation, economic growth alone is unlikely to generate the resources required for systemic educational reforms.
Evidence from educational outcomes prove the consequences of uneven utilization of funds. States such as Bihar, Jharkhand and Uttar Pradesh continue to report poorly in terms of enrolment, teacher availability and pupil-teacher ratios, while Kerala and Tamil Nadu perform substantially better in the human development indicators as per the Ministry of Education’s Performance Grading Index. The higher pupil-teacher ratio observed in Bihar reflects the limitations of the State in terms of education and capacity building. Similarly, it has been observed that State run Universities are unable to compete against Central Universities due to lack of funds and management.
Overall, the literature explains that India’s education financing challenge extends beyond inadequate public expenditure. It includes inequitable allocation, uneven fiscal capacity among the states, delayed fund and centre- state conflicts. The present study seeks to address by analysing not only the magnitude of public expenditure but also the institutional and federal factors that shape its allocation, utilisation and impact on the quality of school education.
Methodology & Data Analytics
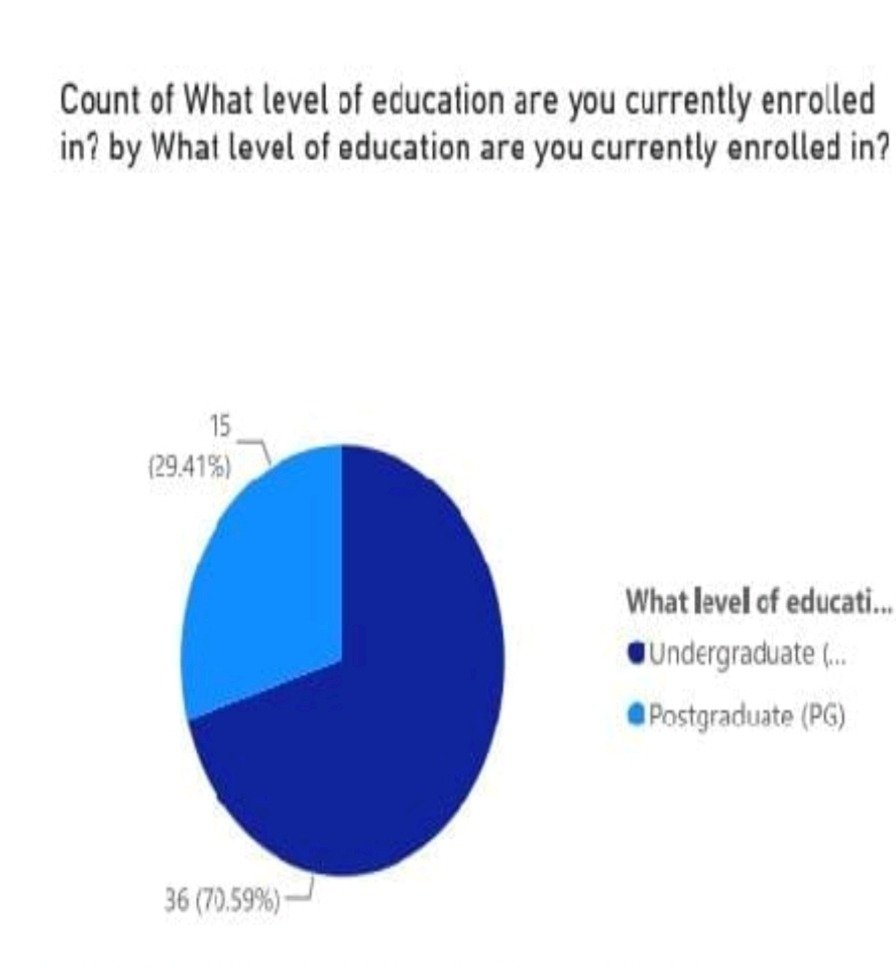
The research relies on a mix of both quantitative and qualitative methods; including the primary and secondary data. The primary data was collected through unstructured interviews conducted among the student fraternity; particularly in the city of Mumbai. The research aimed to understand the students’ perception regarding their opinion on school infrastructures; whether they feel the schools are able to cater to their needs and who do they feel is responsible for schooling system in India.
The secondary data primarily relies on various governmental, intergovernmental and intragovernmental sources for statistical and comparative analysis of various states/ countries and the level of disparities between the states. The data also emphasizes on the budget provided in each level of schooling as well as the teacher-pupil ratio in the country , and the education spending of different countries.
Primary Data & Empirical Evidence Analysis: ( It is the analysis of the students’ perspective and public opinion on education infrastructure)
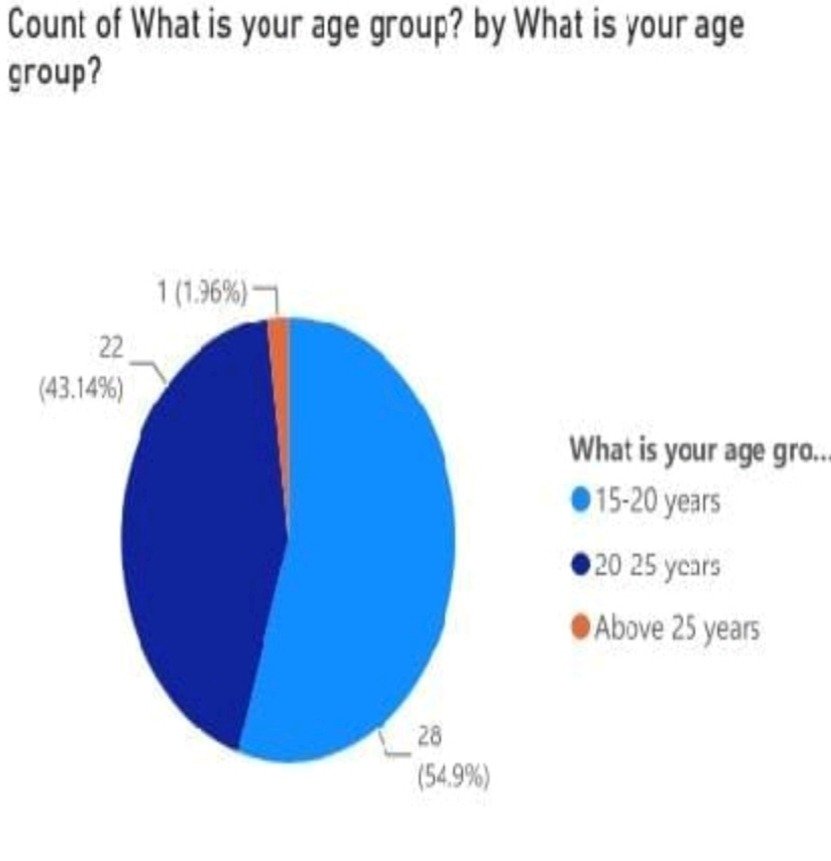
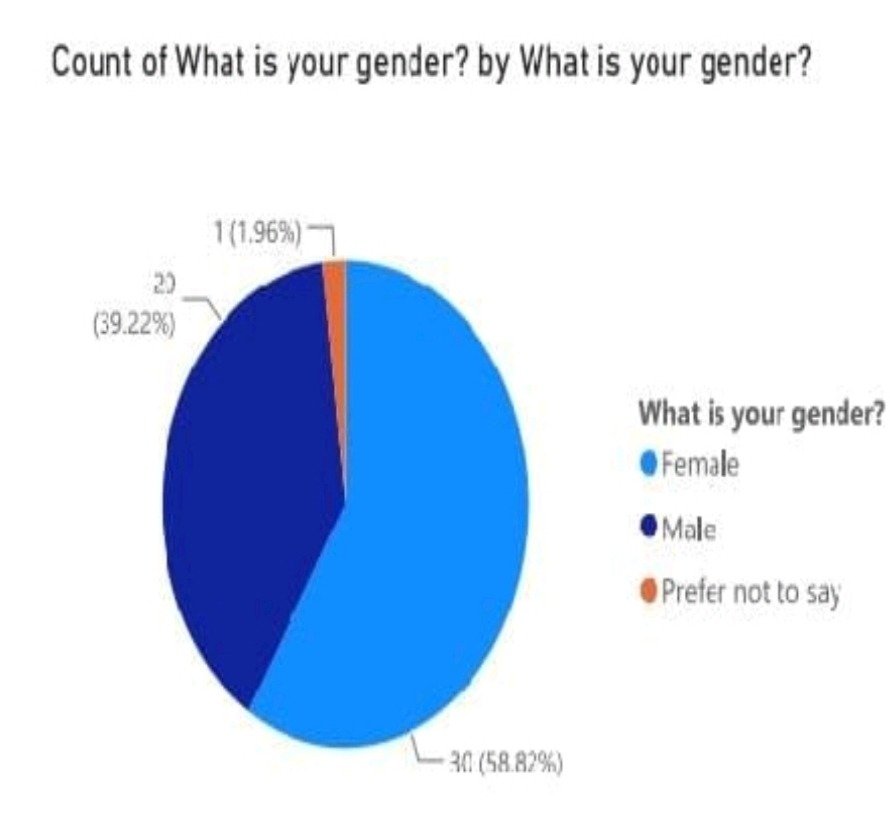
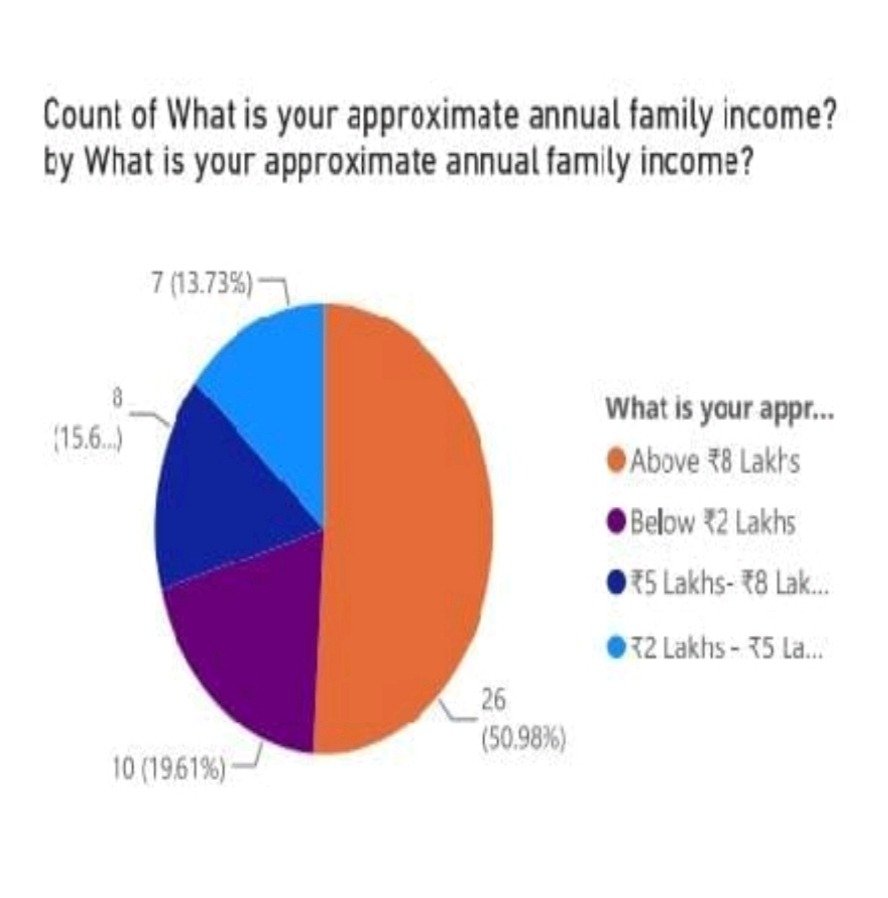
Survey analysis and findings
The survey shows a strong perception regarding the shortcoming of the education sector among the minds of the people. The respondents during the survey highlighted the inadequate infrastructure, lack of digital learning as key issues which they felt was due to inadequate government funding. Another issue highlighted was the highly examination oriented curriculum. Thus we observed that the responses were highly multidimensional from a public policy making point of view.
People felt that there is a direct connection between government funding and the infrastructure. Several responses state that increased government investment would improve teacher quality, skill development, and accessibility. At the same time, students felt that infrastructure alone wont solve the issue, accountability, transparency of the process and overall reform in the curriculum is needed.
Respondents point to socioeconomic inequality, the high cost of private education, and inter-state disparities as reasons why quality education is unevenly distributed. This indicates that education financing needs to be analysed not only from the account of total GDP spent in education, but also on the basis of which schemes were given more priority, and the allocation between various states, and the way the states utilized those funds.
Key findings
Most respondents attribute the poor quality of education to lack of government funding. Several responses highlight the importance of skill-based, practical learning, not rote memorisation. Many respondents think that better infrastructure and digital resources are essential to improving results. Several responses mention inequalities of access, particularly between government, aided and private institutions. The open-ended suggestions always include more spending on higher education, affordable education and stronger implementation.
Research implications
The survey supports the argument that India’s education challenge is not limited to enrolment or spending levels, but to the quality and equity of how resources are used. For the research on raising education spending to 6% of GDP, the survey can be used as primary evidence that respondents associate higher public investment with better access, improved learning conditions, and reduced inequality. It also shows that respondents expect the government to focus on teacher quality, practical curriculum design, and infrastructure, not just larger budgets. The survey also supports the literature analysis which emphasized the fact that India doesn’t allocate much fund for higher education & Research – Development, which needs to be pillar any transitioning society from ‘developing’ to ‘developed’.
Secondary data and Governmental Statistics
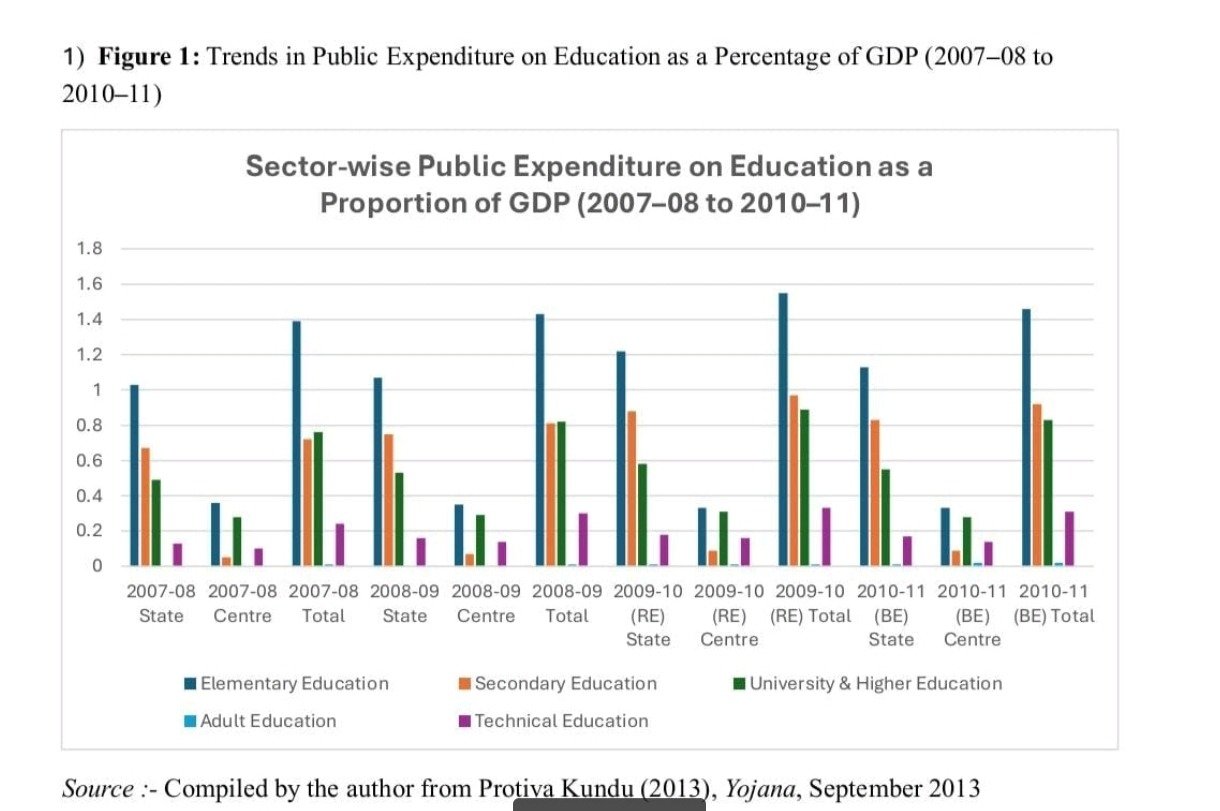
Interpretation:
The graph shows the trend in public expenditure on different education sectors as a percentage of GDP from 2007–08 to 2010–11. Elementary education consistently received the highest share of expenditure, followed by secondary and higher education, indicating the government’s
greater emphasis on improving basic education; at the same time adult & technical education remains low.
Interpretation:
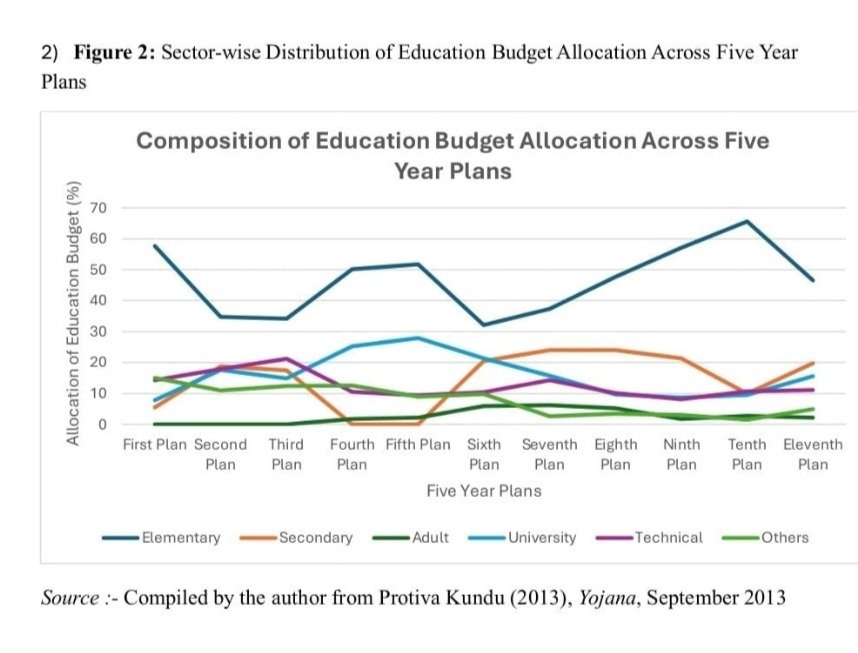
The graph illustrates the distribution of education budget allocations across different Five Year Plans. It shows that elementary education received the largest share in most plans, while the allocation to secondary, higher, technical, and adult education varied over time, reflecting changing government priorities the education sector.
Interpretation:
The graph represents the total share of GDP each BRICS country spent on education sector, and India has consistently lagged behind; suggesting a persistent underinvestment that may have hampered school infrastructure and quality of learning.
Interpretation:
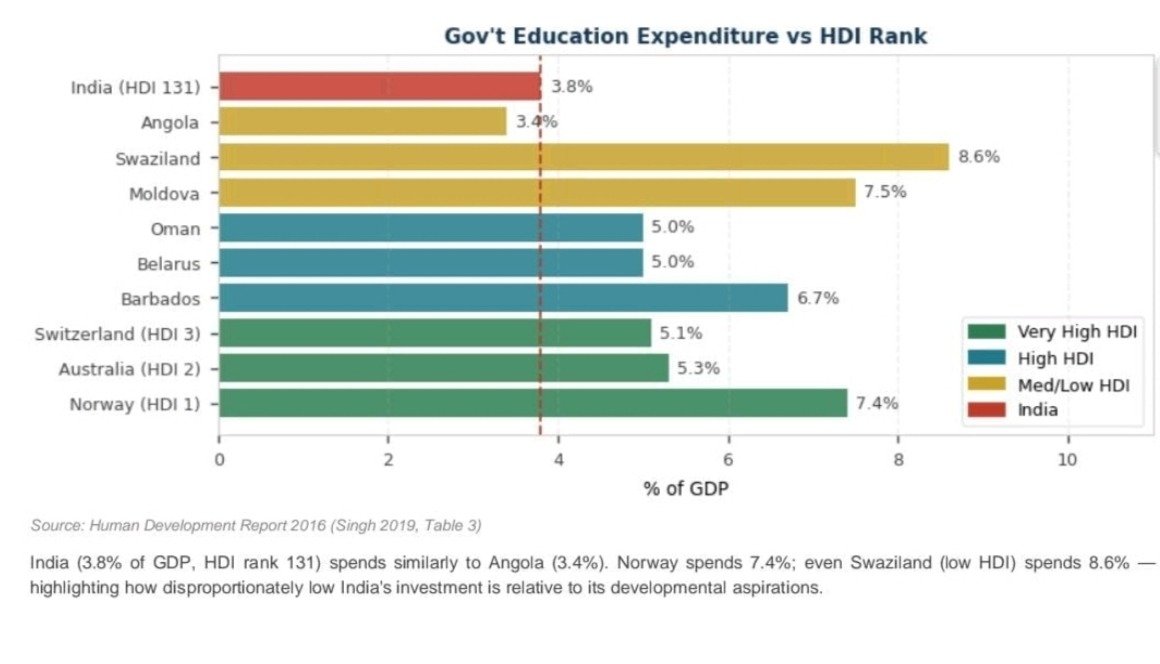
The graph indicates the human development index of India which remains relatively modest even in comparison with lesser developed countries, highlighting a mismatch in education needs and government priorities.
Interpretation:
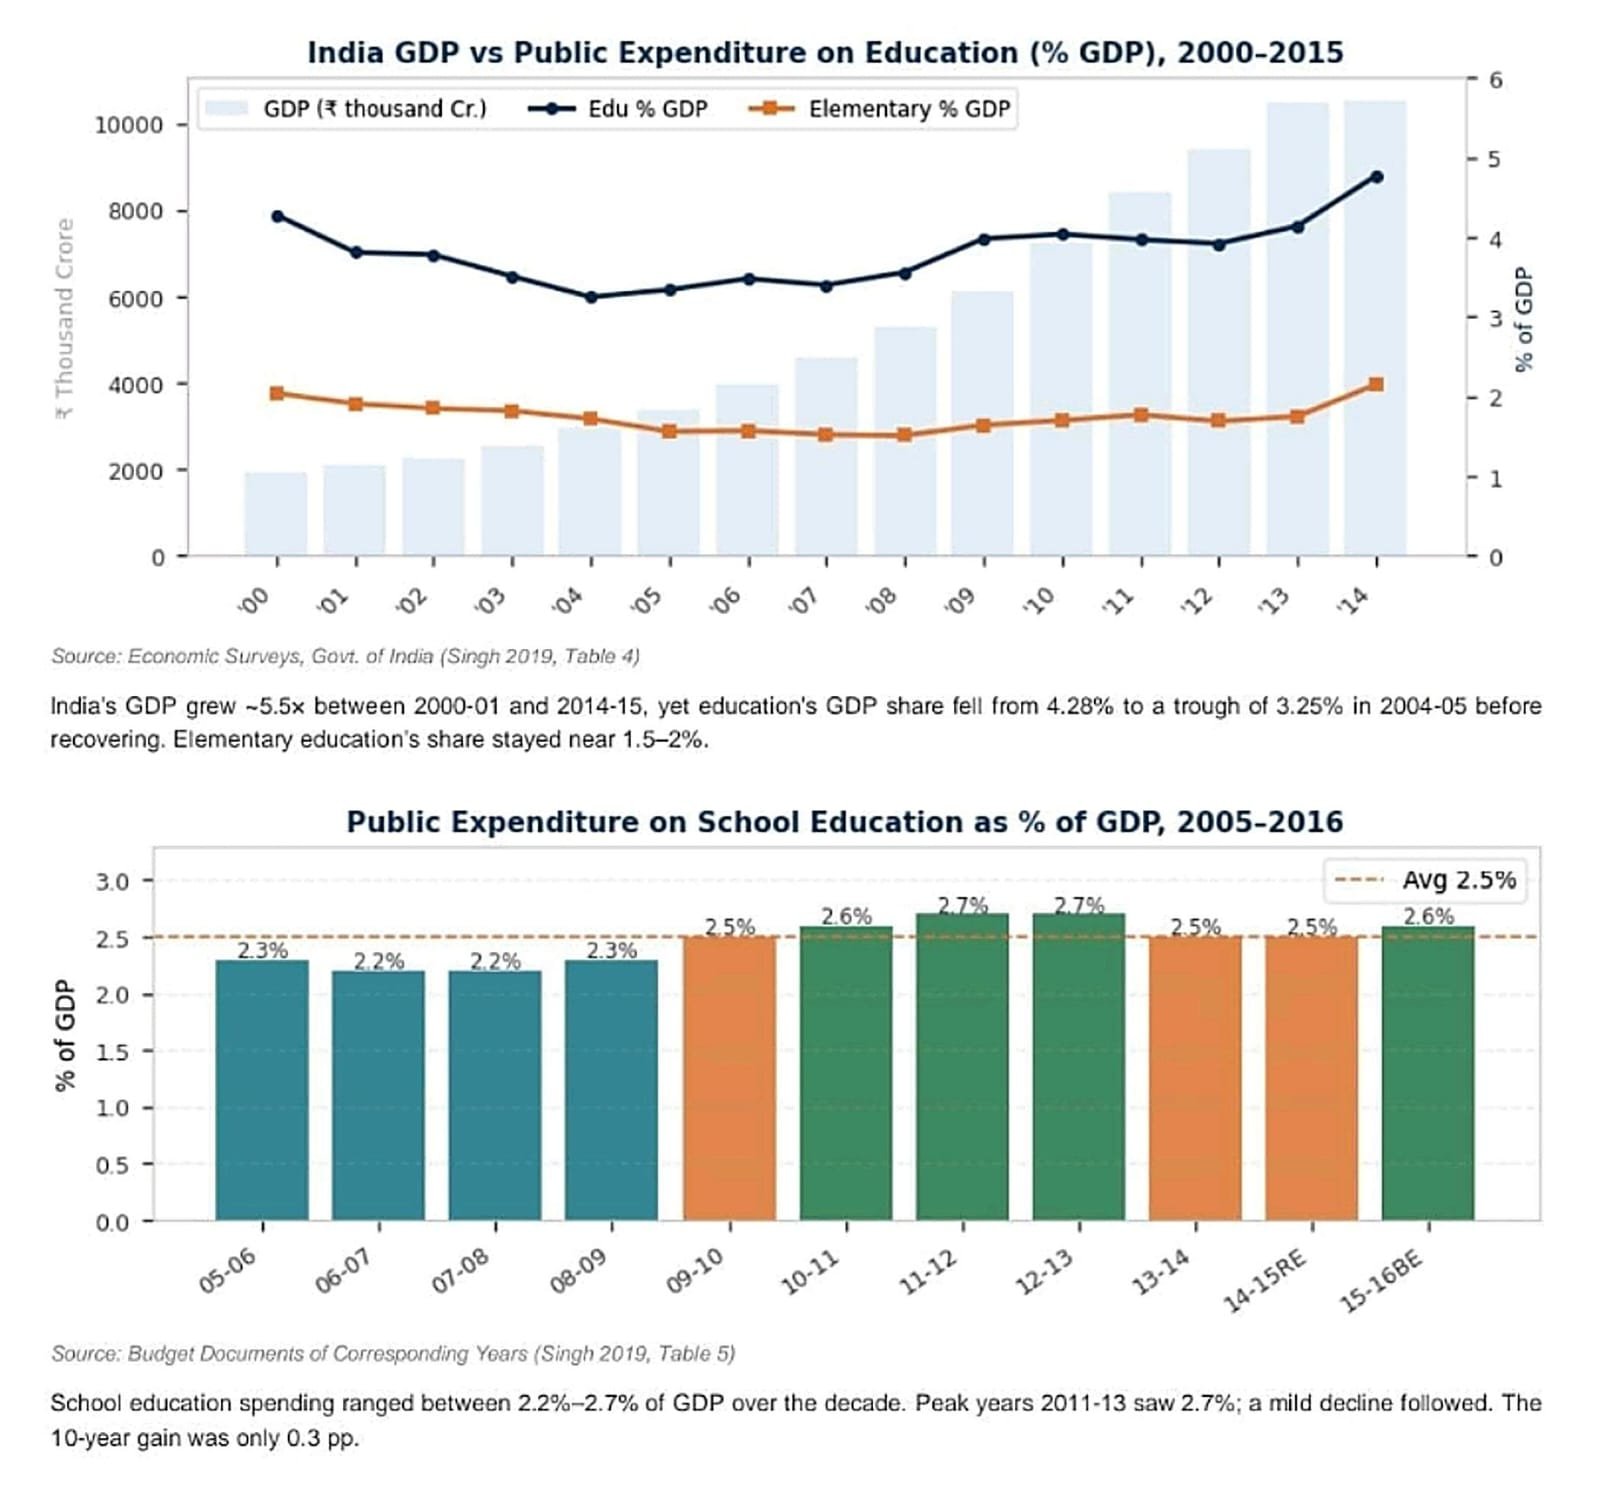
The graph depicts that while India’s economy expanded substantially, the share of education remained stagnant indicating that economic growth was not proportionately translated in investment in schooling.
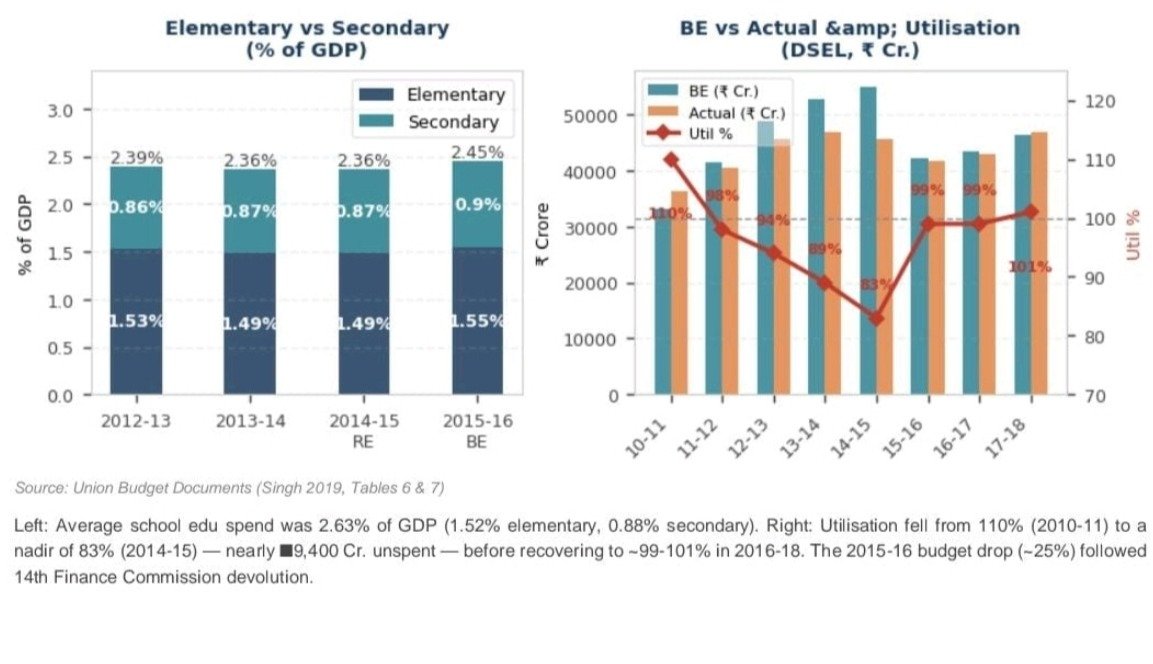
Interpretation:
The graph reveals that school education expenditure has remained low over decades, at around 1.55% on total GDP, suggesting limited fiscal prioritization or policy commitments.
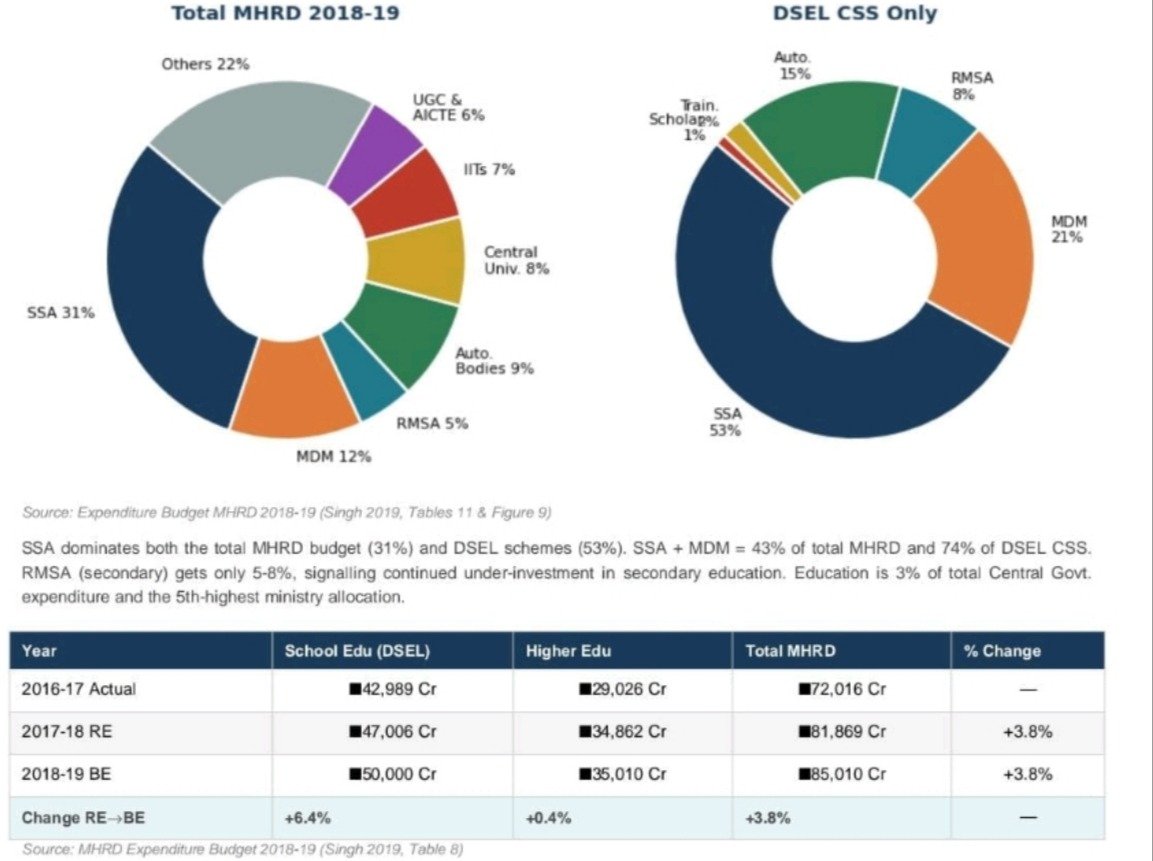
Interpretation:
The graph illustrated the percentage allocated to each and every education flagship scheme in India, where secondary education received comparatively lower funding reflecting an imbalance in expenditure across different stages of schooling.
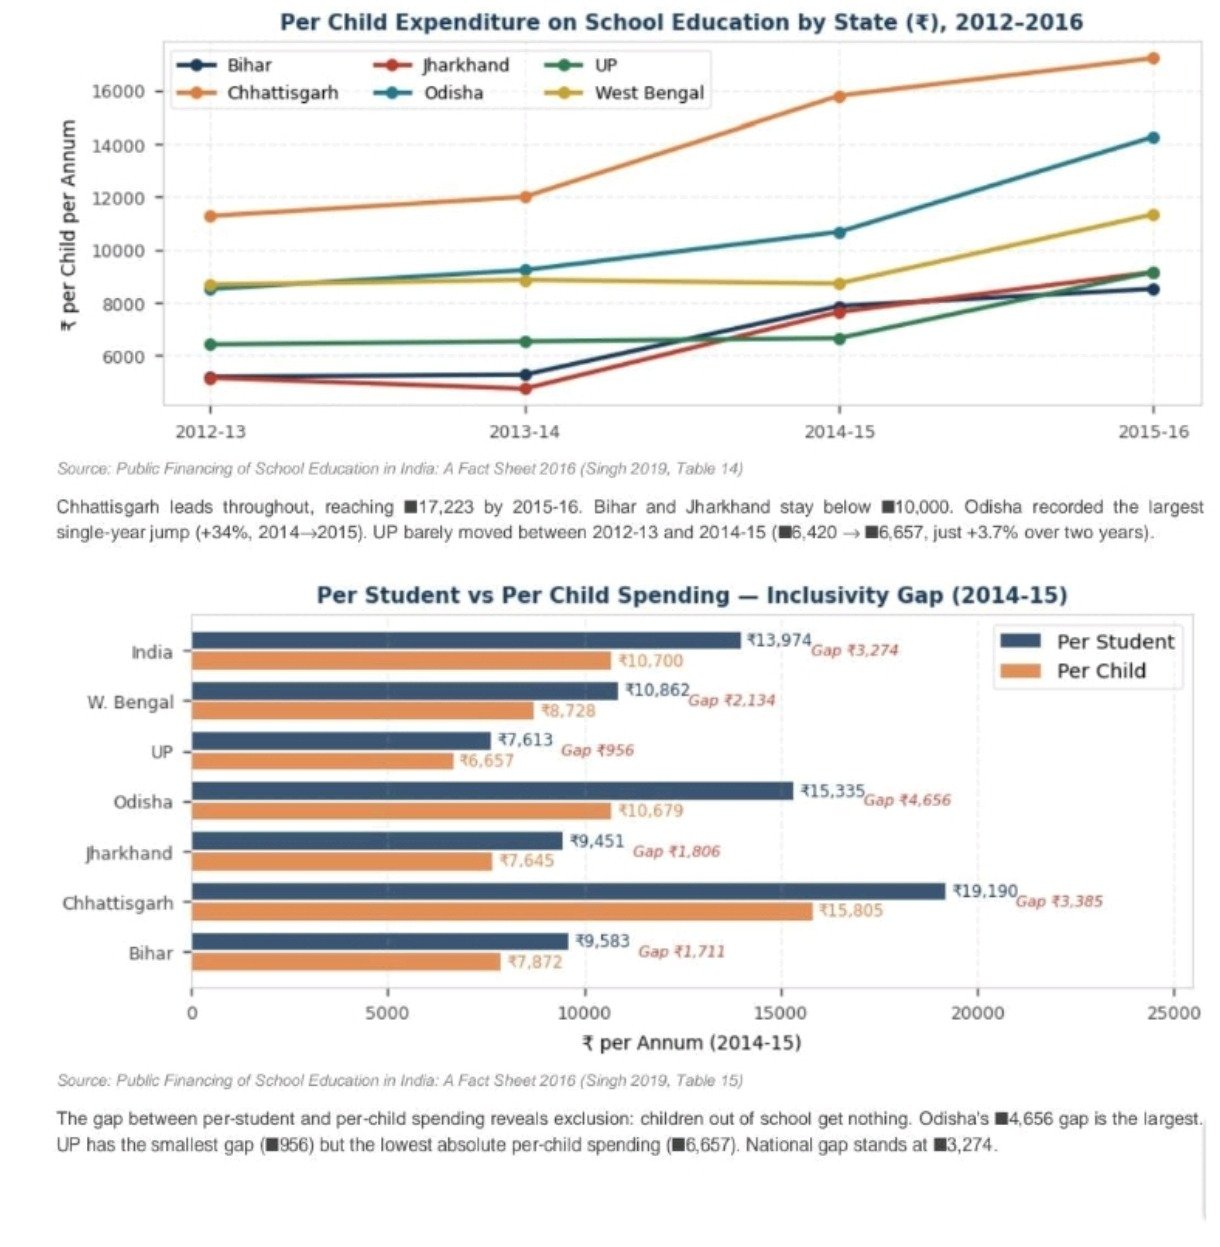
Interpretation:
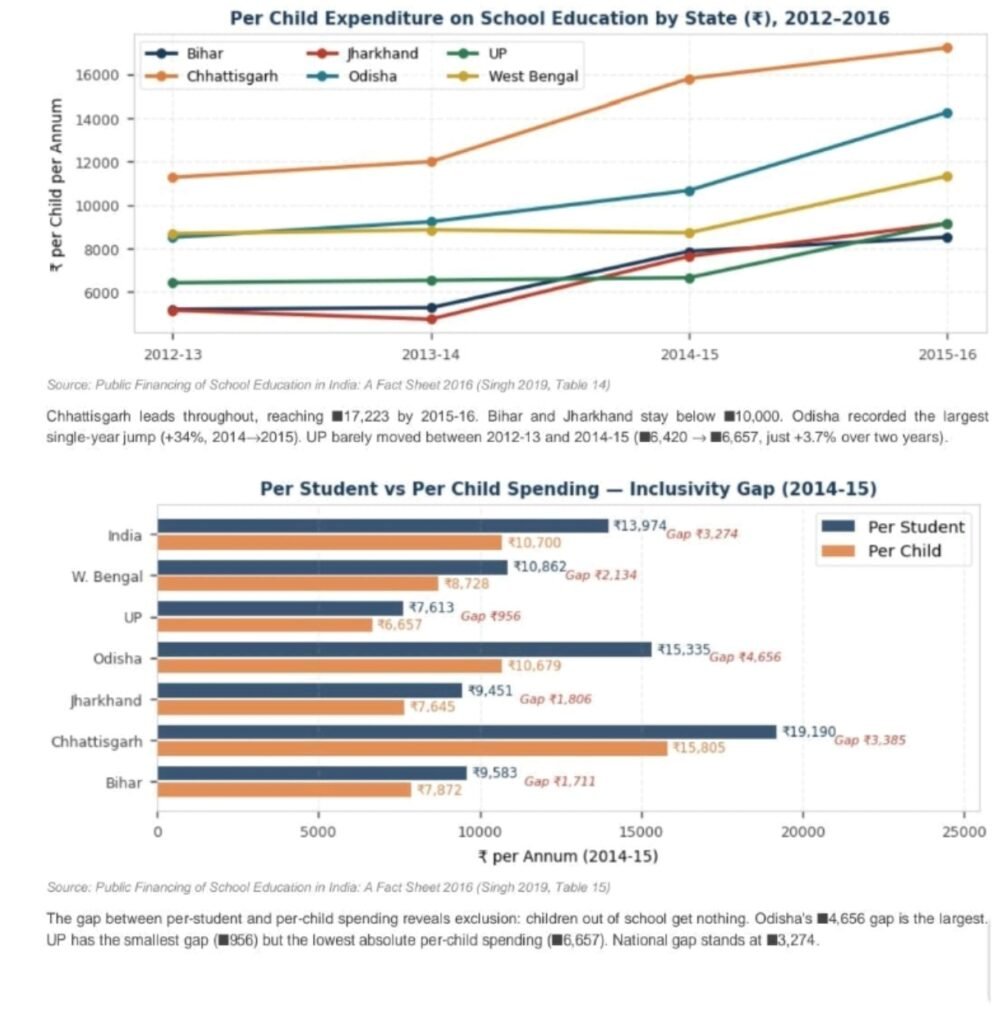
The graph reveals the per student & per child expenditure across states, which reveals that some states remain below the national average suggesting a disparity that influences the quality of education, revealing the exclusion and drop out rates, which is mainly due to the gap between budget allocation and the eventual implementation or spending.
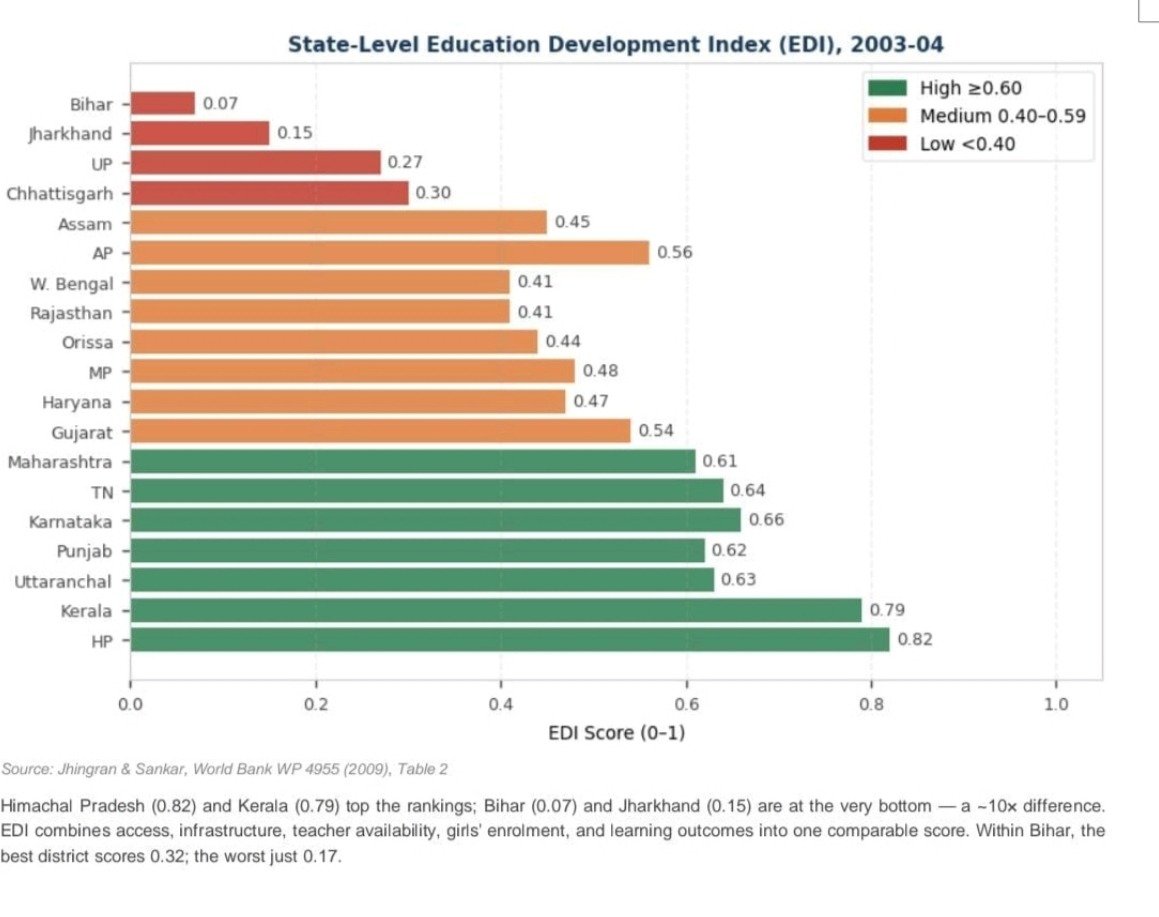
Interpretation:
The graph demonstrated considerable interstate variation in education expenditure, suggesting that unequal fiscal capacity. While states like Himachal Pradesh and Kerala ( which coincidentally have also achieved 100% literacy) have higher EDI score and higher education spending, while states like Bihar and Jharkhand fall behind.
Interpretation: The graph explains the improvement in pre school coverage, digital literacy and reading improvements which have occurred in the last one decade. Thus, it explains the need to combine digital education and inclusion learning for all through technology which certainly requires better government initiatives and resource allocation
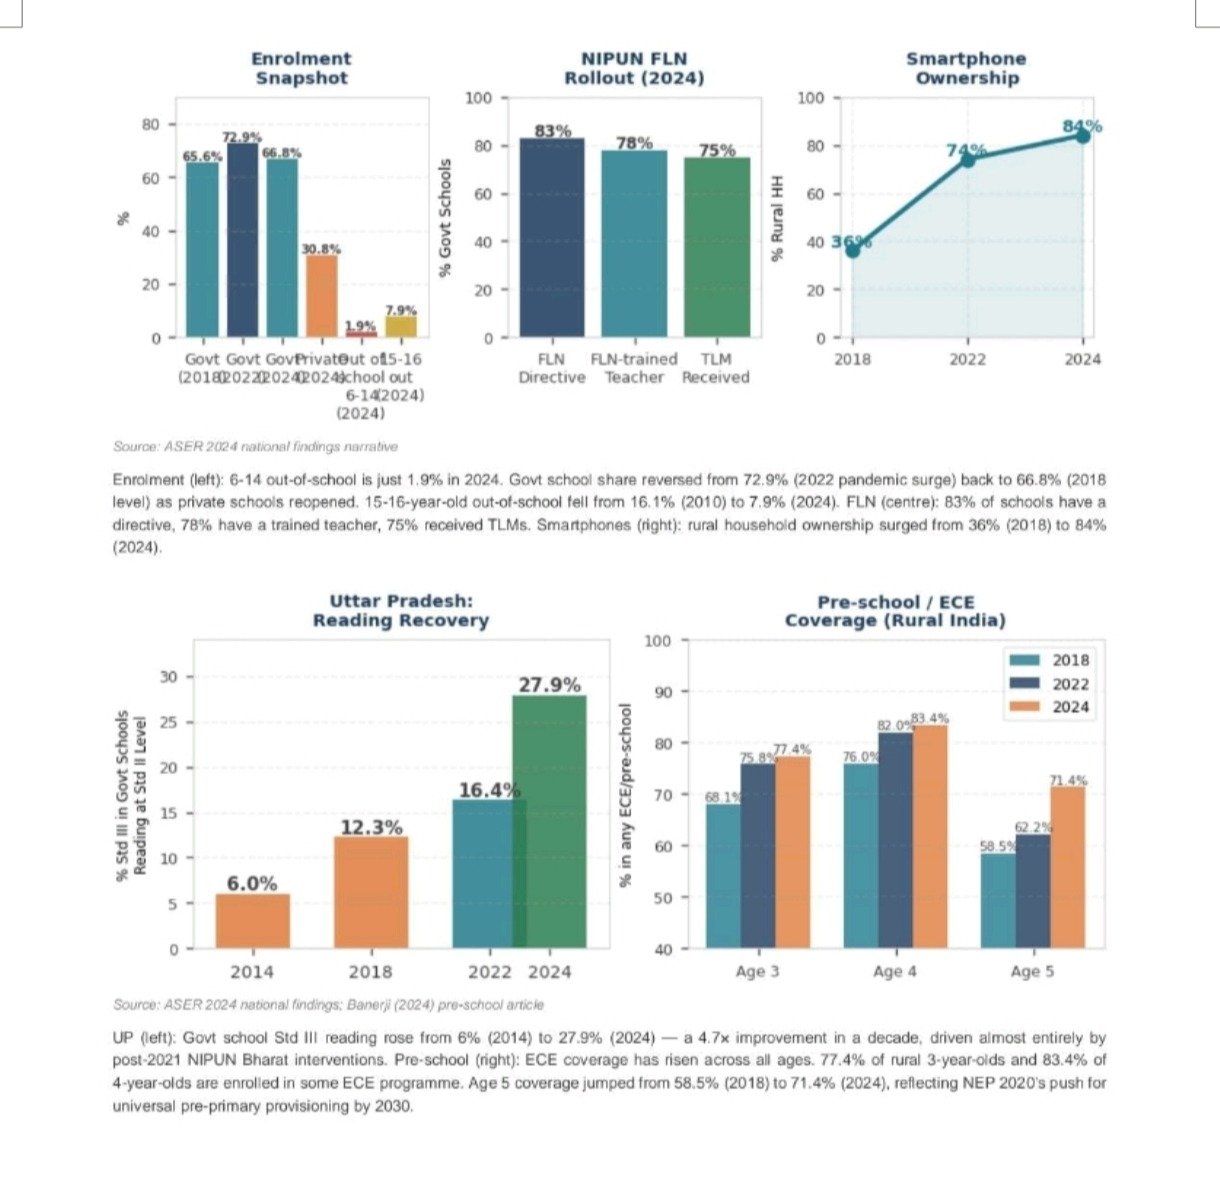
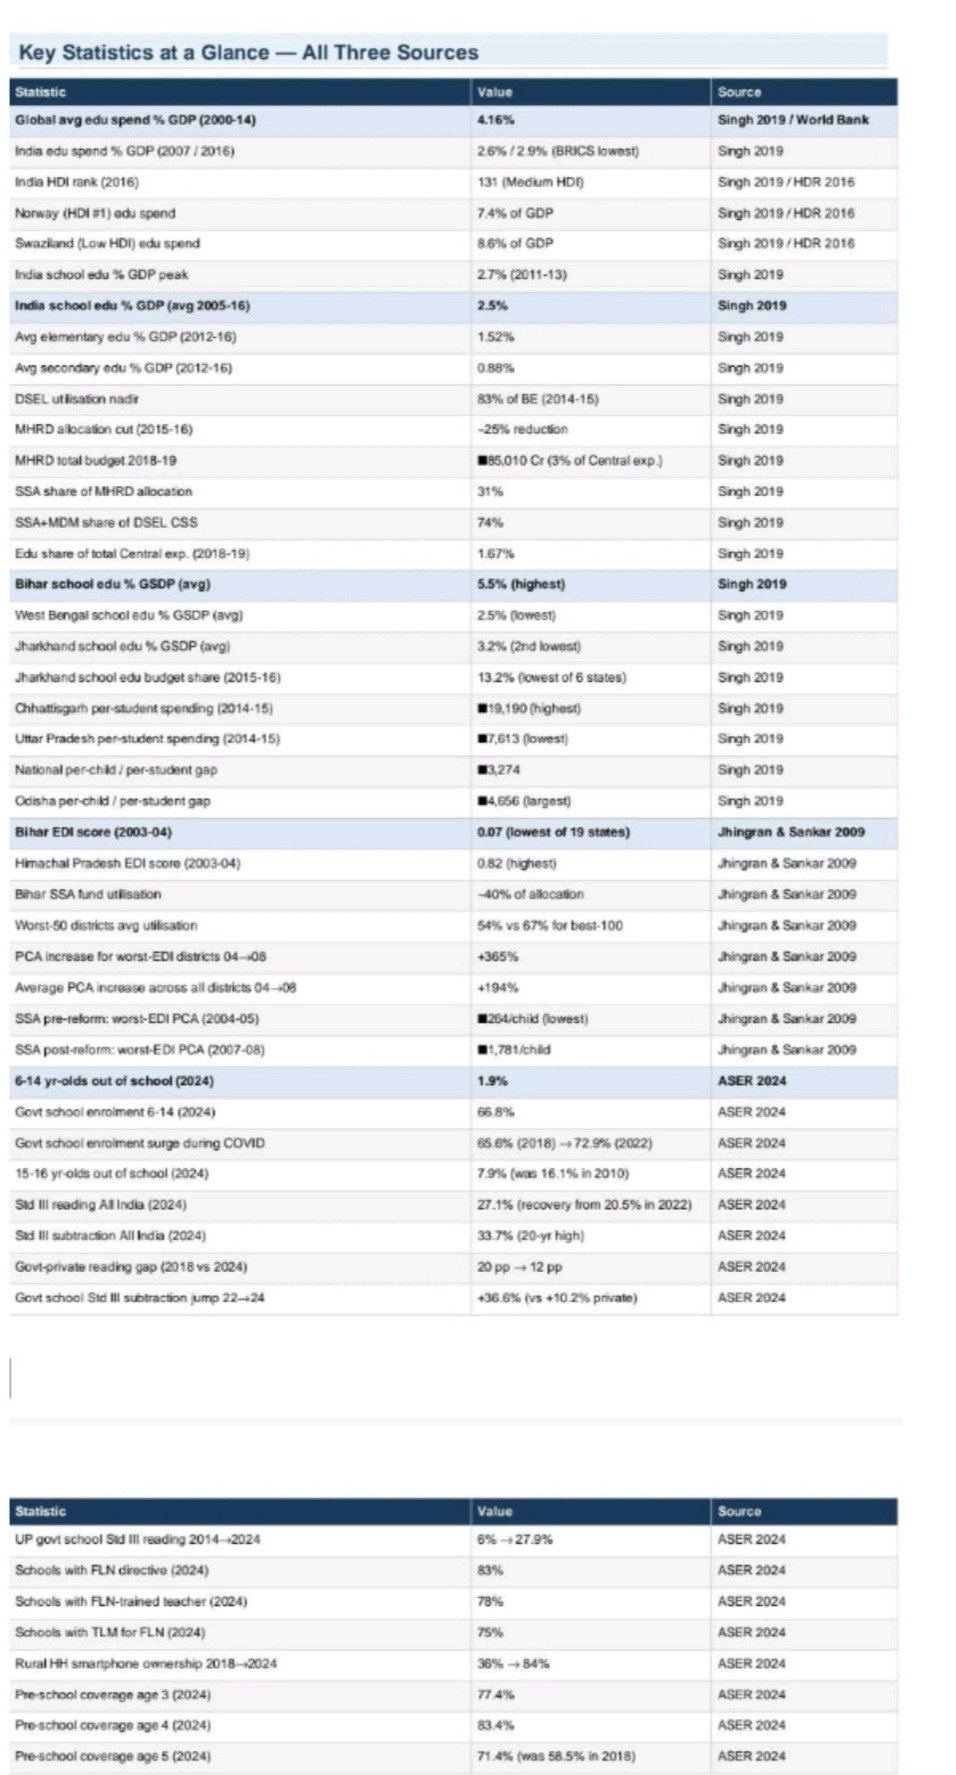
Thus, the research through the data through secondary sources and government sites eventually indicates that despite improvements in the last few decades in terms of enrolment and foundation learning, India’s overall expenditure in schooling has been low as compared to global levels.
This can be coupled with various issues such as:
- Interstate disparities in terms of human development and economic growth.
- Inefficient fund utilization by many of the states.
- Uneven resource allocation by the state.
The analysis of the data has helped to facilitate the identification of trends, disparities, perspective of the public and the key indicators of access and learning.
It has led to a more clearer understanding of expenditure levels and resource allocation that have influenced the Indian schooling system in the last few decades.
Shortcomings & Recommendations for Policy Making
The findings of this study resist a simple reading. It would be convenient to say that India’s education crisis is a crisis of insufficient money, and that raising the public expenditure would make it better. The evidence assembled here suggests something uncomfortable: that chronic underinvestment, distributional inequity, and utilisation failure are not three individual problems. They are something which coexist and sustain each other. A national spending level below the desired goal creates scarcity, which then creates a competition between states for centrally sponsored funds; hampering the federal structure. This competition is mitigated by allocation mechanisms that have historically tracked administrative convenience rather than the need, and the states that emerge with the least allocation are often the states who lack the administrative capacity and mechanism to spend what they receive. There exists a question this research is ultimately obliged to confront: does an increase in the education budget translate into an improvement in the quality of education?
The data offer only a qualified answer. At the extremes, the relationship holds that Chhattisgarh, spending Rs. 19,190 per student in 2014–15, sits far above Uttar Pradesh at Rs. 7,613, and the outcome divergence between them is real. Yet the relationship weakens considerably once the comparison moves inward. Bihar devoted the highest share of its GSDP to school education among the six states examined (5.5 per cent), a stronger fiscal commitment than West Bengal’s 2.5 per cent, and still recorded the lowest EDI in the country. A state can prioritise education within its own budget and remain educationally deprived, because a share of a small economy is a small sum, and because a large allocation that is not spent is not an allocation at all.
Together these findings suggest that India’s education financing gap cannot be closed by fiscal expansion alone. The more decisive variable is not how much is allocated, but how and whether it is spent.
There is a need to integrate financial planning with educational planning. While focus needs to be on physical infrastructure, it is also important to fill the existing gaps like teacher vacancies, lack of adequate schools in remote areas, digital inaccessibility and a proper conversion of primary schooling to even secondary and higher secondary ones. Strengthening fund utilization capacity to support weaker states and making sure that the resource actually reaches the ground needs to be the priority. Need to focus on outcome- based financing rather than the input based.
Conclusion
In the end, the primary data from the survey revealed that the respondents strongly associate better learning outcomes to improved infrastructure, digital resources, and practical learning.
The secondary data analysis also indicates that economic growth has not been matched by a corresponding growth in educational expenditure. There is a huge variation across states in terms of per-student expenditure, infrastructure, availability of teachers and educational outcomes, indicating that fiscal capacity and governance are important determinants of the quality of schooling.
To conclude, this study suggests that the provision of quality and equitable education to all requires a balanced approach that includes adequate public investment, efficient governance and effective implementation. Therefore future education policies should focus on both increasing budgetary allocations and improving institutional capacity, financial accountability, regional disparities and ensuring that each rupee allocated is directly translated into better educational opportunities and outcomes for students across India. India’s education challenge is both, s governance challenge as well a fiscal one. The future of our education policy thus lies in making sure that young minds are nurtured for a better and developed India.
References
1. ASER Centre / Pratham. (2024). Annual Status of Education Report (ASER) 2024. Pratham. https://asercentre.org/wp-content/uploads/2022/12/ASER-2024-National-findings.pdf
2. Banerji, R. (2025). The pre-school years in India: Progress since NEP 2020. In Annual Status of Education Report (ASER) 2024. ASER Centre / Pratham. https://asercentre.org/wp-content/uploads/2022/12/The-pre-school-years-in-India_Progress-since-NEP-2020_Rukmini-Banerji.pdf
3. Bose, S., Noopur, & Nayudu, A. S. H. (2022, March 25). Intergovernmental fiscal transfers and expenditure on education in India: State level analysis, 2005 to 2020 (Working Paper No. 377). National Institute of Public Finance and Policy. https://www.nipfp.org.in/media/documents/WP_377_2022.pdf
4. Centre for Budget and Governance Accountability. (2018). Budgeting for School Education: What Has Changed and What Has Not? CBGA & CRY. https://www.cbgaindia.org/wp-content/uploads/2018/07/Budgeting-for-School-Education-What-Has-Changed-and-What-Has-Not.pdf
5. Centre for Economic and Social Studies. (2025). Expenditure on education in India (CESS Monograph Papers No. 59). Centre for Economic and Social Studies, Hyderabad. https://cess.ac.in/wp-content/uploads/2025/07/Cess-Monograph-Papers-59.pdf
6. Chakrabarti, R., & Sanyal, K. (2016). Public policy in India. Oxford University Press. https://global.oup.com/academic/product/public-policy-in-india-9780199470693
7. Chakrabarty, B., & Kandpal, P. C. (2025). Public policy in India. Routledge. https://www.routledge.com/Public-Policy-in-India/Chakrabarty-Kandpal/p/book/9781032896250
8. De, A., & Endow, T. (2008). Public expenditure on education in India: Recent trends and outcomes (RECOUP Working Paper No. 18). Research Consortium on Educational Outcomes and Poverty, University of Cambridge. https://www.gov.uk/research-for-development-outputs/recoup-working-paper-18-public-expenditure-on-education-in-india-recent-trends-and-outcomes
9. Dutta, S. (2017). Financing elementary education in India: Fund flow pattern and utilization of resources in elementary education. https://www.researchgate.net/publication/331523461
10. Government of India. (1966). Report of the Education Commission 1964–66: Education and national development (Kothari Commission Report). Ministry of Education.
11. Jhingran, D., & Sankar, D. (2009a). Addressing educational disparity: Using district level education development indices for equitable resource allocations in India (World Bank Policy Research Working Paper No. 4955). https://papers.ssrn.com/sol3/papers.cfm?abstract_id=1414717
12. Jhingran, D., & Sankar, D. (2009b). Orienting outlays toward needs: An evidence-based, equity-focused approach for Sarva Shiksha Abhiyan. World Bank, South Asia Human Development Department. https://documents1.worldbank.org/curated/en/447791468042281107/txt/42116optmzd0Sa10Allocation01PUBLIC1.txt
13. Kundu, P. (2013, September). Budget for education: A factsheet. Yojana, 57. Publications Division, Ministry of Information and Broadcasting, Government of India. https://www.cbgaindia.org/wp-content/uploads/2016/04/Budget-for-Education.pdf
14. Ministry of Education, Government of India. (2020). National Education Policy 2020. Department of School Education and Literacy. https://static.pib.gov.in/WriteReadData/userfiles/NEP_Final_English_0.pdf
15. Ministry of Education, Government of India. (2024). Performance Grading Index 2.0 for States/UTs, 2022–23 & 2023–24. Department of School Education and Literacy. https://www.education.gov.in/sites/upload_files/mhrd/files/statistics-new/PGIS.pdf
16. Ministry of Education, Government of India. (2024). UDISE+ 2023–24: Report on Unified District Information System for Education Plus. Department of School Education & Literacy. https://www.education.gov.in/sites/upload_files/mhrd/files/statistics-new/udise_report_existing_23_24.pdf
17. Motkuri, V., & Revathi, E. (2023). Public expenditure on education in India: Centre–state allocations. Journal of Development Policy and Practice, 8(2), 194–208. https://doi.org/10.1177/24551333231163949
18. Motkuri, V., & Revathi, E. (2024). Private and public expenditure on education in India: Trends over last seven decades and impact on economy. Indian Public Policy Review, 5(1), 90–112. https://ippr.in/index.php/ippr/article/view/246
19. National Centre for Education, India. (2017). A study on financing public education in India. http://nceindia.org.in/wp-content/uploads/2017/03/2017-a-study-on-financing-public-education.pdf
20. National Institute of Public Finance and Policy. (2022). Public expenditure on education in India. NIPFP, New Delhi.
21. Policy Circle. (2025, December 12). Why India must raise education spending to 6% of GDP. https://www.policycircle.org/policy/india-must-raise-education-spending/
22. Policy Circle. (2026, February 3). Education budget: India’s demographic dividend meets a half-hearted push. https://www.policycircle.org/economy/demographic-dividend-education-budget/
23. Press Information Bureau. (2025, August 26). Results of Comprehensive Modular Survey: Education, 2025 (April–June 2025). Government of India, Ministry of Statistics and Programme Implementation. https://www.pib.gov.in/PressReleseDetailm.aspx?PRID=2160863
24. PRS Legislative Research. (2024). Demand for Grants 2024–25 Analysis: Education. https://prsindia.org/budgets/parliament/demand-for-grants-2024-25-analysis-education
25. PRS Legislative Research. (2026). Demand for Grants 2026–27 Analysis: Education. https://prsindia.org/budgets/parliament/demand-for-grants-2026-27-analysis-education
26. Singh, U. (2019). A comparative study of the trends of public expenditure on education in India with special reference to school education. Journal of Economic & Social Development, XV(1), 111–128. https://www.vbu.ac.in/ftpwebapps/vbu/resources/vbu_web/dept/echonomics/Paper%204%20-%20Umendra_Singh.pdf
27. Tamang, P. (2011). The impact of education expenditure on India’s economic growth. Journal of International Academic Research, 11(3), 14–20. https://www.researchgate.net/publication/267366249_The_Impact_of_Education_Expenditure_on_India’s_Economic_Growth
28. UNESCO. (2015). Education 2030: Incheon Declaration and Framework for Action for the implementation of Sustainable Development Goal 4. UNESCO. https://unesdoc.unesco.org/ark:/48223/pf0000245656
29. UNESCO Global Education Monitoring Report. (n.d.). Finance. https://www.unesco.org/gem-report/en/education-finance