Authors:
Banashree Mandal, Jyoti Singh, Nandini Vamsharaj, Reeshma Jamal, Ritika Mehta, Saksham Upadhyay, Sharvari Dhanke, Shlok Tulshyan, Suhavi Kaur
1. Abstract
The objective of this research is to investigate the underlying factors that govern international trade by analyzing the impact of bilateral and multilateral agreements on trade openness and economic growth over a range of economic frameworks. The research utilizes a mixed-methods comparison technique, systematically analysing economic and tariff statistics for four countries (India, USA, China, and Russia) from 2000 to 2024. The model used is the Gravity Model, along with a general evaluation of these nations’ participation in the WTO and FTAs. The results indicate that while economic size offers more trade opportunities for these four nations, actual trade volumes can differ considerably due to institutional and political constraints. WTO membership does not lead to a similar level of trade openness, while the recent return of tariffs leads to uneven changes in trade relations. The study demonstrates the importance of proper strategies and institutional soundness for successful application of trade agreements.
Keywords:
Economic Growth, International Trade, Trade Relations, Tariffs, Gravity Model, Trade Liberalization.
2. Introduction
Modern international trade has been built on a deceptively simple promise: sign trade contracts, increase trade volume, and economic growth will automatically follow. However, modern commerce regularly defies this doctrine. Expanding trade volume and reducing tariffs do not have a uniform effect. While the WTO once anchored a predictable global market, recent years have fractured the global space into restricted bilateral trade deals and tariff surges, and it is within these fractures that traditional theories fall apart. This paper examines the modern relationship between trade agreements, trade volumes and economic growth.
The relationship between trade and growth remains the central objective of national policies. Escalating tariff conflicts and exponential growth in Free Trade Agreements (FTA) and Regional Trade Agreements (RTA) make trade policy design an urgent matter for governments balancing openness and protection.
Although trade agreements generally lead to greater trade volumes and growth, their effects are not equal for all countries. The differences lie in institutional quality, government effectiveness, domestic policies, and agreement design. Rising tariffs and policy uncertainty have also altered global trade patterns, raising doubts about whether agreements still provide the same benefits.
Most existing studies look at WTO membership, FTAs, RTAs, and trade facilitation in isolation, and there is limited research on how effectiveness differs between developed and developing countries. This study responds to that gap by weighing multilateral commitments against bilateral and regional ones, while accounting for development differences, government effectiveness and the resurgence of tariffs since 2018.
3. Literature Review
3.1 Introduction
Trade agreements promote international trade and deeper economic integration. The Gravity Model is the theoretical foundation for analysing them, describing trade flows in terms of distance and economic size. Beyond tariff cuts, market expansion, productivity, trade facilitation and regulatory cooperation also affect their effectiveness. This review covers the Gravity Model, trade liberalization and growth, WTO membership, bilateral and regional agreements, and agreements in an age of rising tariffs.
3.2 Theoretical Foundations and the Gravity Model
The gravity model remains the theoretical and empirical backbone of trade policy analysis, explaining bilateral flows through economic size and trade costs while correcting for multilateral resistance. Anderson and van Wincoop (2003) showed earlier gravity estimations lacked theoretical grounding, producing omitted-variable bias; applied to the McCallum border puzzle, their method showed borders reduced trade between industrialized countries by 20–50%. Silva and Tenreyro (2006) showed that log-linearized gravity equations estimated by OLS are biased under heteroskedasticity and zero-trade observations, a problem their PPML estimator resolved and which has become the field’s standard. Piermartini and Yotov (2016) turned both contributions into a practical estimation guide, and Campos et al. (2024) added a simulation command for general-equilibrium trade and welfare effects within the “universal gravity” framework. Larch et al. (2019) re-estimated GATT/WTO effects and found membership raised trade between members by roughly 171%, well above earlier literature and sensitive to specification.
Baier and Bergstrand (2007) found that correcting for endogeneity via panel methods roughly doubled the estimated trade effect of an FTA after ten years, five to six times larger than naive cross-sectional estimates. Larch and Yotov (2023) found the Trade Facilitation Agreement raised world trade by 1.17% and LDC exports by 2.4%. IMF (2016), using synthetic control, found an 80% export gain over ten years. Kutlina-Dimitrova and Lakatos (2017) estimated that cancelling existing agreements, with services costs rising, would cut global income by about 0.3% a year (around $211 billion), with East Asia and the Pacific and Latin America and the Caribbean hit hardest. Sachs and Warner (1995) linked a composite openness index to growth, but Rodríguez and Rodrik (2000) showed the index conflates trade policy with unrelated institutional factors.
3.3 Trade Liberalization and Economic Growth
Reducing tariffs gives access to larger markets, investment and productivity gains, generally associated with higher income and long-term growth, though researchers debate whether liberalization alone is sufficient. Sachs and Warner (1995) found open economies grew faster, but their measure was criticized for mixing trade policy with institutional variables (Rodríguez & Rodrik, 2001). Frankel and Romer (1999) used geography as an instrumental variable and found that countries where geography eased trade had higher income, though geography may affect growth through other channels. Rodríguez and Rodrik shifted the debate from whether liberalization promotes growth to the conditions under which it does, stressing complementary institutions and policies. The IMF (2016) agrees: benefits come through investment and productivity but are more likely when supported by strong institutions and effective policy.
India and Zambia illustrate this. India’s major trade reforms formed part of its wider 1991 economic reforms (Go & Mitra, 1998) and were followed by greater integration and stronger performance. Zambia cut tariffs and removed quantitative restrictions in the 1990s, yet growth stayed weak because of copper dependence, low investment and structural constraints (World Bank, 2004).
3.4 Impact of FTAs and RTAs on Trade Flows
International trade was once governed mainly through GATT and the WTO, but countries increasingly negotiate FTAs and RTAs. Modern ones go beyond tariffs to cover investment, services, intellectual property and digital trade (Murakami, 2025). Baier and Bergstrand (2007) showed FTAs significantly increase bilateral trade. Larch et al. (2019) found WTO membership raises trade among members and between members and non-members. Effectiveness depends on content: trade facilitation improves performance and welfare (WTO, 2023), and deeper agreements strengthen production networks, though effects vary by region and type (Murakami, 2025). Little research addresses the global shift from multilateral liberalization towards bilateral and regional agreements.
3.5 Does Joining the WTO Increase Trade?
The WTO’s framework reduces transaction costs and uncertainty, which drive trade volume, yet the empirical effect is debated. Rose (2004) argued GATT/WTO membership does not necessarily enhance trade; Helpman (2007) showed it significantly expands bilateral volumes and creates new trading relationships. Cheong et al. (2014) argue methodological issues, particularly the correlation between multilateral resistance terms and participation, obscure the effects and explain the wide variation in estimates. Harrison (1997) shows Uruguay Round reforms generated substantial income gains, contingent on effective market integration and removal of non-tariff barriers. The Trade Facilitation Agreement streamlines customs and cuts trade costs (Beverelli et al., 2015). The WTO also brought greater legal certainty (Hu, 2003), but a trade gap persists between developed and developing countries (Faiqoh et al., 2025). Overall, joining the WTO can raise trade, but effects are conditional on methodology, complementary reforms and a country’s capacity to remove structural barriers.
3.6 Trade Agreements in the Era of Tariffs
Recent tariffs and geopolitical tensions push governments to strengthen bilateral and regional agreements to secure market access, diversify exports and build supply-chain resilience (Rotunno & Ruta, 2025). Higher tariffs have altered the direction of trade rather than causing a sustained decline: tariffs on Chinese exports to the US encouraged firms to relocate to Vietnam, Mexico and India, while China expanded trade with ASEAN and other emerging markets. “Deep” agreements covering investment, digital trade, customs cooperation, regulatory harmonization and supply-chain resilience reduce non-tariff costs and help sustain trade amid tariffs and uncertainty (Murakami, 2025; WTO, 2023). Little research examines how the changing tariff situation affects the design and effectiveness of agreements.
3.7 Literature Summary
Trade agreements boost trade and growth, with the gravity model as the measurement basis. The benefits are not automatic: they depend on institutional quality, domestic policies and implementation. Rising tariffs make agreements more vital, though their effectiveness under current conditions remains uncertain.
4. Research Gap
Studies confirm that agreements boost trade flows, but impacts vary across countries and agreement types, and the reasons are underexplored. Most research examines FTAs, RTAs, WTO membership or facilitation in isolation. Tariffs since 2018 have redirected rather than reduced trade, while agreements expand to cover investment, digital trade and supply-chain resilience. It remains unclear how evolving tariffs and shifting agreement designs influence effectiveness across institutional and structural settings.
5. Research Questions and Objectives
Research Questions
- To what extent do institutional quality and government efficiency influence the positive relationship between international trade agreements and trade volumes on a country’s economic growth?
- How do WTO membership effects differ between developed and developing countries, and what institutional or structural factors explain these disparities?
- How have bilateral and regional trade agreements impacted different countries’ trade volume patterns as opposed to multilateral agreements like the WTO?
- How has the resurgence of tariffs influenced the role and effectiveness of international trade agreements in sustaining global trade volumes?
General Objective
To examine the influence of international trade agreements on trade volumes and economic growth by comparing multilateral and bilateral agreements and evaluating the influence of institutional quality and government effectiveness, while looking into the effect of tariffs.
Specific Objectives
- Assess how institutional quality, government effectiveness and agreement design influence the relationship between agreements, trade volumes and growth.
- Examine bilateral trade in the absence of FTAs and RTAs, while considering the role of WTO membership.
- Evaluate the relationship between trade volumes and economic growth.
- Examine how rising tariffs and trade policy uncertainty influence the effectiveness of agreements.
6. Methodology
6.1 Research Design
A descriptive-correlational-comparative design. The descriptive and correlational components draw on secondary data to outline broad trade-growth patterns; the comparative component contrasts cases differing in institutional quality, development status, agreement type and tariff environment.
6.2 Nature of the Research
Mixed-methods: qualitative thematic analysis of policy documents and journal articles, combined with quantitative secondary data and existing gravity-model estimates, comparing developed and developing countries along with the effect of tariffs.
6.3 Sample and Sampling Technique
The population is countries that participate in international trade and have available data on trade volumes, growth, agreements, tariffs and institutional quality. Purposive (judgmental) sampling selects countries by data reliability and WTO/FTA/RTA membership information, to represent developed and developing countries. The study period is 2000–2024, with the period after 2018 examined separately.
6.4 Data Collection Tools
Secondary data from the World Bank Development Indicators, WTO, UN and CEPII. A structured extraction sheet records: country and year, trade agreement status, trade volume, growth indicators, tariff rates, institutional indicators, and control variables.
6.5 Variables Used
- Dependent: Economic growth, measured by annual GDP growth or real GDP per capita growth.
- Independent: Trade volume, measured by total exports and imports or bilateral trade value.
- Control: WTO membership; FTA participation; RTA participation; trade openness (exports plus imports to GDP); tariff rate; post-2018 tariff period.
6.6 Ethical Considerations
- Publicly available secondary data only; no human participants, interviews or personal information.
- All data sources acknowledged and cited.
- Analysis conducted objectively, without presenting results to support a predetermined conclusion.
- Software, databases or statistical procedures identified where necessary.
6.7 Limitations
- Institutional-quality indicators are composite measures and may contain subjectivity or measurement error.
- Missing or inconsistent data may reduce sample size.
- Results show statistical associations and may not capture all political, historical and social factors.
- External shocks may distort trends independently of the agreements studied.
7. Data Analysis and Interpretation
This section examines the relationship between trade agreements and economic growth, with emphasis on WTO membership, FTAs, RTAs and tariff changes.
7.1 Trade Volumes and Economic Growth
GDP, bilateral trade and distance data for India, USA, China and Russia are used to calculate a Gravity Index for six bilateral relationships in 2000 and 2024.
Model: GIij = GDPi × GDPj / Dij, where GDPi and GDPj are the exporter’s and importer’s GDP and Dij is distance in km. A higher index indicates greater potential for bilateral trade.
Example (India→USA, 2000): GDP India = $468,395,521,654.46; GDP USA = $10,250,952,000,000; distance 11,761.81 km; actual trade $9,304,913,801 → GI ≈ 4.08×10²⁰. 2024: GDP India = $3,760,813,470,500.86; GDP USA = $29,298,013,000,000; actual trade $79,441,705,218 → GI ≈ 9.3680×10²¹. Since distance is constant, the increase is primarily associated with GDP growth.
| Pair | Distance (km) | Gravity Index 2000 | Gravity Index 2024 |
|---|---|---|---|
| India–USA | 11,761.81 | 4.0823 × 10²⁰ | 9.3680 × 10²¹ |
| India–China | 3,785.013 | 1.5144 × 10²⁰ | 1.8610 × 10²² |
| India–Russia | 4,341.881 | 2.8017 × 10¹⁹ | 1.8939 × 10²¹ |
| USA–China | 3,943.621 | 3.18 × 10²¹ | 1.3915 × 10²³ |
| USA–Russia | 7,517.972 | 3.5412 × 10²⁰ | 1.4656 × 10²² |
| China–Russia | 5,795.045 | 5.48 × 10¹⁹ | 1.2155 × 10²² |
The original per-direction tables (exporter/importer GDP and annual trade volume) are shortened here; see the PDF for the full figures. Larger economies generally have greater bilateral trade potential, while distance can restrict trade. Differences between Gravity Index and actual trade suggest institutional, political and trade-policy factors also matter.
Analysis and Interpretation
- USA–China has the strongest Gravity relationship in both years (3.18×10²¹ in 2000; 1.39×10²³ in 2024), and the highest total bilateral trade in 2024, about $669.19 billion.
- India–China shows the largest percentage increase among India-related pairs: about $2.30 billion in 2000 to $135.36 billion in 2024 (about 5,796.6%); Gravity Index 1.51×10²⁰ → 1.86×10²².
- India–USA also shows strong growth: $12.97 billion → $121.19 billion; GI 4.08×10²⁰ → 9.37×10²¹.
- India–Russia expanded considerably: $1.94 billion → $71.99 billion (about 3,616%); GI 2.80×10¹⁹ → 1.89×10²¹.
- China–Russia also grew strongly: $7.48 billion → $245.16 billion; GI 5.48×10¹⁹ → 1.22×10²².
- USA–Russia is the exception: GI rose from 3.54×10²⁰ to 1.47×10²², yet actual trade declined from about $6.74 billion to $3.80 billion.
Economic size is an important determinant of bilateral trade potential, and the index rose for all six relationships. The USA–Russia exception shows that size and distance alone cannot explain trade flows: political conditions, trade restrictions, institutional factors and other barriers can make actual trade deviate from the basic model’s prediction.
7.2 WTO Accession and Trade Volumes
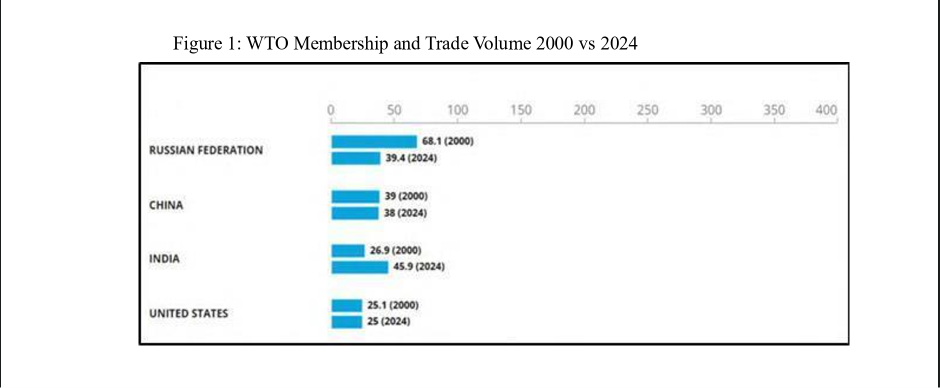
| Country | WTO status 2000 | Trade volume 2000 (% GDP) | WTO status 2024 | Trade volume 2024 (% GDP) |
|---|---|---|---|---|
| Russia | Non-member | 68.01 | Member | 39.42 |
| China | Non-member | 39.01 | Member | 37.96 |
| India | Member | 26.9 | Member | 45.9 |
| USA | Member | 25.1 | Member | 25 |
India recorded the largest increase among established WTO members, while China and Russia saw declines despite becoming members. The US remained almost unchanged at about 25%. The comparison does not establish a uniform positive relationship between WTO membership and trade volume, which provides a comparative perspective for Research Question 2: economic structure, domestic policies and institutional conditions may also shape trade patterns.
7.3 Impact of FTAs and RTAs on Trade Patterns
| Country pair | 2000 (US$ bn) | 2024 (US$ bn) | Change | Bilateral FTA/RTA |
|---|---|---|---|---|
| India–USA | 12.97 | 121.19 | 834.4% | Bilateral trade agreement, 2025 |
| India–Russia | 1.94 | 71.99 | 3616.1% | Bilateral trade agreement 2025 |
| USA–China | 68.34 | 669.19 | 879.2% | Recently reached a trade agreement in 2025 |
| USA–Russia | 6.74 | 3.8 | −43.7% | No formal bilateral trade agreement |
Source: Researcher’s compilation based on the bilateral trade dataset used in the study.
Trade grew substantially for India–USA, India–China, India–Russia and USA–China, while USA–Russia declined. The largest percentage increase was India–China, followed by India–Russia and USA–China. These changes cannot be attributed solely to FTAs or RTAs, as the selected pairs had no bilateral FTAs/RTAs in force during the comparison period; economic growth, trade policies, global demand and geopolitics may also have influenced them.
7.4 Tariff Trends Pre- and Post-2018
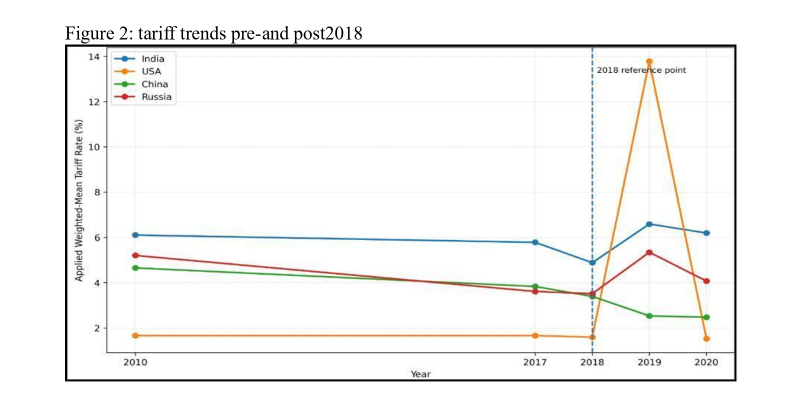
| Country | 2018 | 2019 | Trend |
|---|---|---|---|
| United States | 1.59% | 13.78% | Sharp increase |
| India | 4.88% | 6.59% | Increase |
| Russia | 3.51% | 5.34% | Increase |
| China | 3.39% | 2.53% | Decline |
Source: World Bank/WITS, based on UNCTAD TRAINS and WTO tariff data. The chart in the original covers 2010–2020 with 2018 as the reference point.
Tariff movements differed across the four countries rather than following a common pattern; the post-2018 environment was not a uniform increase.
8. Findings and Discussion
8.1 Quality of Institutions and Political Barriers (Objective 1)
US–Russia trade fell sharply even though its Gravity Index rose. Theoretical trade potential is greatly affected by geopolitical situation, institutional quality and domestic policies, which act as definite barriers to realizing trade.
8.2 Bilateral Trade Growth in the Absence of FTAs/RTAs (Objective 2)
WTO results are inconsistent: India’s trade-to-GDP ratio rose significantly after membership, while China and Russia saw declines after accession. Benefits depend greatly on accompanying domestic reforms and removal of hidden structural obstacles. Large increases in bilateral trade are entirely possible without formal FTAs or RTAs.
| Country pair | Status of FTA | Trade growth (2000–2024) |
|---|---|---|
| India & China | None in force | +5,796.6% |
| USA & China | None in force | +879.2% |
8.3 Gravity Model, Economic Growth and Trade Volumes (Objective 3)
The Gravity Index increased considerably between 2000 and 2024, due to the huge GDP expansion in these countries, confirming that large economies tend to have high theoretical trade potential.
8.4 Tariff Volatility and Trade Policy Uncertainty (Objective 4)
Weighted-mean tariffs from 2010 to 2020 show that the rise of protectionism after 2018 was highly asymmetrical. When tariffs are volatile, multinational companies move production to developing countries (such as India, Vietnam and Mexico), shifting and reorganizing global value chains.
8.5 Key Insight
Modern global trade is increasingly shaped not just by tariffs and agreements on paper, but by institutional strength, geopolitical stability and global supply chains.
9. Conclusion
International trade is shaped by far more than trade agreements alone. The Gravity Model remains a useful predictor of theoretical potential, but real-world outcomes are significantly influenced by institutional quality, political barriers and domestic policies, as the USA–Russia case shows. Mixed WTO results highlight that formal institutions are insufficient without accompanying reforms, as seen in India’s rising trade-to-GDP ratio compared with declines in China and Russia. The extraordinary growth in trade between countries without FTAs in force, such as India–China’s 5,796.6% increase, underscores market-driven dynamics operating independently of formal agreements.
Tariff volatility shows that protectionist measures tend to redirect rather than diminish trade, reorganizing global value chains. Modern agreements need to evolve beyond tariff reduction towards “deep” integration: non-tariff barriers, digital trade, investment frameworks and supply-chain resilience. The future of global trade will depend less on traditional agreements and more on institutional adaptability, policy stability, and economies’ capacity to integrate across multiple dimensions of globalization.
10. Policy Recommendation
- Strengthen institutions and governance. More transparency, less red tape, simpler regulation, anti-corruption measures, and diplomatic confidence-building to reduce political risk. Supported by the USA–Russia case.
- Rethink the role of WTO membership. Pair it with domestic reforms and push for WTO modernization on non-tariff barriers and digital trade, given China’s and Russia’s declining trade-to-GDP ratios versus India’s rise.
- Manage trade volatility and policy uncertainty. Stabilize tariff policies and encourage multinationals to diversify supply chains across developing economies (India, Vietnam, Mexico).
- Enhance global value chain resilience. Incentivize logistics and infrastructure investment in developing nations, reflecting the shift of production to Vietnam, Mexico and India after the 2018 US–China tariff escalation.
- Move towards comprehensive agreements. Include digital trade frameworks, investment protections and supply-chain resilience clauses, formalizing market-driven gains such as India–China’s rather than relying on organic growth alone.
11. References
- Anderson, J. E., & van Wincoop, E. (2003). Gravity with gravitas: A solution to the border puzzle. American Economic Review.
- Baier, S. L., & Bergstrand, J. H. (2007). Do free trade agreements actually increase members’ international trade? Journal of International Economics.
- Beverelli, C., Neumueller, S., & Teh, R. (2015). Export diversification effects of the WTO Trade Facilitation Agreement. World Development.
- Cheong, J., Kwak, D. W., & Tang, K. K. (2014). The effects of WTO membership on trade: A structural gravity approach. The World Economy.
- Frankel, J. A., & Romer, D. (1999). Does trade cause growth? American Economic Review.
- Go, D. S., & Mitra, P. (1998). Trade liberalization, fiscal adjustment, and exchange rate policy in India. World Bank Report.
- Goniewicz, K., et al. (2020). Current Response and Management Decisions of the European Union to the COVID-19 Outbreak: A Review. Sustainability, 12(9), 3838. doi
- Hannan, S. A. (2016). The impact of trade agreements: New approach, new insights. IMF Working Paper No. 16/117.
- Harrison, G. W., Rutherford, T. F., & Tarr, D. G. (1997). Quantifying the Uruguay Round. The Economic Journal.
- Helpman, E., Melitz, M. J., & Rubinstein, Y. (2008). Estimating trade flows: Trading partners and trading volumes. Quarterly Journal of Economics.
- How do trade agreements influence the economy? – Video Drome News. link
- Hu, J. (2003). Legal certainty in the WTO system. Journal of International Economic Law.
- IMF. (2016). World economic outlook: Too slow for too long. IMF Report.
- Larch, M., Monteiro, J.-A., Piermartini, R., & Yotov, Y. V. (2019). On the effects of GATT/WTO membership on trade. WTO Staff Working Paper ERSD-2019-09.
- Larch, M., Yotov, Y. V., Beverelli, C., Gourevich, I., Heiland, I., & Keck, A. (2023). Trade and welfare effects of the WTO Trade Facilitation Agreement. WTO Staff Working Paper ERSD-2023-04.
- Manger, M. (2014). The Economic Logic of Asian Preferential Trade Agreements: The Role of Intra-Industry Trade. Journal of East Asian Studies. link
- Mbulawa, S. (2015). Effect of Macroeconomic Variables on Economic Growth in Botswana. link
- Murakami, Y. (2025). Do deep regional trade agreements facilitate regional production networks in Latin America and Caribbean countries? Review of World Economics.
- Nasir, M., & Redmond, T. (2020). Role of Natural Resource Abundance, International Trade and Financial Development in the Economic Development of Selected Countries. doi
- New Development Platforms: Conflict and Opportunity – thediplomaticaffairs.com. link
- Ngo, Q. D., Nguyen, Q. H., & Toan, P. N. (2025). Assessing the impact of the European Union–Vietnam free trade agreement on labor market and employment in Vietnam. International Journal of Social Economics, 52(7), 1068. doi
- Piermartini, R., & Yotov, Y. V. (2016). Estimating trade policy effects with structural gravity. WTO Staff Working Paper ERSD-2016-10.
- Rodríguez, F., & Rodrik, D. (2001). Trade policy and economic growth: A skeptic’s guide to cross-national evidence. NBER Macroeconomics Annual.
- Rose, A. K. (2004). Do we really know that the WTO increases trade? American Economic Review.
- Rotunno, L., & Ruta, M. (2025). Trade partners’ responses to US tariffs. IMF Working Paper No. 2025/147.
- Sachs, J. D., & Warner, A. M. (1995). Economic reform and the process of global integration. Brookings Papers on Economic Activity.
- World Bank. (2004). Zambia: Country economic memorandum—Policies for growth and diversification. Report No. 28069-ZA.
- Silva & Tenreyro (2006), Kutlina-Dimitrova & Lakatos, Campos et al., Faiqoh et al. and WTO (2023). link