Authors: Varshita Jain, Aayan Mendiratta, Prakriti Priyal
Abstract
This study looks at how international trade agreements and the amount of trade between countries affect the economy and how stable it is. It uses information from 267 countries from 1960 to 2024 to see how trade openness affects the growth of a country’s economy. The study uses numbers and real-life examples to understand this relationship. It finds that trade openness and economic growth are not closely linked. However, trade does help make the economy more stable and better able to handle problems over time. Therefore, trade supports sustainable long-term development but is not the only driver of economic growth. International trade agreements and trade volumes support growth and reduce economic volatility.
Keywords: International trade, Trade agreements, Trade openness, Trade volume, Economic growth, Trade openness, Funnel effect, Endogenous growth theory, India-UAE CEPA, Trade liberalization, Empirical analysis, Institutions, Volatility.
Introduction
The modern world relies extensively on trade. After WWII global trade expanded as globalization intensified rapidly. Countries have become more economically interdependent. This led to extensive research on whether international trade contributes to economic growth or not. The foundation of modern trade theory was given by Adam Smith (Smith, 1776) and further developed by David Ricardo (Ricardo, 1817). In the 21st century, the global trade environment had a lot of major transitions. The COVID-19 pandemic accelerated the reconfiguration of the global supply chain, causing firms to expand their production lines beyond China to countries like India, Vietnam, Mexico (World Trade Organization [WTO], 2021). Rising Economic Nationalism was reflected in measures such as the Liberation Day Tariffs (The White House, 2025), and India’s Aatmanirbhar Bharat initiative has reshaped international trade. Emerging economies in the 21st century, such as India, China, Brazil, Indonesia have become increasingly influential in global trade. This transition has reduced the hegemony played by the United Kingdom, United States and Soviet Union.
Post World War 2, rapid expansion of global trade pushed countries to build regulated framework for the sustainability of trade. The General Agreement on Tariffs and Trade (GATT) was established in 1947 to reduce trade barriers and discourage protectionism, and promote predictable rules for international trade (General Agreement on Tariffs and Trade, 1947). In 1995, WTO succeeded GATT as the primary institution governing international trade while retaining the GATT agreements within the framework (World Trade Organization, 1995). Between 1955 to 2008 global merchandise trade grew at the rate of 6% YoY , outpacing the global GDP growth rate (World Trade Organization, 2008). This encouraged the participation of countries like India, China, Brazil, ASEAN countries, strengthening the trade ecosystem.
Due to the massive expansion of trade, and the transitions of frameworks, the trade volumes between countries expanded massively, which raised a question amongst economists and scholars. Did the increase in trade volume amongst countries accelerate a country’s economic growth? Trade agreements represent the de jure policy institutional frameworks such as tariff reductions, and non-tariff barrier (NTA) removals (Fontagné et al., 2023). In contrast, trade volume reflects the de facto realised physical and monetary flows from both policy liberalisation and market size. Distinguishing between these two concepts is important because trade agreements do not automatically lead to immediate or uniform increases in trade volume. While Frankel and Romer (1999) show that actual trade flows can significantly boost income per capita, Chang, Kaltani & Loayza (2009) point out that trade agreements need supporting domestic institutions, like educational infrastructure, financial depth and governance, to turn policy access into real volume and output growth. Measuring individual legal treaties quantitatively across multiple entities presents significant endogeneity and measurement challenges. Therefore, this study uses trade openness (Trade % of GDP) as a practical proxy to assess the economic effects of trade integration and agreements over time.
The extent to which these developments contribute to economic growth is widely debated, even after the rapid expansion of international trade and rising sophistication of trade agreements. The differences in institutional capacity, agreement design, and national economic conditions suggest the need for further research. Trade agreements are expected to affect economic growth by reducing trade barriers, encouraging investments, promoting technology transfer, and improving productivity through increased international economic integration. Therefore, this study examines how international trade agreements and trade volumes influence economic growth and explores the mechanisms through which trade contributes to long-term economic development.
Literature Review
1. Theoretical Foundations: Trade as a Channel for Growth
Modern macroeconomic theory presents different views on how trade influences domestic growth. Neoclassical Growth Theory (Solow, 1956) sees trade as a way to speed up capital accumulation by reducing the cost of imported capital goods. However, Solow’s model views the growth from trade as only temporary. Due to diminishing returns to capital, trade openness cannot permanently change a country’s long-term growth rate without exogenous technological progress.
In order to overcome Solow’s limitations, Endogenous Growth Theory (Romer, 1990; Grossman & Helpman, 1991) redefines trade as not only a physical exchange of goods, but as an important channel for non-rival knowledge spillovers and technological transfers. Within this framework, open trade corridors enable middle-income and developing countries to absorb foreign technology, adopt advanced organisational practices, and overcome diminishing returns, permanently lifting long-run productivity growth. But both neoclassical and endogenous frameworks assume smooth supply chains and frictionless market clearing, so neither can explain physical disruptions where the collapse of supply chains breaks technological spillovers regardless of openness to policy.
Conversely, Structuralist and Keynesian models (A.P. Thirlwall, 2000) challenge supply-side growth assumptions by focusing on balance-of-payments constraints and demand dynamics. Thirlwall argues that steady export growth is vital because it provides the foreign exchange needed to pay for capital imports without causing balance-of-payments crises. Additionally, Thirlwall compares unilateral trade dismantling to Regional Trade Agreements (RTAs). He finds that unilateral openness pushes domestic industries to compete globally while avoiding the trade-diversion losses that come with preferential trading blocs.
This older theoretical view can be updated with a more recent UN synthesis. UN DESA (2023) still treats international trade as an engine for development, but it makes the point more carefully: trade contributes the most when it is backed by supporting policies, infrastructure, an educated workforce, productive employment, and broader institutional support tied to sustainable development goals. In that reading, trade volumes by themselves are not enough. The development effect depends on whether trade is connected to structural transformation, diversification, job creation, and social protection rather than being treated as a stand-alone policy tool.
2. Empirical Testing of the Trade-Growth Link
Frankel and Romer (1999) took this theoretical groundwork and tried to test it, confronting the reverse-causality problem head on: is it trade that drives growth, or do wealthier economies just trade more anyway? Their solution was to instrument trade using geography, land area, and distance from borders, variables that affect trade without being affected by income. The result: a one-percentage-point increase in trade as a share of GDP was associated with a 0.5 to 2 percent gain in per capita income. But the drawback is that the model depends on country averages, so it can’t account for country-specific flaws and shocks that can undermine even geographic advantages.
Later reviews built on this empirical base rather than narrowing it. Lewer and Van den Berg (2003) pulled together the broader trade-growth literature and found the same basic pattern holding up: roughly a one-fifth percentage-point rise in economic growth for every one- percentage-point rise in export growth. Their review is mostly cited as confirmation that trade matters for long-run development across a wide range of country contexts, not as a methodological departure from what came before. Tarlok Singh’s (2010) findings point in the same direction but add a wrinkle: trade does generally support growth, but by how much depends heavily on the country, on how integrated its economy already is with global markets, and on how central trade is to it. Singh also notes it is genuinely hard to separate the effect of trade policy from other reforms running alongside it, so trade openness alone probably cannot explain the full growth story.
More recent evidence shifts the empirical discussion forward. Fontagné, Rocha, Ruta, and Santoni (2023), using structural-gravity methods and a general-equilibrium framework, show that deeper trade agreements produce meaningfully larger trade effects than shallow ones, and estimate that deepening existing agreements could raise world trade by 3.9 percent and world GDP by 0.9 percent. This matters because it moves the argument beyond the older yes-or-no question of whether trade helps growth, and toward the more specific question of what kind of agreement and what kind of institutional design produce those gains.
A newer re-estimation by Domínguez Blancas and Ángeles Castro (2024), using data from 1980 to 2022 across 102 countries, also argues against any universal trade-growth formula. Their results show that the impact of trade varies across countries and over time, with weaker outcomes in poorer contexts and a strong dependence on underlying domestic conditions. Taken together, the newer empirical work keeps the classic evidence in place, but it makes clear that the size and direction of trade’s gains depend far more on institutions and surrounding conditions than the earlier literature often implied.
3. Institutions, Geography and the Limits of the Trade-First View
Rodrik, Subramanian, and Trebbi (2004) pushed back on the trade-first story, putting geography, trade integration, and institutional quality into the same framework to see which one survived. Institutions won, decisively. Once property rights, rule of law, and governance are controlled for, trade’s independent effect on income basically disappears statistically, a result that lines up with Acemoglu, Johnson, and Robinson (2001) earlier work on colonial- era institutions and development. Their instrument, historical settler mortality, has been picked apart methodologically more than once, but it still shifted a large part of the development literature toward governance reform as the real lever for income. One thing this research tends to skip is that strong institutions are sometimes built to control a geographic chokepoint, a nuance a case study probably shows better than a regression.
4. Trade Openness, Volatility and Shocks
A different set of papers asks not whether openness raises average output, but what it does to its stability. Di Giovanni and Levchenko (2009) found that as global integration pulls sectors out of the domestic economy, it also pushes them toward excessive specialization, leaving each sector more exposed to global demand shifts. Bems, Johnson, and Yi (2011) ask why trade volumes fell so much faster than GDP during the 2008 downturn, tracing the collapse to a composition effect running through vertically integrated supply chains. Put the two together and the implication is uncomfortable: the same things that make trade an efficient growth channel are what let shocks move fast across borders.
The WTO’s World Trade Report 2021: Economic Resilience and Trade helps bring that discussion into more recent crises. It debates that trade can both spread shocks and help countries prepare for recover from them, with the final effect depending on initial conditions, diversification, and policy choices. The report also stresses that trade turned out to be an economic lifeline during COVID-19 by keeping critical goods moving, while restrictive and nationalist responses often made disruption worse rather than better. So openness is not simply a source of vulnerability or a source of safety. It can buffer or amplify crisis effects depending on how diversified supply networks are and how governments respond once a shock hits.
5. Regional Trade Agreements and Growth Outcomes
A considerable body of work narrows the focus from trade in general to specific regional and preferential agreements. Arisman, Al Arif, and Harahap (2021), comparing D-8 member countries against non-D-8 OIC countries, found that participation in the D-8 cooperation framework supported growth, with stronger effects where political stability, export performance, population size, and the Human Development Index were more favorable. This suggests that the agreement worked best under supportive domestic conditions.
Itakura (2022) models the Regional Comprehensive Economic Partnership (RCEP) through a computable general equilibrium simulation and finds substantial gains for member economies, with total real GDP gains for RCEP members estimated at 675 billion dollars and ASEAN gains at 160 billion dollars. This suggests that regional agreements can generate substantial economic effects, however those effects still differ across countries and depend on the structure of the agreement.
Rahman, Sultana, Sultana, and Afzal (2024) provide a more cautious ASEAN-focused perspective using data from 1990 to 2019 and dynamic panel GMM. Their findings show that intra-ASEAN trade did not significantly outperform inter-ASEAN trade, while ASEAN’s trade shares increasingly shifted toward partners such as China and India. This implies that regional agreements do not automatically translate into stronger internal trade and that their effectiveness depends on trade diversity, implementation quality, and competitiveness within the bloc.
Research Gap
There remains a persistent empirical and conceptual gap in understanding how international trade and trade agreements affect both growth and stability when effects vary by institutional quality, agreement depth, and exposure to global production networks. Existing studies often estimate average trade–growth or trade–volatility effects across countries, producing aggregation bias that masks conditional results across institutional contexts, RTA content, and crisis types. Empirical work has not yet fully mapped how (a) the depth and content of RTAs, (b) domestic institutional capacity and social-protection complements, and (c) participation in global value chains jointly determine whether trade and agreements promote inclusive growth or amplify shocks. This study addresses that gap by using a macro-historical panel to estimate heterogeneous and non-linear effects of trade volumes and RTAs on growth and stability across differing institutional and geographic contexts.
Research Design & Methodology
The research design is longitudinal panel-data in nature, analysing macroeconomic trends for countries and regions across a continuous 64-year period from 1960 to 2024. By combining cross-sectional country observations with time series, the paper aims to evaluate patterns in global trade integration and understand how national performance and macroeconomic stability respond to trade shocks over time. The analysis relies on secondary data sources to ensure structural consistency and cross-country comparability.
Data and Sources
Data for the annual Gross Domestic Product (GDP) growth rates and trade volumes are retrieved from the World Bank Open Database, specifically the World Development Indicators (WDI). The final dataset comprises 267 countries and regions, compiling a comprehensive panel stack of 15,104 country-year observations with zero missing or null values after data screening.
The primary independent variable measuring trade openness was constructed as trade-to-GDP ratio by averaging the total value of a nation’s exports and imports of goods and services as a percentage of GDP. The dependent variable which tracks the domestic economic performance and output volatility is measured using the standard annual percentage growth rate of GDP.
Theoretical Framework
To understand the relationship between international trade agreements and the economic growth of countries, it is important to know about the two conflicting dynamics in macroeconomic theory. The debate surrounding how international trade shape a domestic economy requires looking beyond simple linear assumptions, tracing a line from classical economic foundations to modern vulnerability frameworks.
The classical trade theories of economists like Adam Smith and David Ricardo suggest that international trade is a baseline pipeline for growth. This is because countries can manipulate comparative advantages and maximise allocation efficiency and the market size. Moving this to a neoclassical framework, the Solow Growth Model shows that trade openness can speed up capital accumulation by lowering the cost of imported capital goods and expanding investment opportunities. However, according to the Solow model, this growth is limited by diminishing returns to capital. This means that trade openness offers a temporary growth boost, but it cannot permanently change a nation’s long-run steady state growth rate without ongoing technological progress from outside forces.
To bridge this limitation, Romer’s Endogenous Growth Theory demonstrates that trade is not merely an exchange of physical goods or capital inputs, but a necessary step for non-rival knowledge spillovers. In Romer’s framework, open trade corridors allow developing and middle-income nations to pick up foreign technological innovations, adopt advanced organizational practices, and overcome diminishing returns, boosting long-run domestic productivity through international spillovers.
These foundational growth models are an excellent framework to understand long-term wealth accumulation, but they often treat economic expansion as a smooth, uninterrupted upward trajectory. In order to understand economic stability rather than just average income, we must look at how trade changes a country’s exposure to risk. This exposure operates through 2 different channels. The first of these is the stabilizing channel, also conceptualised as portfolio diversification effect. Being deeply connected to global markets can act as a hedge or highly open economies, and by selling across many different foreign countries, a nation diversifies its customer base. This can insulate its domestic industries from purely local downturns.
This identical integration is also given by an opposing mechanism known as the vulnerability channel, which transforms a country’s trade infrastructure into an instant conductor for global trouble. During a major international crisis, shocks move rapidly across borders through tightly linked supply chains, consequently, dragging down trade and growth together.
By balancing these two channels, this framework moves past simple linear assumptions. It sets up the core focus of this paper, providing the exact theoretical lens that is required to evaluate how trade flows, which ultimately reshapes national growth, geographic stability and crisis resilience over time.
Econometric Method
The study includes such variables as Country, Year, GDP Growth (annual %), and Trade as percentage of GDP (export + import). Since tracking individual treaties quantitatively has endogeneity and measurement challenges across a broad macro-panel, the study uses trade openness (trade percentage of GDP) as an operational proxy to evaluate the impact of international trade integration and agreements.
The research has selected Python 3 version as a preferable programming language for calculations. The data has been analyzed using Google Colab platform, where data exploration and preparation to research have been done using Pandas Python library. The number of null values and general description of data have been studied.
Firstly, the research question was addressed by plotting the distribution of GDP Growth and Trade openness for all observations in histograms to study the frequency distribution of these variables and identify outliers or rare events. Further, the scatter plot with a regression line was drawn to observe the association between trade openness and economic growth. Secondly, Pearson correlation coefficient was calculated to understand the degree of relationship between economic growth and trade openness. Thirdly, to see the development tendency of the two variables, a time-series plot was created, displaying averages of trade openness and economic growth in percentages for 1960-2024.
The plot highlights an economic growth decline during COVID-19 pandemics of 2020 and the Global Financial Crisis of 2009. Further, the research analyses the trade intensity distribution by countries by calculating averages of trade to GDP ratios for all countries for the whole period. A bar chart displaying ten largest countries and the rest highlights the level of heterogeneity between ten largest countries and the rest.
Lastly, the data has been visualized using the Matplotlib and Seaborn Python libraries, resulting in different plots explained in data interpretation. After examining the association between international trade and economic growth, the researcher presented conclusions and recommendations. All computations were performed in Python programming language using Pandas, Seaborn, and Matplotlib packages. This research can be considered exploratory longitudinal panel data analysis since its main purpose is to examine the possible association between trade openness and economic growth.
Data Analysis
How Is GDP Growth Distributed?
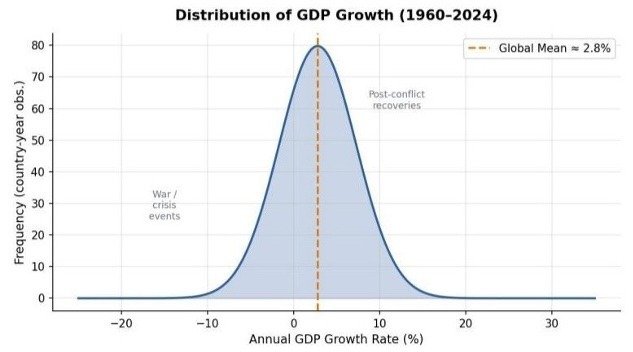
Figure 1: Distribution of Annual GDP Growth Rates (1960-2024)- World Bank WDI Data
The global distribution of annual GDP growth from 1960 to 2024, if charted then it would be what statisticians call a leptokurtic distribution. This means that most country-year observations are tightly clustered around a sharp, tall central peak of growth from 0% to 5%, yielding a global mean of about 2.8%. But it also has fat tails on both sides, meaning that global averages can hide extreme economic realities. At the extreme right, post-conflict recoveries and resource booms occasionally push annual growth rates above 50%, e.g., Kuwait’s post-Gulf War rebound. On the far left, acute crises, wars, and severe economic shocks pull contractions to as low as -65%, typically for small island nations or economies torn by conflict.
How Trade-Open Are Most Economies?
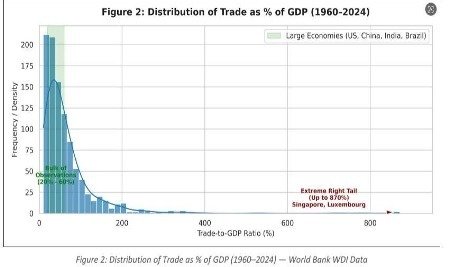
Figure 2: Distribution of Trade as % of GDP (1960-2024)- World Bank WDI Data
Trade openness is strongly right skewed. The observations are mostly at relatively modest levels. Large domestic economies such as the USA, China, India and Brazil naturally have lower trade-to-GDP ratios of between 20% and 60% as their large internal markets absorb most economic activity. The long extreme right tail of the distribution, on the other hand, extends to 870%. This tail comprises small, strategically-placed geographies, city-states and transit hubs, such as Singapore, Luxembourg and Djibouti.
The Funnel Effect: Trade vs. GDP Growth
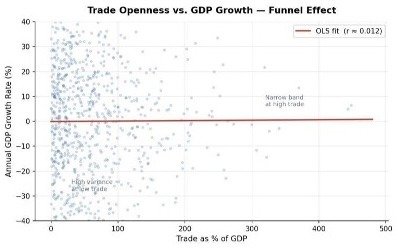
Figure 3: Trade Openness vs. GDP Growth- Illustrating the Variance-Reducing “Funnel Effect”
When plotted against annual GDP growth, trade openness reveals a dramatic “funnel effect” rather than a simple, upward-sloping relationship. At lower levels of trade openness (0% to 100% of GDP) economic outcomes are wildly dispersed. There is extreme volatility with massive booms and catastrophic collapses. As trade openness goes above 100%, this variance falls down dramatically. The economies that trade the most are tightly clustered in a narrow band between 0% and 5% growth. The overall Pearson correlation line is almost flat with a negligible r = 0.012, but the physical shape of the data cloud suggests that high trade integration is more a volatility dampener than an accelerator of growth.
Correlation Matrix
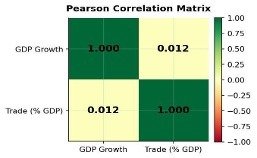
Figure 4: Pearson Correlation Matrix — GDP Growth and Trade (% of GDP)
The Pearson correlation between trade openness and GDP growth across all 15,104 observations is approximately zero (r = 0.012). This does not mean that trade is irrelevant, instead it signals that a relationship washes out. The four forces are explained by the flat number: averaging across 267 unequal economies cancelling opposing effects; trade agreements act with a five to ten year lag rather than an instant boost; reverse causality means growing economies attract trade as much as trade drives growth; and large low trade economies like the U.S. and China dominate the sample numerically. Panel regressions with country fixed effects consistently find a positive, significant trade growth effect, so r = 0.012 is a statistical artefact, not an economic conclusion.
Six Decades of Trade and Growth
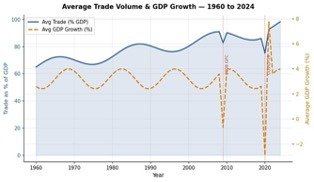
Figure 5: Average Global Trade Volume & GDP Growth (1960–2024) – with Crisis Markers
Global trade openness climbed steadily, from 65% of GDP in 1960 to nearly 95% by 2008.The growth rate of GDP did not move the same way. It stayed inside a band of 2-5%, which tells you growth is structurally stickier than trade. But the years 2009 and 2020 broke this pattern and they dropped hard. In 2009, the Global Financial Crisis hit trade finance and global value chains before it hit domestic demand. Credit dried up, shipments got delayed or cancelled, and trade fell faster than the broader economy. Then in 2020 because of COVID cross border logistics was closed overnight. Because of this, the result was the sharpest contraction anywhere in the dataset, followed by a rebound in 2021.The fact that trade and growth collapse together specifically during crises, and not during normal years, is the real evidence here. It suggests trade acts as a channel that transmits shocks through the economy.
The Most Trade Intensive Economies in the World
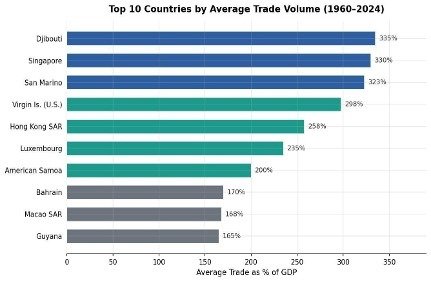
Figure 6: Top 10 Countries by Average Trade Volume (% of GDP) – World Bank WDI Data
|
Rank |
Country / Territory |
Avg. Trade (% GDP) |
Economic Characteristic |
|
1 |
Djibouti |
~335% |
Strategic Horn of Africa port and re-export hub |
|
2 |
Singapore |
~330% |
Global entrepôt; world’s busiest container port |
|
3 |
San Marino |
~323% |
Landlocked microstate embedded in Italy’s economy |
|
4 |
Virgin Islands (U.S.) |
~298% |
Oil refinery and tourism-driven trade flows |
|
5 |
Hong Kong SAR |
~258% |
Asia’s premier financial and trade gateway |
|
6 |
Luxembourg |
~235% |
EU financial hub with large financial services exports |
|
7 |
American Samoa |
~200% |
U.S. territory; tuna canning dominates exports |
|
8 |
Bahrain |
~170% |
Gulf financial centre and oil transit point |
|
9 |
Macao SAR |
~168% |
Gaming & tourism-driven services exports |
|
10 |
Guyana |
~165% |
Recent oil discovery dramatically boosted trade flows |
The average trade to GDP ratios for countries, ranked from highest to lowest, show that all of the top 10 nations are either city states (Djibouti, Singapore), island states (U.S. Virgin Islands) or geographically defined choke points (San Marino, Hong Kong and Luxembourg). Each of these have a trade to GDP ratio of around 165-335%. These are primarily entrepot economies based upon the export and import of goods; they provide financial and logistical services rather than engaging in production based domestic manufacturing. Therefore, these high ratio values reflect how these nations’ geographic characteristics influence their role within the world economy (e.g., the small size of their internal markets causes a mechanical increase in their overall trade to GDP ratio; and strategically located ports or as financial hubs create an economic structure that encourages these nations to serve as intermediary links within international trade.)
Key Insights & Interpretation
Globalisation Has Doubled Trade Openness
From the long-term time-series data we find that the average global trade openness has been through a structural change, approximately doubling from about 65% of the GDP in 1960 to a maximum of over 90% in 2008. This path is not random, but rather a reflection of economic history. It is a direct mirror of successive waves of global liberalization, including the transition from GATT to the WTO, China’s accession to the WTO in 2001, and the rapid expansion of regional free-trade agreements.
Trade Agreements Drive Structural Shifts, Not Short-Term Boosts
The average correlation between trade and growth is close to zero (r = 0.012), which suggests, trade agreements do not cause immediate short-term spikes in GDP. In economic theory, changing a nation’s landscape takes time through trade policies. The data suggest that increases in trade openness are durable as agreements gradually build domestic export capacity, reorient international supply chains, and change the course of foreign direct investment. Structural shifts tend to be cumulative over 5 to 10 year horizons, with macroeconomic benefits heavily lagged and hidden in simple year-on-year data.
Trade Reduces GDP Volatility in Open Economies
The findings obtained in the case of funnel effect prove international trade theory about diversification. The economies that have high levels of openness in international trade operations have low levels of volatility in GDP since they are together in global value chains. Through dispersing their economic activities through many international markets, hub economies like Singapore and Hong Kong protect themselves from any shocks that may affect them within the domestic area.
Global Crises Are Transmitted Through Trade
Trade has been confirmed to be an active transmission mechanism of global shocks by both the 2009 and 2020 trade declines. Trade shock can quickly propagate throughout networks because supply chain connections are highly interconnected, resulting in trade contracting faster than G.D.P. during a crisis; therefore, trade exposure should be treated as a risk channel when developing a plan for enhancing trade-related resilience rather than merely an opportunity.
The Entrepôt Model Works, But Isn’t Universally Replicable
The economic success of Singapore, Luxembourg and Hong Kong shows how increasing trade can be a key to long term economic development. As their per capita GDP is over $65,000 (Singapore alone is at $64,625), they have clearly done well in this respect. The reasons for this are three fold; strategic geographic locations, high quality legal systems and first class infrastructure. These are all factors which many of the larger, land mass based countries do not have access to as part of their business environment. This makes it difficult to replicate the Hong Kong-Singapore-Luxembourg model across other parts of the globe.
Aggregate Correlation Masks Heterogeneous Relationships
The headline r = 0.012 represents an artifact of combining data from 267 structurally different countries. It does not represent evidence that trade and economic growth do not have a causal relationship. On the contrary, panel data analysis methods allow researchers to isolate the impact of trade on economic growth while controlling for country specific variables (country fixed effects) which will produce a statistically significant correlation between trade and economic growth.
Discussion: Case Studies
Case Study 1: India-UAE Comprehensive Economic Partnership Agreement (CEPA)
The India-UAE Comprehensive Economic Partnership Agreement was implemented on May 1, 2022, where tariffs for 80-90 percent of traded goods were slashed. This is India’s first Comprehensive Economic Partnership Agreement with a Gulf Cooperation Council state, thus proving that trade agreements have long-lasting impacts on economic growth. In FY 2022-23, bilateral trade between India and the UAE rose to $84 billion, a 16 percent increase from $73 billion in FY 2021-22, and exceeded $100 billion for the second consecutive year, reaching $101.25 billion in FY 2025-26 (Asianet Newsable, 2026). Non-oil trade constitutes about two-thirds of this volume, with benefits extending beyond energy exports to gems, engineering goods, electronics, and agriculture. From April to December 2025, FDI from the UAE to India amounted to $2.45 billion (Deccan Chronicle, 2026) . Both nations aim for $200 billion in bilateral trade by 2032, expecting continuous growth from the agreement’s impacts.
Additionally, the agreement serves as an entrepot mechanism. Officials in the UAE refer to it as a “gateway” to Africa, other countries in the wider Gulf region, members of the Commonwealth of Independent States and some European countries.
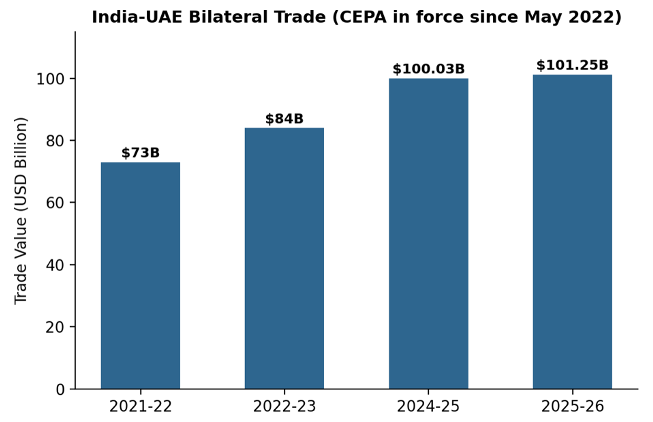
Figure 7: India-UAE bilateral trade growth since CEPA (2022-2026)
Case Study 2: Vietnam’s FTA Network and the 2025 Tariff Shock
Vietnam exemplifies various economic mechanisms, with trade openness rising from 19% of GDP in 1988 to 184% in 2022, making it Asia’s second-most open economy after Singapore. The country has signed 17 Free Trade Agreements including CPTTP, EVFTA, and RCEP, reducing average tariffs on manufactured goods from 16.6% to 1.1% and connecting Vietnam to 87% of world GDP through trade. Between 1992 and 2018, GDP per capita nearly quintupled, and poverty rates fell from 52.9% to around 2%. Post-WTO accession in 2007, FDI grew at an annual rate of 13.1%. This is the long term structural benefit associated with sustained openness, created over many years through the accumulation of individual agreements; it could never be achieved by simply relying on one agreement.
In 2025, Vietnam faced U.S. tariffs from zero to 46 percent, eventually lowered to 20 percent (CNBC, 2025). Additionally, products transiting from third-party countries like China faced tariffs up to 40 percent. This situation represents Vietnam’s vulnerability, as its trade connections that helped economic growth also expose it to risks in a global trade war, given its role as a manufacturing hub. Despite these challenges, Vietnam achieved a GDP growth rate of 8.02% in 2025 (Vietcetera, 2026) and aims for 10% annual growth from 2026 to 2030 (VnEconomy, 2026) by pursuing new free trade agreements with Middle Eastern, Latin American, and African nations. This reduces dependency on a single market and showcasing trade resilience strategies.
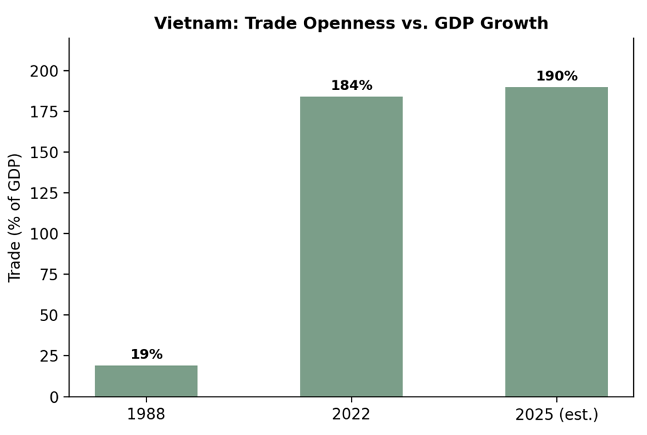
Figure 8: Vietnam’s trade openesss, 1988 vs. 2022 vs. 2025 estimate
Case Study 3 : The EU Single Market
The EU Single Market is a strong case for the trade-volume-to-growth link because it represents decades of deep, consistent integration with comparable data. Using a synthetic control method against a counterfactual of non-member states, researchers found significantly higher real GDP per capita for the overall Single Market area- around 12% to 22% (Springer, 2021), with smaller member states benefiting somewhat more than larger ones.
On trade volumes: intra-EU trade in goods more than quadrupled between 1994 and 2015, rising from €800 billion to €3,063 billion per year, while intra-EU exports grew from 9% to 21% of EU GDP since 1992. A more recent European Commission report estimates that EU GDP is at least 3 to 4 percentage points higher today because of the Single Market, potentially up to twice that once dynamic effects such as competition and innovation are included.
Conclusion
This study examined how international trade and trade volumes influence economic growth and stability of the nations. The findings challenge the simplified view on trade as a universal economic growth accelerator. But also stating that trade does contribute to a country’s growth heavily depending upon the internal factors of a country, such as institutional quality, geographical characteristics, internal economic conditions, and the sensitivity to global crises. The analysis showed that trade almost has no relationship with a country’s economic growth as of Pearson Correlation of 0.012 statistically. However, a further exploration into the analysis showed that analysis was misleading. The relationship between a country’s economic growth and trade becomes more understandable when the differences between countries, delayed effects of trade agreements, reverse causality, and the influence of large economies are considered.
Further exploration into the data, the study identified one of the most significant findings, which was identification of the funnel effect between trade openness and economic growth. The funnel effect indicated that countries with lower trade openness showed higher volatility in their economic growth condition, whereas countries with higher openness showed a steady economic growth. This finding suggests that international trade acts more as a volatility controlling mechanism for a country’s economic growth, instead of being a direct accelerator for growth.
Another major finding was that the data showed that international trade’s role is not only a stabiliser but also a global shock transmitter. Based on the empirical findings through this study, international trade agreements, and expanding trade volumes do contribute towards a country’s economic growth and economic stability. But, the extent of the contribution varies significantly, depending upon the geographical characteristics of the country, the institutional quality, internal economic policies and conditions, and a country’s susceptibility to economic crises. Therefore, international trade must not be considered as a sole driver for economic growth, but rather should be considered as one of the major components of a broader economic development strategy. Ultimately, the study concludes that international trade must not be viewed as the primary source of growth in itself, but as a tool which helps a country towards more sustainable and resilient economic growth.
References
Acemoglu, D., Johnson, S., & Robinson, J. A. (2001). The colonial origins of comparative development: An empirical investigation. American Economic Review, 91(5), 1369–1401. https://doi.org/10.1257/aer.91.5.1369
Arisman, Al Arif, M. N. R., & Harahap, D. (2021). Trade agreement and economic growth: Evidence in D-8 countries. Signifikan: Jurnal Ilmu Ekonomi, 10(2), 311–324. https://doi.org/10.15408/sjie.v10i2.21457
Asianet Newsable. (2026, May 20). India-UAE CEPA: Bilateral trade hits $101B, targets $200B by 2032. Asianet News. https://en.vneconomy.vn/vietnam-targets-annual-gdp-growth-of-10-in-2026-2030.htm
Bems, R., Johnson, R. C., & Yi, K.-M. (2011). Vertical linkages and the collapse of global trade. American Economic Review, 101(3), 308–312. https://doi.org/10.1257/aer.101.3.308
Chang, R., Kaltani, L., & Loayza, N. V. (2009). Openness can be good for growth: The role of policy complementarities. Journal of Development Economics, 90(1), 33–49. https://doi.org/10.1016/j.jdeveco.2008.06.011
CNBC. (2025, July 2). Trump says U.S. struck trade deal with Vietnam that imposes 20% tariff on its imports. CNBC. https://www.cnbc.com/2025/07/02/trump-trade-vietnam-deal.html
College of Europe. (n.d.). Summary of the European Commission report “The Economic Impact of the European Single Market.” https://www.coleurope.eu/new-european-commission-report-economic-impact-european-single-market
Deccan Chronicle. (2026, May 1). Gateway to growth: India-UAE bilateral trade hits historic $101 billion milestone under CEPA. Deccan Chronicle. https://www.deccanchronicle.com/nation/gateway-to-growth-india-uae-bilateral-trade-hits-historic-101-billion-milestone-under-cepa-1953982
Di Giovanni, J., & Levchenko, A. A. (2009). Trade openness and volatility. The Review of Economics and Statistics, 91(3), 558–585. https://doi.org/10.1162/rest.91.3.558
Domínguez Blancas, C. S., & Ángeles Castro, G. (2024). Trade liberalization effects on economic growth, 1980–2022. Revista Mexicana de Economía y Finanzas Nueva Época, 19(3), Article e992. https://doi.org/10.21919/remef.v19i3.992
Fontagné, L., Rocha, N., Ruta, M., & Santoni, G. (2023). The economic impact of deepening trade agreements. The World Bank Economic Review, 37(3), 366–388. https://doi.org/10.1093/wber/lhad005
Frankel, J. A., & Romer, D. H. (1999). Does trade cause growth? American Economic Review, 89(3), 379–399. https://doi.org/10.1257/aer.89.3.379
Fujita, Y. (2026). Vietnam. In K. Hirota (Ed.), Introduction to quality growth (pp. 347–365). Springer. https://link.springer.com/content/pdf/10.1007/978-981-95-6220-6.pdf
General Agreement on Tariffs and Trade. (1947). General Agreement on Tariffs and Trade. GATT Secretariat. https://www.wto.org/english/docs_e/legal_e/gatt47_e.htm
Grossman, G. M., & Helpman, E. (1991). Innovation and growth in the global economy. MIT Press.https://www.researchgate.net/publication/251562726_Innovation_and_Growth_in_the_Global_Economy
Itakura, K. (2022). Impact of the Regional Comprehensive Economic Partnership: A global computable general equilibrium simulation. In F. Kimura, S. M. Thangavelu, & D. Narjoko (Eds.), Regional Comprehensive Economic Partnership: Implications, challenges, and future growth of East Asia and ASEAN (pp. 111–140). Economic Research Institute for ASEAN and East Asia.
Lewer, J. J., & Van den Berg, H. (2003). How large is international trade’s effect on economic growth? Journal of Economic Surveys, 17(3), 363–396. https://doi.org/10.1111/1467-6419.00198
OECD. (2025). Harnessing trade and investment flows to boost productivity. In OECD economic surveys: Viet Nam 2025. OECD Publishing. https://doi.org/10.1787/e00181-en
Rahman, M. S., Sultana, S., Sultana, M., & Afzal, M. N. I. (2024). An investigation on the effectiveness and trade direction of ASEAN trade agreements. Financial Markets, Institutions and Risks, 8(2), 98–118. https://doi.org/10.61093/fmir.8(2).98-118.2024
Ricardo, D. (1817). On the principles of political economy and taxation. John Murray. https://www.econlib.org/library/Ricardo/ricP.html
Rodrik, D., Subramanian, A., & Trebbi, F. (2004). Institutions rule: The primacy of institutions over geography and integration in economic development. Journal of Economic Growth, 9(2), 131–165.
Romer, P. M. (1990). Endogenous technological change. Journal of Political Economy, 98(5, Part 2). https://doi.org/10.1086/261725
Singh, T. (2010). Does international trade cause economic growth? A survey. The World Economy. https://doi.org/10.1111/j.1467-9701.2010.01243.x
Smith, A. (1776). An inquiry into the nature and causes of the wealth of nations. W. Strahan & T. Cadell. https://www.econlib.org/library/Smith/smWN.html
Solow, R. M. (1956). A contribution to the theory of economic growth. The Quarterly Journal of Economics. https://doi.org/10.2307/1884513
Springer. (2021). Baldwin versus Cecchini revisited: The growth impact of the European Single Market. Empirical Economics. https://link.springer.com/article/10.1007/s00181-021-02161-w
The White House. (2025). Regulating imports with a reciprocal tariff to rectify trade practices that contribute to large and persistent annual United States goods trade deficits. Government Publishing Office.
UN Department of Economic and Social Affairs. (2023). The Sustainable Development Goals report 2023: Special edition. United Nations. https://unstats.un.org/sdgs/report/2023/
Vietcetera. (2026, January 16). Vietnam recorded 8% GDP growth in 2025, targeting 10% in 2026. https://vietcetera.com/en/vietnam-recorded-8-gdp-growth-in-2025-targeting-10-in-2026
World Bank. (2024). World Development Indicators. The World Bank Group. https://databank.worldbank.org/source/world-development-indicators
World Trade Organization. (1995). Marrakesh agreement establishing the World Trade Organization. WTO Publications. https://www.wto.org/english/docs_e/legal_e/marag_e.htm
World Trade Organization. (2008). World trade report 2008: Trade in a globalizing world. WTO Publications. https://www.wto.org/english/res_e/publications_e/wtr08_e.htm
World Trade Organization. (2021). World trade report 2021: Economic resilience and trade. WTO Publications. https://www.wto.org/english/res_e/publications_e/wtr21_e.htm