Authors: Naina Bath, Aayan, Janhavi
1. Abstract
The Make in India initiative, launched in 2014, marked a significant shift in India’s industrial and trade policy by combining higher import tariffs with investment-oriented reforms to strengthen domestic manufacturing and reduce dependence on foreign goods. This paper seeks to examine whether the increase in import duties under this initiative contributed to manufacturing growth or raised input costs for industries that were already reliant on imported goods. The research uses a descriptive trend analysis using secondary data from the Reserve Bank of India (RBI), World Integrated Trade Solution (WITS), Ministry of Commerce and Industry, Ministry of Statistics and Programme Implementation (MoSPI), and other government and institutional sources covering the period 2014–2024 to check the effectiveness of the policy.
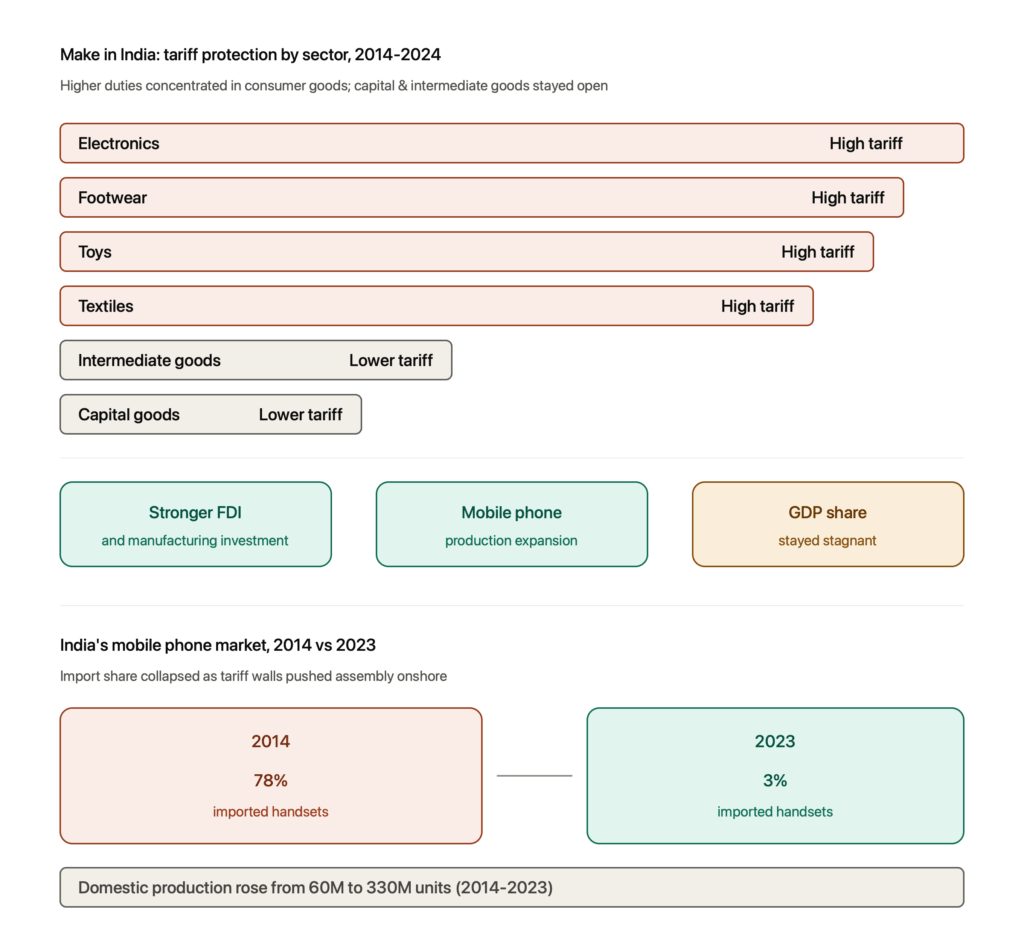
The findings indicate that India’s tariff strategy was selective rather than broad-based, with higher protection concentrated in consumer-oriented sectors such as electronics, footwear, textiles, and toys, while duties on many intermediate and capital goods remained comparatively lower. The policy contributed to increasing manufacturing investment, stronger FDI inflows, expansion of domestic production in sectors such as mobile phones, and growth in organised manufacturing employment. However, manufacturing’s share of GDP remained largely stagnant, import dependence remained in several critical sectors, and higher tariffs increased production costs for industries dependent on imported inputs, limiting export competitiveness. The study concludes that while targeted tariff protection can support industrial development when combined with complementary measures such as infrastructure development, technological advancement, and production-linked incentives, import duties alone are insufficient to achieve sustained manufacturing-led growth and long-term global competitiveness.
2. Introduction
By 2013, India’s manufacturing sector had reached a critical stage. Despite decades of policy intervention, the sectors’ contribution to GDP had remained stagnant at 15-17% since the post-reform period. Manufacturing growth had slowed to 3.3% per annum by 2011-12, down from 10.1% during 2003-04 to 2009-10, with total imports standing at $450.94 billion against exports of just $312.35 billion in 2013-14. This increased dependence of the country on foreign goods, especially in electronics, machinery and energy. India was given the tag of one of the “Fragile Five” economies, which led to global investors debating whether it was a risk or an opportunity to invest in the world’s largest democracy.
It was against this backdrop, the Make in India initiative was launched on September 25, 2014. The most ambitious industrial policy intervention in India’s post-liberalisation history, built on 4 pillars: new processes, new infrastructure, new sectors, and a new mindset, targeting three core objectives: raising the manufacturing sector’s contribution to GDP to 25% by 2025, accelerating manufacturing growth to 12-14% per annum, and generating 100 million additional jobs by 2022. It sought to shift the government’s role from a regulator to a facilitator of industrial growth. To support this, the government liberalised FDI policies, streamlined business regulations, and invested in large-scale infrastructure development.
Central to this, a deliberate and sustained escalation of import tariffs across key sectors: electronics, automobiles, textiles and toys was also taken up, with a trade-weighted average of custom duties nearly doubling from approximately 7% in 2013-14 to 12% by 2023. These measures were complemented by Production Linked Incentive schemes from 2020, offering performance-based incentives across 14 sectors with a committed outlay of approximately Rs. 3 Lakh Crore.
In terms of progress, FDI equity inflows into manufacturing rose by 55%, to reach $148.97 billion between 2014 to 2023 compared to $96 billion in 2005 to 2014 and India emerged as the world’s second largest mobile phone producer. However, the manufacturing’s share of GDP declined from 16.7% in 2013-14 to 15.9% in 2023-24, with the growth of manufacturing averaging around 6% as against the target of 12-14%.
Total imports surged from approximately $451 billion in 2013-14 to $915.19 billion in 2024-25, indicating that import dependence remained unresolved. This raises the fundamental question: has India’s tariff escalation under Make in India genuinely helped the growth of domestic manufacturing or has it disproportionately raised input costs for downstream industries undermining the competitiveness it sought to build?
3. Literature Review
3.1 Overview
The Make in India campaign has received substantial academic attention in relation to its potential to improve the state of manufacturing in India through industrial reforms, investments, and import replacement policy. Chang (2002) suggests that protectionism was a significant factor in the development of industries in advanced countries, whereas Rodrik (2008) states that industrial policy can be effective if combined with technological development and institutional changes. In turn, Bhattacharjea (2023) remarks that the current industrial policy of India involves trade reforms, investments, and manufacturing. Tripathy (2023) adds that although measures like opening up for FDI, the PLI scheme, and Atmanirbhar Bharat contributed to the expansion of manufacturing, further success will depend on infrastructure, productivity, and technology.
3.2 Increase in Import Duties
Academics have expressed different opinions regarding the rise in import duties during the Make in India policy. For instance, Chang (2002) says that temporary protectionism played an essential role in helping many developed nations develop industrially, and according to Rodrik (2008), targeted tariffs may be used to facilitate structural changes together with improvements in productivity and infrastructure. In addition, the Economic Survey (2019–20) and Bhattacharjea (2023) claim that increased customs duties were used to encourage domestic value addition and manufacturing. On the other hand, Amiti, Redding, and Weinstein (2019) say that increasing tariffs leads to an increase in costs of production and a decrease in export competitiveness.
3.3 Promotion of Self-Reliance
Literature recognizes Atmanirbhar Bharat as an approach for developing Indian domestic manufacturing in spite of its integration with the world economy. According to The Economic Survey (2020–21) and NITI Aayog (2021), the self-reliance policy aims at increasing the capacity for manufacturing, infrastructure development, and technologies, but not limiting international trade. Moreover, Baldwin & Evenett (2020) highlight the necessity of global supply chain diversification along with expanding domestic manufacturing capacity. However, Panagariya (2021) warns against the possible negative effects of imposing too many barriers on imports, including reduced competition and innovation, whereas the OECD (2023) suggests that self-reliance is possible only with the help of reforming infrastructure, logistics, technologies, and the labor market.
3.4 Production Linked Incentive (PLI) Scheme
According to the literature, the Production Linked Incentive (PLI) Scheme is one of the main policies that facilitate the Make in India Policy. According to NITI Aayog (2022), the scheme has increased the manufacturing capacity in sectors like the electronics industry and the pharmaceutical sector and increased domestic value addition. Invest India (2023) adds that the Production Linked Incentive (PLI) Scheme has helped in strengthening manufacturing and export of electronics, and the World Bank (2022) adds that the industrial incentives increase competitiveness, provided there are consistent policies and infrastructure. However, according to Panagariya (2021) and the Organisation for Economic Co-operation and Development (2023), financial incentives are not enough.
3.5 Foreign Direct Investment (FDI)
Scholars have acknowledged that FDI is one of the major catalysts for promoting industry growth through the Make in India program. According to Dunning (1993), multinational companies invest in the nations that provide favorable conditions for investments, whereas Kumar and Pradhan (2021) mention technology spillovers and incorporation in global value chains as another factor that can be attributed to FDI. Likewise, DPIIT (2023) and UNCTAD (2023) mention India as one of the leading destinations for FDI because of policy reforms and improved investment environment in the country. Nevertheless, according to Panagariya (2021), the manufacturing sector does not attract the highest investments through FDI, while according to the World Bank (2022) and Borensztein, De Gregorio, and Lee (1998), the impact of FDI relies on infrastructure and human capital.
3.6 Increased Tariffs on Imported Goods
Various studies show inconsistent arguments about the application of increased tariffs in conjunction with the Make in India initiative. For instance, Chang (2002) and Rodrik (2008) have shown that temporary tariff protection can facilitate industrialisation along with the implementation of technological and institutional changes. In the same vein, the Economic Survey (2019-20) and Bhattacharjea (2023) indicate that the introduction of increased customs duties is an attempt to promote local manufacturing and import substitution. On the other hand, Amiti, Redding, and Weinstein (2019) have demonstrated that increased tariffs result in increased production costs and decreased competitiveness of the exports. In a similar vein, the OECD (2023) and Panagariya (2021) have argued that long-term industrial development requires innovations, infrastructure, and increased productivity but not tariff protection.
3.7 Challenges and Criticisms
Raising tariffs looks straightforward on paper, but the real-world results are messier. A recurring concern in the literature is that protection tends to lock in inefficiency rather than eliminate it. Firms that know they are shielded from foreign competition have little reason to improve. Acharya (2021) documented this pattern in Indian manufacturing, where duty hikes quietly raised input costs for smaller producers who could not absorb them. The competitive pressure those firms needed to modernise was exactly what the tariff removed. Krueger (1997) made a similar argument at a global level, showing that protectionist regimes routinely generate rent-seeking rather than innovation.
3.8 Long-Term Economic Objectives
The Make in India vision was never just about fewer imports — it was about building industries that could eventually compete globally. Rodrik (2004) argued that this only works when protection is tied to clear productivity targets, not simply to reducing import volumes. Singh and Bansal (2020) applied that logic to the Indian case and found that without an export-competitiveness anchor, the country risks repeating the inward-looking failures of the 1970s: industries that survive on policy support but struggle the moment it is removed.
3.9 Protection of Domestic Industries
There is a respectable case for temporary protection, and scholars have made it carefully. Chang (2002) pointed out that today’s advanced economies built their industrial base behind tariff walls before later preaching free trade. Mehta (2019) found short-run output gains in India’s toy and textile sectors following duty hikes, but qualified those gains heavily — they held only where logistics and credit access also improved. Where supporting conditions were absent, protection alone changed very little.
3.10 Growth of Manufacturing Sector
Manufacturing’s share of India’s GDP has hovered stubbornly between 15 and 17 percent for over a decade, despite repeated policy pushes. Nagaraj (2022) traced this stagnation to infrastructure deficits that tariffs simply cannot address. Kumar (2021) added that without deeper integration into global value chains, Indian manufacturers face a ceiling on growth regardless of how much import protection they receive. Both studies point to the same uncomfortable truth: the barriers holding back Indian manufacturing are structural, not just competitive.
3.11 Impact on Imports and Trade
Trade data following the tariff hikes tell a complicated story. Nair (2020) observed that while specific import categories did shrink, overall import expenditure stayed high because domestic alternatives could not match the price or quality of foreign goods across most segments. More telling, Sharma (2022) showed that India’s trade deficit with China actually widened between 2017 and 2022. Tariffs reduced the symptom in some places but left the underlying structural import dependency built up through decades of under-investment largely untouched.
3.12 Research Gap
Although the Make in India initiative, rising import tariffs, Foreign Direct Investment (FDI), and the Production Linked Incentive (PLI) Scheme have been discussed in numerous studies, no definite conclusion about the impact of India’s tariff policy on its manufacturing sector can be reached yet. Though some researchers prove that raising import duties contributes to developing import substitution and self-reliance, others claim that these duties lead to cost growth, decreased competitiveness of products on the international market, and integration into global value chains.
In addition to that, most studies have explored the effects of such policies individually or industry-specifically, leaving out information regarding their cumulative effect on India’s manufacturing sector. Most importantly, there is not enough literature on whether the positive effects of high import tariffs in developing the domestic manufacturing sector have been negated by the additional costs incurred by those industries that rely on imports of intermediate products. This is especially pertinent for the 2014–2024 decade, which saw considerable changes in tariffs alongside other policy measures through Make in India.
Therefore, this paper tries to fill the gap by examining the overall effect of the increase in tariffs in India on its manufacturing efficiency, trade flows, and FDI to find out if tariff protection has been an instrument for improving manufacturing efficiency in India or merely cost escalation and dependence on imports.
4. Research methodology:
4.1 Research design
This study seeks to examine whether India’s rising import taxes since 2014 under the Make in India has strengthened domestic manufacturing or has rather increased input costs for industries dependent on foreign goods. The study adopts a descriptive and trend analysis approach rather than a statistical or econometric model. Trends in tariff rates are analysed with customs duty collections, trade flows and indicators of manufacturing sector performance to assess the impact of the Make in India tariff policy between 2014 and 2024. Attention is given to sector-level tariff trends in consumer goods, intermediate goods, textiles and clothing, and footwear.
4.2 Data sources and variables
This study relies on secondary data collected from publicly accessible government and institutional databases for the period 2014-2024. Customs duty revenue data is sourced from Table 90 of the Reserve Bank of India’s handbook of statistics on Indian Economy. Information on applied tariff rates, weighted average and simple average by product group are drawn from the World integrated Trade Solution (WITS) of the World Bank. Trade data is obtained from the Ministry of Commerce and Industry, Government of India, and World Trade Organization, Trade Policy Review. Data related to the manufacturing sector is sourced from the National Accounts Statistics 2024, by Ministry of Statistics and Programme Implementation (MoSPI).
4.3 Scope and limitations
The findings are interpreted through a qualitative argumentative scope. As no statistical testing or econometric estimation has been conducted, the conclusions are based on comparative interpretation. Also, tariff data aggregated at the product-category level may conceal firm-level variations in impact of the policy. The analysis also requires careful interpretation of post-2017 customs duty figures due to changes in India’s indirect tax structure following the implementation of the Good and Services tax (GST).
5. Findings and Discussion
5.1 Increase in Import Duties
Under the Make in India initiative 2014, one of the notable policy measures of the government of India was a deliberate and sustained escalation of custom duties, which acts as a central instrument of its import substitution strategy. Tariff policy became increasingly targeted towards sectors identified as strategically important for domestic manufacturing.
Let’s examine the trends of import duty over the decade 2014-2024 on the customs duty revenue data from the RBI handbook of statistics and product-level tariff data from the World Integrated Trade Solution (WITS), World Bank. It reveals a pattern of tariff escalation that was strategic and sector specific rather than being broad based.
|
TABLE 90 : CENTRAL GOVERNMENT RECEIPTS – MAJOR COMPONENTS |
|
||||||
|
(₹ Crore) |
|||||||
|
Year |
Indirect Tax |
of which |
|||||
|
Excise Duties |
Customs Duties |
% share of custom duties |
%increase of custom duties |
||||
|
1 |
2 |
3 |
4 |
(4/2)*100 |
(current – previous)*100/previous |
||
|
2011-12 |
286454 |
116226 |
105614 |
36.87 |
|
||
|
2012-13 |
345292 |
141245 |
115890 |
33.56 |
9.73 |
||
|
2013-14 |
360025 |
137975 |
121059 |
33.63 |
4.46 |
||
|
2014-15 |
403085 |
153709 |
127994 |
31.75 |
5.73 |
||
|
2015-16 |
494469 |
220473 |
128829 |
26.05 |
0.65 |
||
|
2016-17 |
580085 |
286088 |
135372 |
23.34 |
5.08 |
||
|
2017-18 |
636272 |
211393 |
78601 |
12.35 |
-41.94 |
||
|
2018-19 |
593719 |
204021 |
75231 |
12.67 |
-4.29 |
||
|
2019-20 |
718537 |
212988 |
71472 |
9.95 |
-5.00 |
||
|
2020-21 |
843077 |
365682 |
91070 |
10.80 |
27.42 |
||
|
2021-22 |
939407 |
378244 |
144276 |
15.36 |
58.42 |
||
|
2022-23 |
1045666 |
305517 |
155463 |
14.87 |
7.75 |
||
|
2023-24 |
1093492 |
293603 |
168558 |
15.41 |
8.42 |
||
|
2024-25 |
1142570 |
292524 |
170177 |
14.89 |
0.96 |
||
|
2025-26 |
1244578 |
303398 |
174528 |
14.02 |
2.56 |
||
Source: Reserve Bank of India (2024), Handbook of Statistics on Indian Economy, Table 90
Table 1: Central government Receipts.
Customs duty collections rose from ₹1,21,059 Crore in 2013-14 to ₹1,68,558 crore in 2023-24, representing an overall increase of 39.2% over the decade.
The percentage increase calculated as: ((1,68,558 – ₹1,21,059) x 100 = 39.2%.
And a Compound Annual Growth Rate (CAGR) of 3.4% per annum was witnessed.
CAGR calculated as: (1,68,558 / 1,21,059)1/10 – 1
In the initial phase post-2014, import collections grew steadily at 5.73% p.a. in 2014-15 and 5.08% in 2016-17. However, with the introduction of GST in 2017, it restructured India’s direct taxation framework, causing custom duties to fall by 41.94% i.e., ₹78,601 crore in 2017-18 which was caused due to fiscal reorganization rather than changes in the policy. Following the COVID-19 disruption of 2020-21, import collections rebounded, going up to 58.42% i.e., ₹1,44,276 crore in 2021-22 and continuing to grow further in 2023-24, suggesting increase in import volumes and increasing duty rates. The annual growth rate of customs duties is calculated as;
Growth rate (%) = ((Current year value – previous year value)/Previous year value) *100
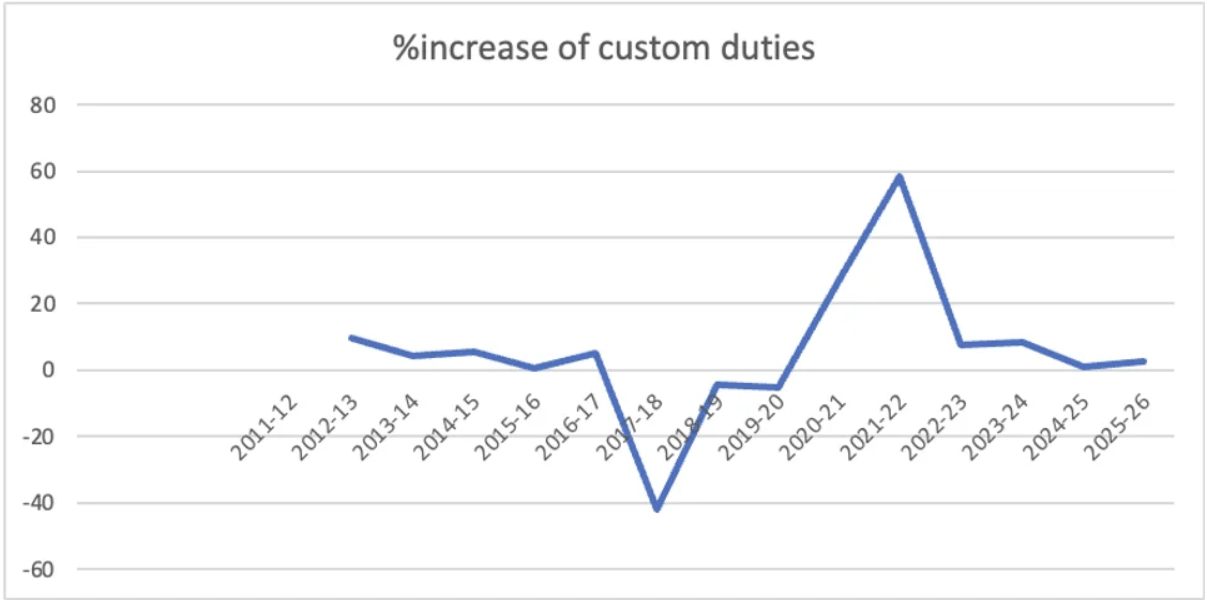
Fig 1: Percentage increase of custom duties.
A more comprehensive picture emerged from World Integrated Trade Solutions applied tariff
data. The weighted average tariff for all products is calculated as:
Weighted Average Tariff (WAT): Σ (Tariff Rate x Import Share)
Note that the Weighted Average Tariff assigns greater weight to products with larger shares in total imports.
|
Reporter Name |
India |
|
Partner Name |
World |
|
Trade Flow |
Import |
|
Product Group |
All Products |
|
Indicator |
AHS Weighted Average (%) |
|
YEAR |
Weighted Average tariff |
|
2011 |
7.334 |
|
2012 |
6.317 |
|
2013 |
6.343 |
|
2014 |
6.480 |
|
2015 |
7.323 |
|
2016 |
6.350 |
|
2017 |
5.778 |
|
2018 |
4.884 |
|
2019 |
6.595 |
|
2020 |
6.193 |
|
2021 |
5.873 |
|
2022 |
4.473 |
|
2023 |
5.218 |
|
|
Source: World Bank (2024), World Integrated Trade Solution (WITS), Tariff Analysis, India (Reporter), World (Partner), All Products
Table 2: Weighted tariff average of all products
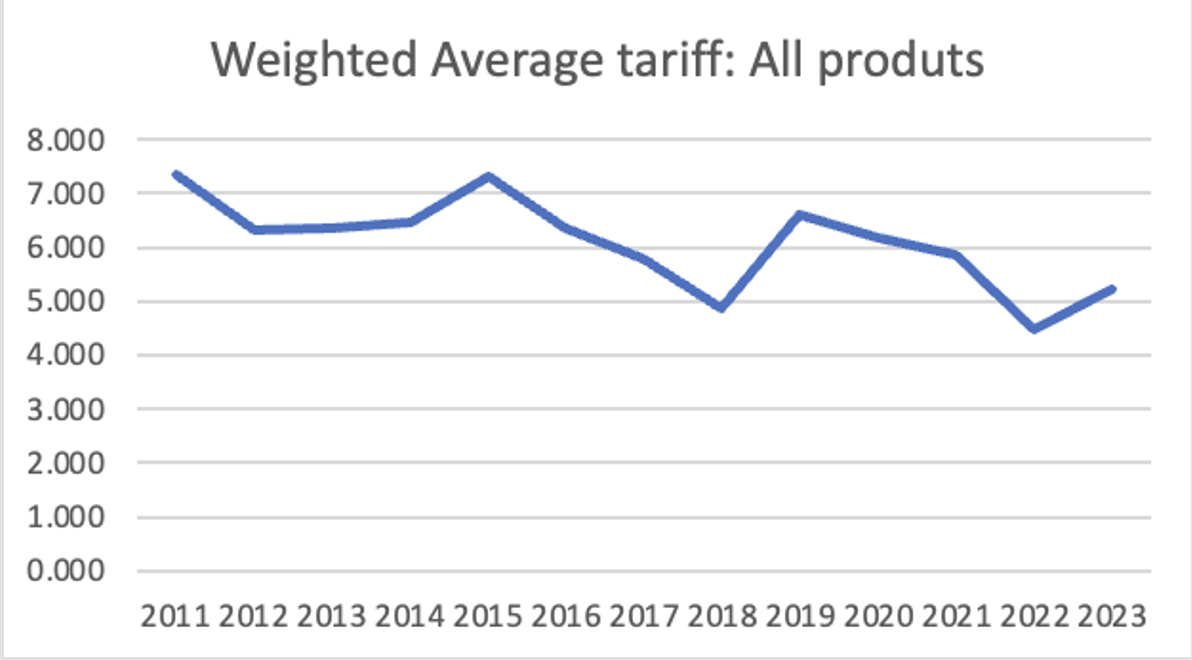
Fig 2: Trend in weighted average tariff of all products.
WAT stood at 6.48% in 2014, dipped to 4.4% in 2022, and recovered to 5.22% in 2023, suggesting the aggregate tariff burden remained broadly stable.
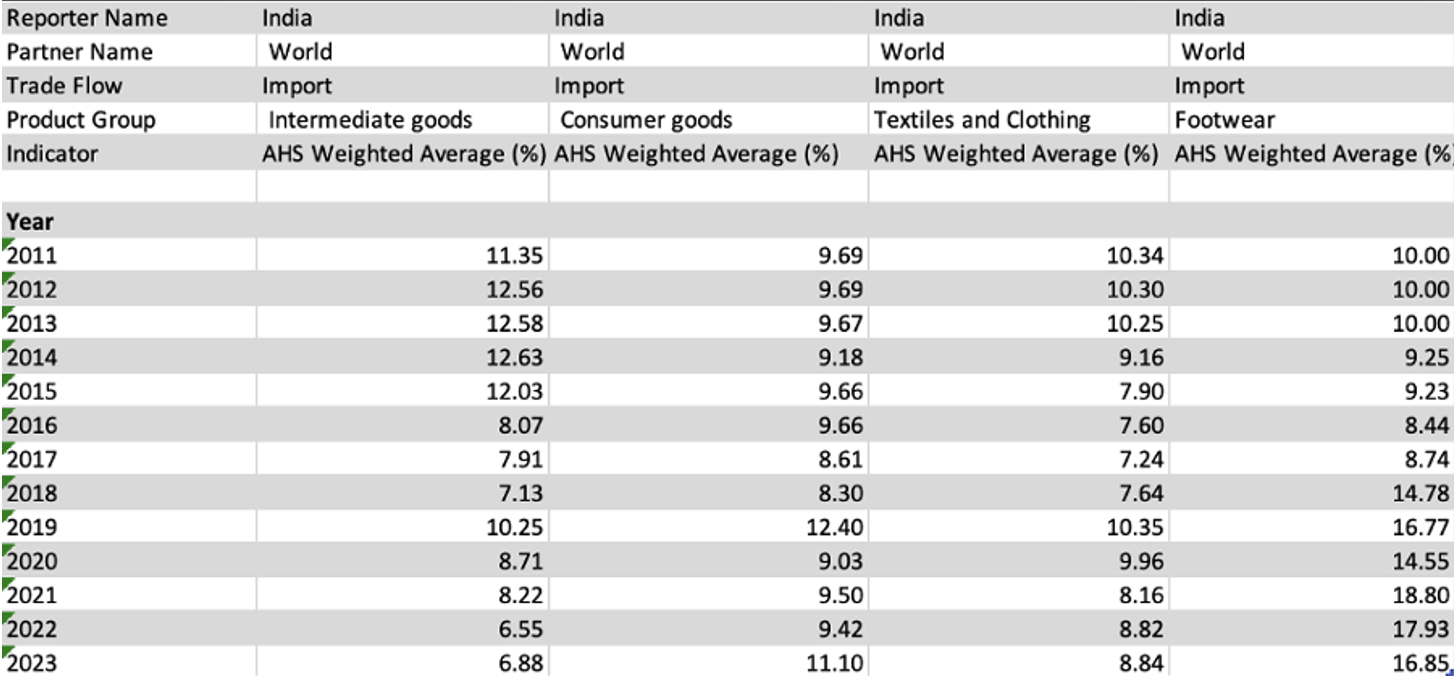
Source: World Bank (2024), World Integrated Trade Solution (WITS), Tariff Analysis, India (Reporter), World (Partner), sector-level product groups.
Table 3: Weighted Average Tariff of specific sectors
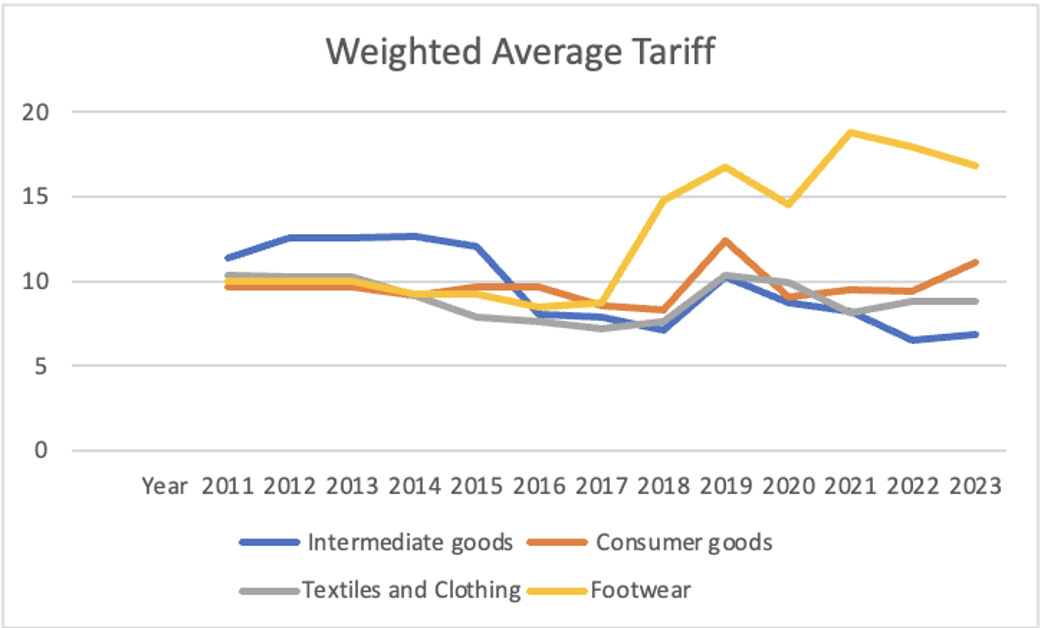
Fig 3: Comparative trend of specific sectors.
However, sectoral analysis reveals divergence. Consumer goods tariffs rose from 8.61% in 2017 to 11.10% in 2023, footwear from 8.74% to 16.85%, and textiles and clothing from 7.24% to 8.84%. In contrast, intermediate goods tariffs declined from 7.92% to 6.88% over the same period, and capital goods remained low at around 5%. This indicated the primary focus was on final consumer goods rather than on production inputs.
Simple average tariff (SAT): Σ (Tariff Rate / No. of tariff lines)
Note: it treats every product’s tariff rate equally, regardless of how much is actually imported.
The simple average for all products has broadly remained stable between 8-10% throughout the decade.
|
Reporter Name |
India |
|
Partner Name |
World |
|
Trade Flow |
Import |
|
Product Group |
All Products |
|
Indicator |
AHS Simple Average (%) |
|
YEAR |
|
|
2011 |
10.56 |
|
2012 |
10.71 |
|
2013 |
10.59 |
|
2014 |
10.19 |
|
2015 |
9.75 |
|
2016 |
8.91 |
|
2017 |
8.88 |
|
2018 |
9.03 |
|
2019 |
10.21 |
|
2020 |
9.42 |
|
2021 |
9.86 |
|
2022 |
10.02 |
|
2023 |
9.81 |
|
|
Source: World Bank (2024), World Integrated Trade Solution (WITS), Tariff Analysis, India (Reporter), World (Partner), All Products.
Table 4: Simple Average tariff of All products
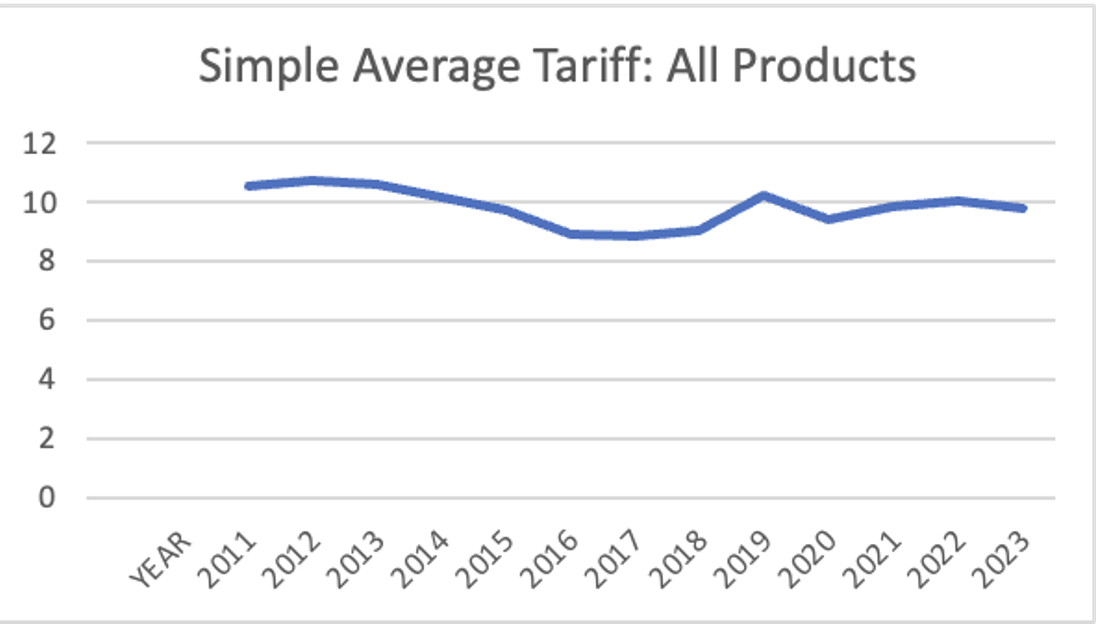
Fig 4: Trend of Simple average of all products
Simple average tariff also supports this conclusion. It broadly remained stable at 10.19% in 2014 and 9.81% in 2023, while consumer goods rose from 13.6% to 13.86% and footwear from 9.64% to 18.41%.
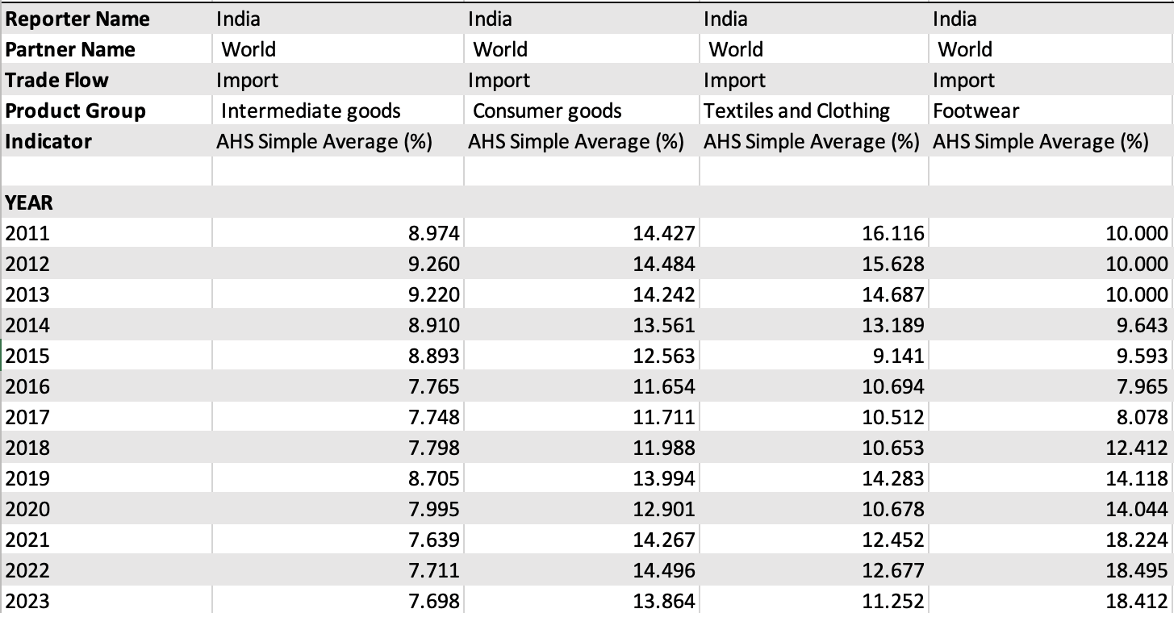
Source: World Bank (2024), World Integrated Trade Solution (WITS), Tariff Analysis, India (Reporter), World (Partner), sector-level product groups.
Table 5: Simple Average Tariff of specific sectors
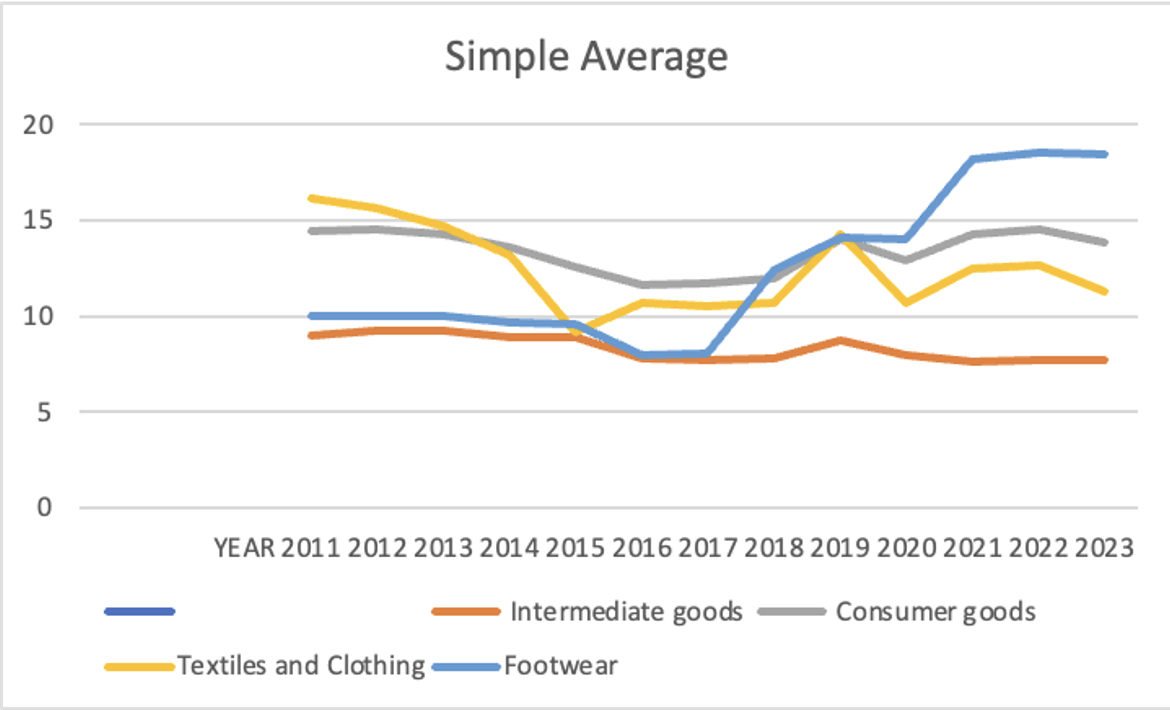
Fig 5: Trend of Simple average of specific sectors
Overall, the evidence confirms that Make in India did not create a uniform increase in import duties. Instead, tariff policy targeted selective sectors providing meaningful protection to consumer oriented industries such as footwear, textiles and consumer goods, while keeping duties on intermediate inputs and capital goods relatively low.
5.2 Promotion of self-reliance
The Make in India initiative gave place to the promotion of self-reliance (Atmanirbhar bharat) not merely as a slogan but as a measure of the shift in India’s dependence on foreign goods, most directly reflected in the ratio of imports of goods and services to GDP. A lower ratio indicates a shift toward self-reliance as the policy defines it. World bank development indicators data shows this ratio at 28.41% in 2013, 23.7% in 2018 and 24% in 2023. The data also shows a compound annual decline of approximately 1.68% per annum (CAGR), calculated as {(23.97/28.41)(1/10) – 1}, (from 2013 to 2023). This figure, however, does not indicate the substantial volatility within the period that can be observed in the figure below. For example 21.24% in 2019 and falling to 19.08% in 2020 during covid-19.
|
Data Source |
World Development Indicators |
|
Last Updated Date |
13/07/26 |
|
Country Name |
India |
|
Country Code |
IND |
|
Indicator Name |
Imports of goods and services (% of GDP) |
|
Indicator Code |
NE.IMP.GNFS.ZS |
|
2013 |
28.41 |
|
2014 |
25.95 |
|
2015 |
22.11 |
|
2016 |
20.92 |
|
2017 |
21.95 |
|
2018 |
23.69 |
|
2019 |
21.24 |
|
2020 |
19.08 |
|
2021 |
24.02 |
|
2022 |
26.66 |
|
2023 |
23.97 |
|
2024 |
23.85 |
|
2025 |
24.01 |
|
|
Source: World Bank (2024), World Development Indicators, Indicator NE.IMP.GNFS.ZS.
Table 6: Imports of goods and services (% of GDP)
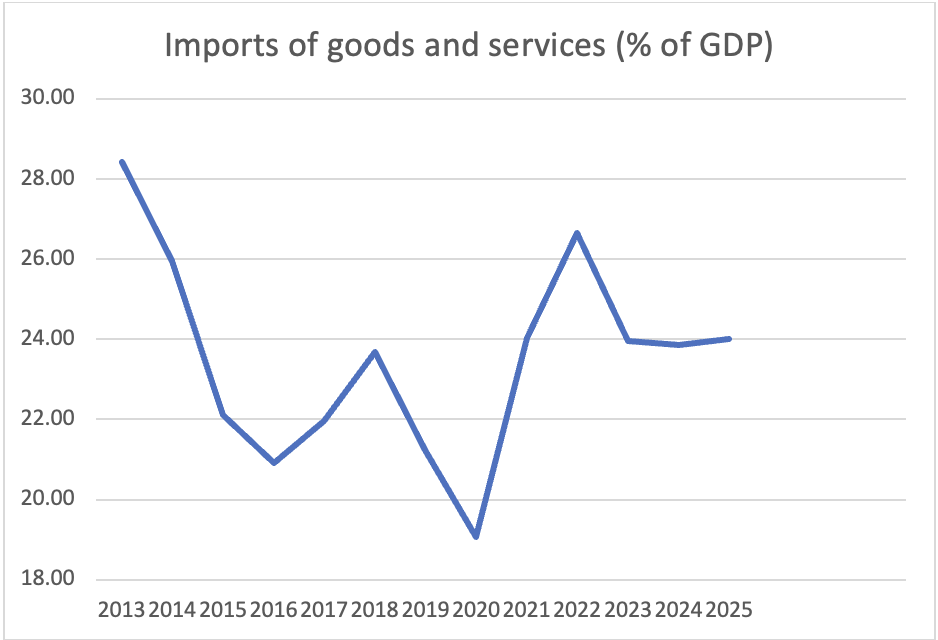
Fig 6: Trend in Imports of goods and services (% of GDP)
When read only between endpoints, this looks like slow but sure progress towards self-reliance. But the path between the decade 2013-2023 was not linear. The ratio fell to 20.9% in 2016, climbed back to 23.7% in 2018, and fell down to 19.08% in 2020 during the COVID-19 trade contraction and then jumped back to 26.7% by 2022 due to commodity price surge, before setting to around 24%.
This volatility does flow with the tariff escalation timeline described in section 5.1 in any consistent way. If import duties were the primary cause behind the decline in number of imports, the ratio would have to move in a broadly directional pattern that aligns with the tariff increases (after the implementation of the Make in India policy 2014, as explained in section 5.1). Instead, the sharpest movements in the series coincide with events that are unrelated to the trade policy of the country. The collapse to 19.1% in 2020 was due to the global COVID-19 trade restrictions, which reduced import demand in virtually every economy. While the sharpest upward shift to 26.7% in 2022, the post-pandemic commodity price surge, which raised the rupee value of India’s import bill independent of any change in tariff policy. Both of these swings are larger than the net decline observed over the full decade and act as the dominant movement in the series. This makes it difficult to attribute the overall decline in import intensity primarily to tariff policy, because global shocks of comparable magnitude were acting on the same variable over the same period.
If we ask whether Make in India’s tariff policy reduced India’s import dependence, and thus promoted self-reliance, through this section’s evidence we can say that the import/GDP ratio did decline over the decade, but the timing of its largest movements suggests tariffs were one factor among several rather than the primary driver for this decline.
5.3 Production Linked Incentive (PLI) Scheme
The PLI scheme extends Make in India’s self-reliance goal by directly creating incentives in domestic production through financial rewards tied to the change/increase in output. The PLI scheme works as a performance-based incentive. The government offers financial rewards to companies based on their increased sales and production output in India. The government has created a list of high-growth sectors where India can become competitive globally. These areas include mobile and electronics manufacturing, advanced chemistry batteries, solar modules, pharmaceutical ingredients, automotive components, and telecommunications equipment. Because the scheme was only announced in FY2020-21, it does not have pre Make in India 2014 data to compare with the present trends as was prevalent in sections 5.1 and 5.2. Government data, as shown in the table below, shows investment at ₹0.51 lakh crore, sales/production at ₹4.50 Lakh crore and employment at 3lakh as of FY 2022-21, rising to ₹2.16 lakh crore, ₹20.41 lakh crore, and 15.39 lakh respectively by December 2025.

Source: Government of India, Ministry of Commerce and Industry (2026), Rajya Sabha Unstarred Question No. 3880.
Table 7: Details of actual investments, increased in production and employment generation under PLI Schemes
Within the scheme, employment has grown with the production and investment, at a steady pace. This directly indicates that the PLI scheme is creating jobs contrary to critique stating it only supports capital intensive techniques. The bigger limitation rather is one of scale 14.39 lakh jobs sound like a lot, but it is a small share of India’s total organised manufacturing workforce, which earlier sections of this paper put at over 3 crore (14.39 lakh is under 5% of that total). The scheme also only covers 14 sectors. So even if it is working well within those sectors, it simply is not large enough to shift a number as broad as manufacturing’s overall share of GDP. This matches the Economic and Political weekly’s assessment: PLI’s gains are real, but they’re concentrated in a handful of standout sectors rather than spread across manufacturing as a whole, and even those sectors still depend heavily on imported components (EPW, 2024). Mobile phone manufacturing is the clearest exception to this: production rose about 146% between FY 2020-21 and FY 2024-25, imports fell by roughly 77% and around 99.2% of phones sold in India are now made domestically. Which proves that PLI can meaningfully cut import dependence when a sector responds well to it. When we examine this against the research question, PLI shows self-reliance achieved in specific sectors rather than economy wide since it only covers 14 sectors and a small share of India’s manufacturing.
5.4 Foreign Direct Investment (FDI)
Since 2014, India has used two main tools together. First, higher import duties. Second, easier foreign investment rules (Government of India, 2014). The idea was to make it costly to import finished goods, while making it simpler for foreign companies to invest directly in Indian factories. In this way, global firms would have a reason to produce inside the country instead of just exporting to India. The question this section examines is whether relaxed FDI caps complemented tariff protection to genuinely build domestic manufacturing, or whether they simply attracted assembly activity that remains shallow and import dependent.
The numbers suggest that this approach is associated with some success, though causation is difficult to establish. Total foreign investment in India crossed $700 billion between 2014 and 2024 (DPIIT, 2024). This money was not going into stocks or speculation instead it went into building factories and production capacity on the ground. Instead of manufacturing alone, much of this FDI flowed into services and digital infrastructure. However, disentangling how much was drawn specifically by tariff protection versus broader market access remains unclear. The mobile phone industry shows the association most clearly where higher customs duties on finished smartphones made importing them expensive so instead global brands started setting up assembly units in India. Smartphone exports reached $15.6 billion by 2024 (Ministry of Commerce, 2024). For a country that once imported nearly every phone its people used, this was a notable shift yet India still brings in high value parts like chips and displays from abroad (WITS, 2024). The Reserve Bank of India estimates local value addition at 15% to 25% (RBI, 2024). This means that 75% to 85% of value continues to be imported. This suggests that the FDI attracted by tariff walls has built assembly capacity but not the deeper component ecosystem that would signal genuine manufacturing depth.
World Trade Organization data confirms that India’s average import tariffs went up after 2014 to protect new local industries (WTO, 2024). This created a problem too. In some sectors, importing components became more expensive than importing finished goods. Economists call this an inverted duty structure (RBI, 2024). It is messy. But the main incentive still held global firms looked at the high tariffs on finished products and chose to set up domestic plants to get around them. So the combination of protective tariffs and relaxed FDI rules has done what it was supposed to do. It has built initial manufacturing capacity. It has created jobs. It has got factories running. Whether this leads to deeper industrial development moving from assembly into design, components, and higher value work is the question for the next phase.
5.5 Higher Tariffs on Imported Goods
Since 2014, India has raised import taxes under the Make in India initiative to promote self-reliance and reduce dependency on foreign goods. This marked a shift toward protective trade policies designed to shield domestic industries from heavy foreign competition, particularly from surging imports, while helping to narrow the trade deficit. The central question this section addresses is whether these tariff walls have genuinely helped the growth of domestic manufacturing, or whether they have disproportionately raised input costs for downstream industries, undermining the competitiveness they sought to build.
Descriptive trends indicate that these protective measures are associated with the expansion of local production capacities, though the direction of causality cannot be established without further empirical analysis. According to World Trade Organization (WTO) data, India’s average applied tariff rate rose from roughly 13% in 2014 to nearly 18% by 2020 (WTO, 2020). This increase coincided with a rise in domestic manufacturing activity, suggesting that higher tariffs may have created conditions where global companies found it more economical to establish local factories. However, this association does not rule out other factors, such as concurrent FDI liberalisation, the Production Linked Incentive (PLI) scheme introduced in 2020, or broader shifts in global supply chains away from China.
The electronics sector offers the clearest illustration where the government raised customs duties on fully assembled mobile phones from 10% to 20% (Government of India, 2018). Ministry of Commerce data shows that smartphone exports climbed to $15.6 billion by 2024 (Ministry of Commerce, 2024), and domestic assembly units grew from 2 in 2014 to over 300. Yet this evidence must be read carefully. World Integrated Trade Solution (WITS) data indicates that factories still import the majority of high value components chips, displays, and semiconductors which suggests that dependency has rather shifted than disappeared (WITS, 2024). The Reserve Bank of India notes local value addition at 15% to 25% (RBI, 2024), meaning 75% to 85% of value still comes from abroad. This suggests that India has reduced dependency on finished phones, but not on inputs.
There is also tension in the employment data where Periodic Labour Force Survey data shows industrial employment growing at 5%- 7% annually. At the same time, Ministry of Statistics and Programme Implementation (MoSPI) data shows manufacturing’s share of GDP remained stable at 14% – 17% (MoSPI, 2025). If employment rises but GDP share stays flat this means that manufacturing is absorbing labour without becoming more productive. This means that tariff driven growth has concentrated in low skill, low margin assembly. This is supported by micro data showing capital and labour flows into MSME sectors like textiles and toys (MoSPI, 2025) where we can say that these sectors are labour intensive but rarely drive structural transformation.
In sum, the evidence indicates an association between rising tariffs and reduced dependency on foreign finished goods. However, this reduction is partially confined to final products but not components and also employment gains reflect low productivity absorption. Tariffs appear effective for initial capacity building, but whether they sustain higher value competitiveness remains uncertain without investments in skills, infrastructure, and component manufacturing.
5.6 Challenges and Criticisms
Since the launch of the ‘Make in India’ initiative in 2014, the Indian government has strategically shifted towards a policy of ‘Atmanirbhar Bharat,’ or self-reliance. A key component of this strategy has been the systematic increase in import duties across various sectors, including electronics, toys, auto components, and textiles . The primary goal is to foster domestic manufacturing and reduce reliance on foreign goods. However, this protectionist approach has generated considerable debate among economists and industry leaders. Critics argue that while these measures might offer short term protection to local industries, they often lead to systemic inefficiencies that impede India’s long term ambition of becoming a global manufacturing hub.
The Paradox of Production Costs
One of the criticisms of escalating import taxes is their direct impact on production costs. Modern manufacturing is not a localized process rather it involves a complex assembly of components sourced globally. For many Indian industries, imported raw materials and intermediate goods are not optional luxuries but essential inputs. When the government imposes higher tariffs on these items, it inadvertently taxes the very domestic producers it aims to support. This situation is often termed as an inverted duty structure where the tax on imported raw materials or components is higher than that on the finished product (RBI, 2024). This places domestic manufacturers at a disadvantage compared to foreign competitors who can import finished products at a lower effective rate. Furthermore, the introduction of additional protective layers, such as the Social Welfare Surcharge (SWS) and the Agriculture Infrastructure and Development Cess (AIDC), means that the ‘effective’ rate of protection often significantly exceeds the Basic Customs Duty (BCD) . For example, a 7.5% BCD can escalate to over 30% once anti-dumping duties and surcharges are included (Ministry of Finance, 2023). This substantially raises capital expenditure for Indian firms, particularly small and medium enterprises that lack the scale to absorb such costs or negotiate supplier contracts abroad.
India-Specific Examples:
In the electronics sector, tariffs on certain components have risen to 20-25%, especially for items not on exempt lists (Ministry of Finance, 2023).This is notably higher than tariffs in competing nations like China and Malaysia. While the government aims to boost local production, these high duties on essential components can increase the final cost of domestically manufactured electronics, potentially making them less competitive globally. For example, the assembly of smartphones in India, despite government subsidies and initiatives like those encouraging Apple’s expansion, still heavily relies on imported components(WITS,2024). The increased cost of these components due to tariffs can offset some of the benefits of local assembly .
Similarly, in the auto components sector, Indian manufacturers often face increased costs due to duties on specialized raw materials and intermediate goods. While specific tariff percentages vary, the overall policy of increasing import duties has led to a situation where local production of certain auto parts becomes more expensive. This impacts the competitiveness of Indian auto component manufacturers in the global supply chain, even as the government seeks to promote domestic production through schemes like the Production Linked Incentive (PLI) schemes (DPIIT,2024).
Hindrance to Global Value Chain (GVC) Integration
In the contemporary global economy, approximately 70% of international trade occurs within Global Value Chains (GVCs)(WTO, 2023) . These chains depend on the smooth, cost effective movement of intermediate goods across national borders. By maintaining some of the highest average applied tariffs among G20 nations, India risks isolating itself from these crucial networks(WTO, 2024). Critics highlight that countries such as Vietnam, Thailand, and China have successfully integrated into GVCs by keeping their import barriers on intermediate goods exceptionally low(World Bank,2023). This strategy allows them to function as efficient assembly hubs where components are imported, value is added, and the final product is exported. In contrast, India’s high tariffs on intermediate goods (averaging around 15.0%) create significant friction . As global firms explore ‘China Plus One’ alternatives, India’s trade barriers may render it less attractive compared to peers offering a more liberalized trade environment.
|
Country |
Tariffs on All Goods (%) |
Tariffs on Intermediate Goods (%) |
|
India |
17.7 |
15.0 |
|
Vietnam |
9.4 |
5.8 |
|
China |
7.4 |
7.0 |
|
Thailand |
7.6 |
4.7 |
|
Malaysia |
4.9 |
5.0 |
Source: Based on World Bank WITS Data (2022)
Table 8: Tariffs on all goods and intermediate goods.
Impact on Market Competitiveness and Exports
The ultimate consequence of high import taxes is often reduced export competitiveness. When a domestic manufacturer incurs higher costs for essential inputs like steel, electronic components, or specialized chemicals due to import duties, the final price of their product increases(RBI,2024). In a globally price sensitive market, even a marginal 2-3% increase in production costs can determine whether the firm will win or lose a contract.
There is a growing concern that protectionism fosters complacency. By shielding domestic industries from foreign competition, there is less reason for local firms to innovate or enhance efficiency. Instead of becoming ‘global champions,’ protected industries risk becoming overly reliant on government support, struggling to compete once they venture beyond the domestic market. Descriptive trends indicate that while India’s merchandise exports have grown, they still make up only around 13% of GDP (MoSPI, 2025). This is low compared to other emerging economies. The evidence suggests that the transition to an export led growth model remains a significant challenge, and that tariff walls may have helped build domestic capacity without translating into global competitiveness.
Manufacturing Share of GDP: A Stagnant Trend
Despite the ‘Make in India’ initiative launched in 2014 to boost manufacturing, a stagnant trend is shown by the data on manufacturing value added as a percentage of India’s GDP. From 2014 to 2024, the share has not shown a sustained increase whereas it is hovering between 14% and 17% (MoSPI, 2025). This challenges the effectiveness of protectionist policies in significantly expanding the sector’s contribution to the national economy. Descriptive trends indicate that while there may be yearly fluctuations, overall it has not resulted in a substantial rise in manufacturing’s share of GDP. This stagnation raises questions about whether current tariff strategies have achieved the desired industrial growth and integration into global supply chains.
The figures are as follows :
|
Year |
Manufacturing Value Added (% of GDP) |
|
2014 |
15.07 |
|
2015 |
15.58 |
|
2016 |
15.16 |
|
2017 |
15.02 |
|
2018 |
14.88 |
|
2019 |
13.46 |
|
2020 |
14.12 |
|
2021 |
14.38 |
|
2022 |
13.15 |
|
2023 |
13.02 |
|
2024 |
12.61 |
Table 9: Manufacturing value added (% of GDP)
The criticisms of India’s rising import taxes do not suggest that all protection is inherently detrimental. Rather, they argue that it must be pragmatic and time bound. For ‘Make in India’ to succeed, the policy framework needs to differentiate between safeguarding nascent industries and burdening established ones with high input costs. To genuinely integrate into global networks, India may need to re-evaluate its tariff strategy on intermediate goods. A more nuanced approach is reducing barriers for essential manufacturing inputs while offering targeted incentives like the Production Linked Incentive (PLI) schemes that could provide a more effective path forward (DPIIT, 2024). Ultimately, the objective of self-reliance should not be to close India’s economy to the world, but to ensure that when India engages in the global market, it does so from a position of competitive strength rather than protected isolation.
5.7 Long-Term Economic Objectives
What are India’s rising import tariffs really trying to achieve?
When Make in India launched in 2014, the pitch was simple: turn India into a country the world manufactures in, not just one it sells to. Over a decade later, the policy’s clearest fingerprint isn’t factories springing up overnight—it’s a steady climb in import duties on everything from phones to cars to washing machines. Behind that tariff wall sits a set of goals that go well beyond “protect local industry.” Here’s what India has actually been trying to do, and how close it’s gotten. Building a Manufacturing Hub, Not Just Protecting One
The original logic was hard to argue with. Raise the duty on a finished smartphone or car imported from abroad, and suddenly it makes more financial sense for that company to just build the thing in India instead. Tariffs can nudge a decision here and there, but they can’t substitute for decent infrastructure, faster permitting, or a reliable supply of quality components. Without those, making imports pricier doesn’t automatically translate into a thriving domestic industry. Chipping Away at the Trade Deficit
A second motive, often unspoken but always present, was India’s lopsided trade relationship with China and its broader trade deficit. Electronics, machinery, and pharmaceutical inputs kept piling up on the import bill year after year, and policymakers saw tariffs as one lever to slow the bleeding. . Make imports more expensive, the thinking went, and over time consumption habits would shift toward what’s made at home, gradually closing the gap. However, the evidence suggests a more complex picture. India’s share of global imports grew from 1.5% in 2005 to 2.9% in 2023, a sign the country is more woven into world trade than ever, tariffs or not. Meanwhile, the trade deficit kept widening rather than shrinking—$210.8 billion between April and December 2024, up from $189.7 billion over the same stretch a year earlier. Growing Real Industrial Capability, Not Just Assembly Lines
There’s a difference between building factories and building capability, and India’s tariff strategy aimed at the latter. The goal wasn’t to become a country that screws together imported parts—it was to develop the skills, technology base, and supply chains needed to design and manufacture complex products from scratch. Higher duties on finished goods were supposed to buy domestic industries the breathing room to grow into that role. COVID-19 made the stakes of this very concrete. When global supply chains seized up almost overnight, countries that leaned too heavily on imports—particularly from a single source like China—found themselves dangerously exposed, especially for things like pharmaceuticals and medical equipment. “Build it here” stopped being just an economic preference and started looking like basic national security. India’s solar panel sector is a useful example: domestic content rules did grow local manufacturing capacity, but Indian-made panels still ran about 14% more expensive than imported ones, and exports never really took off. Electronics tell a similar story—tariffs on intermediate components have pushed up production costs for Indian manufacturers trying to compete globally. Notably, a study from the Indian Council for Research on International Economic Relations recommended dropping localization requirements from schemes like PLI altogether, arguing that chasing export competitiveness would do more for domestic value addition than insulation ever could. A Growth Model That Doesn’t Lean on Imports
Underneath all of this sits a bigger ambition: an economy that grows on the strength of its own production and consumption, rather than one constantly at the mercy of import bills and volatile commodity prices. Some sectors have added jobs, no question, but overall the employment gains have fallen well short of that promise, largely because manufacturing growth itself hasn’t moved as fast as the policy assumed it would.
5.8 Protection of Domestic Industries
India’s import tariff structure changed considerably after 2014. Before the Make in India policy took hold, the country had spent over two decades moving toward trade liberalisation, cutting duties, opening sectors, and integrating with global supply chains. That trajectory reversed. The government began raising duties on a range of goods, particularly in manufacturing heavy sectors where India was almost entirely import dependent. The idea behind this policy was straightforward: cheaper foreign goods were undercutting local producers, and without some form of price protection, domestic industry had little room to grow.
The numbers back this up. India’s average import duty went from 13.5 percent in 2014 to 18.3 percent by 2021,a meaningful jump over seven years. WTO trade review data (WT/TPR/S/403) shows the share of tariff lines carrying duties above 10 percent nearly doubled across the same period, from 12.1 percent to 22.1 percent. In mobile phones, the government imposed a 20 percent duty on printed circuit board assemblies and chargers in 2020, and 10 percent on display panels components that had previously flowed in cheaply from China.
The effect on the mobile phone market was striking. Table 10 tracks the shift between 2014 and 2023. In 2014, imported handsets made up 78 percent of the Indian market. By 2023, that figure had collapsed to just 3 percent. Over the same window, domestic production climbed from 60 million units to 330 million. Companies like Samsung, Apple, and Xiaomi which had previously shipped finished products into India set up or expanded local assembly lines once the cost of importing became prohibitive. The tariff wall in this case, did exactly what it was designed to do.

Table 10: India Mobile Phone Market — Imported vs. Domestically Manufactured (2014–2023)
Tariffs were not working alone. Anti-dumping measures, BIS certification requirements, and the Production Linked Incentive (PLI) scheme all reinforced the same goal. But the tariff hikes were the trigger that changed the economics of importing overnight, and forced both foreign firms and Indian manufacturers to rethink where production should happen. The mobile phone sector is now the clearest evidence India has that targeted import taxes, when paired with supporting policy, can shift a market from near total foreign dependence to majority domestic supply within a single decade.
5.9 Growth of Manufacturing Sector
When import duties started climbing after 2014, one of the clearest places to track the effect was employment. The government had promised 100 million new manufacturing jobs by 2022, an ambitious target that was not reached. But underneath that headline, the sector’s job numbers tell a more interesting story than a single missed figure.
Before Make in India, the manufacturing sector employed around 30.3 million workers (6th Economic Census, 2013-14). By 2016-17, that had risen to 51.3 million, a sharp jump that coincided with early tariff hikes and duty revisions on electronics, auto parts, and consumer goods. Government estimates put the figure at 62.4 million by 2022-23. The job creation growth rate in manufacturing went from 6 percent in the decade before 2014 to 15 percent in the decade after more than doubling.
Figure below tracks these changes across four time points, breaking each bar into organised (formal) and unorganised (informal) sector jobs. The organised sector grew from 27 percent of the total in 2011-12 to 37 percent by 2022-23. That shift matters because organised sector jobs are tied to registered factories, formal wage structures, and capital investment, the kind of industrial activity that import protection was designed to attract.
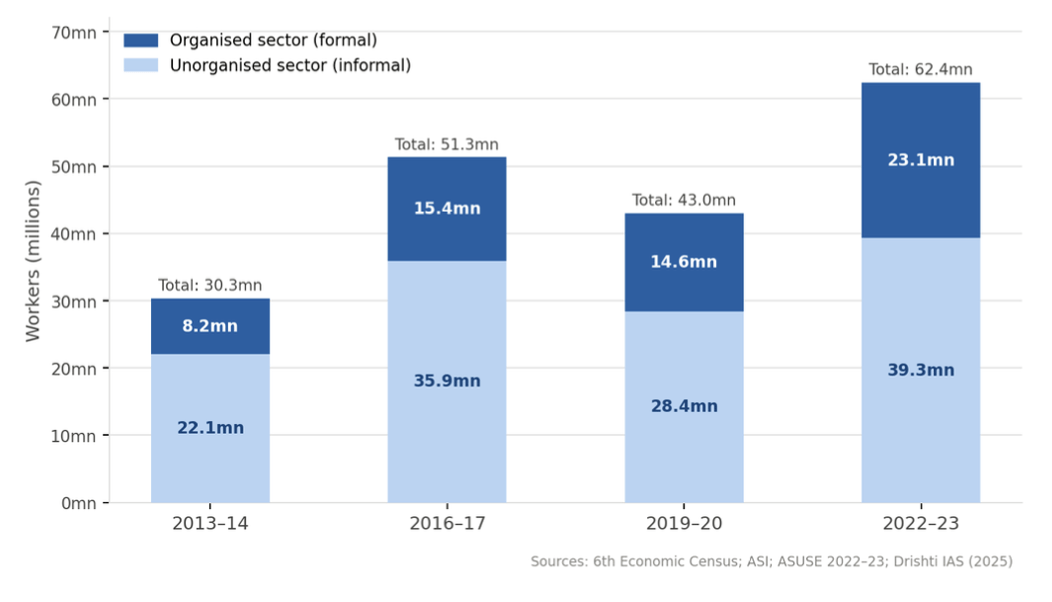
Figure 7: Manufacturing Employment in India — Organised vs. Unorganised Sector (2013–2023)
The electronics segment offers the sharpest evidence. After duty hikes on components between 2017 and 2020, electronics production grew sixfold over eleven years. Value addition within the sector jumped from 30 percent to 70 percent meaning more of the manufacturing process was happening inside India rather than abroad. Each added stage of production translates directly into workers on factory floors.
There are honest limits here too. Some private estimates put manufacturing employment at 35.7 million in 2023 lower than the 2017 peak with the pandemic accounting for some of that dip. The sector’s share of total employment sits at around 12 percent, well short of what policymakers envisaged. But the direction of the organised sector’s growth, driven partly by the protective tariff environment, suggests the policy created real conditions for formal industrial expansion even if the scale fell short of its targets.
5.10 Impact on Imports and Trade
The Make in India initiative did not just aim to build factories, it was designed to change the structure of what India buys from the world. Rising import duties were the primary tool. When the cost of bringing in foreign goods goes up, businesses and consumers look inward. That shift played out differently across sectors, but its effects on India’s trade flows between 2014 and 2023 are visible in both the aggregate numbers and the product level data.
In the electronics sector, the impact was sharp and direct. Mobile phone imports fell from USD 3.6 billion in 2017-18 to under USD 1 billion by 2022-23 a drop of over 70 percent in five years. This happened because duties on finished handsets were raised to 20 percent, making it cheaper to assemble phones inside India than to import them. Global firms including Apple, Samsung, and Xiaomi responded by shifting production to Indian facilities. The result was not just fewer imports; it was a structural change in how the mobile industry operated in India.
Auto components told a similar story. Duties of 15 to 25 percent on imported parts pushed several manufacturers to localise their supply chains, reducing dependence on Japanese and German components. Toy imports from China fell by nearly 70 percent between 2018 and 2022 after duties were raised from 20 to 60 percent, while domestic toy production grew correspondingly. These are sectors where the tariff mechanism worked as intended, higher duties compressed imports, and domestic industry filled the gap.
At the aggregate level, India’s trade deficit narrowed from USD 136 billion in 2014 to USD 80 billion in 2023, which points to some improvement in the overall trade balance over the decade. Figure 1 below shows India’s total imports and exports side by side from 2014 to 2023. Imports dipped in 2016 following early duty revisions on consumer goods, recovered as the economy expanded, and spiked in 2022 largely due to global oil and commodity price surges factors unrelated to tariff policy. Exports grew steadily over the same period, closing the gap gradually.
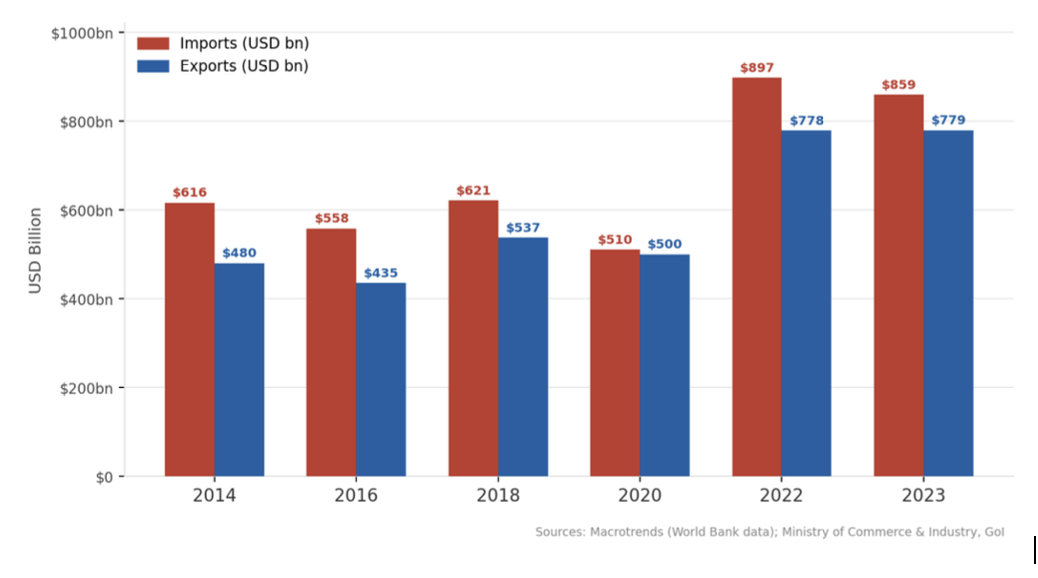
Figure 8: India’s Imports vs. Exports (2014-2023, USD Billion)
The chart shows that while total import value did not fall over the decade rising demand and oil prices kept the bill high the composition shifted meaningfully. Manufactured goods imports declined as domestic production absorbed more of the market, while commodity imports (crude oil, coal, gold) which cannot be replaced by local production, grew as a share of the total. That compositional shift is the more accurate measure of Make in India’s trade impact than the headline import figure alone.
Where the policy fell short was in sectors with no viable domestic alternative. Crude oil, coal, and industrial inputs account for over 40 percent of India’s total import bill. No tariff can substitute for these. India’s continued dependence on energy imports limited how far the overall trade deficit could be compressed, regardless of how well the manufacturing protection strategy performed in electronics, toys, or auto parts.
6. Conclusion
In conclusion India’s experiment with rising import duties under Make in India was rooted in a legitimate diagnosis. By 2014, the country was heavily dependent on foreign goods across critical sectors, running a trade deficit of $136 billion, and watching its manufacturing sector stagnate at around 15-17% of GDP despite decades of policy attention. Something needed to change, and the government’s response was to deliberately build a tariff wall, attract investment behind it, and let domestic industry grow into the space.
A decade later, the picture is mixed in ways that resist easy conclusions. There are genuine wins. Mobile phone manufacturing transformed almost entirely, toy imports were slashed, FDI into manufacturing crossed $148 billion between 2014 and 2023, and the organised manufacturing workforce grew meaningfully. These outcomes show that targeted tariff policy, when paired with complementary measures like PLI schemes and liberalised FDI rules, can shift industrial behaviour in real and measurable ways. Yet the headline targets were missed by significant margins. Manufacturing’s share of GDP declined rather than rising to the promised 25%. The trade deficit widened over time rather than closing. The 100 million jobs target went unmet. And India’s tariffs on intermediate goods, while lower than on consumer products, still left domestic manufacturers paying more for essential inputs than competitors in Vietnam, Thailand, or China quietly undermining the very export competitiveness the policy was trying to build.
What this decade of evidence ultimately suggests is that import duties alone cannot industrialise an economy. They can redirect market incentives, protect emerging industries from being undercut, and buy breathing room. But without matching improvements in infrastructure, logistics, skill development, and ease of doing business, the wall becomes a ceiling rather than a foundation. Make in India shifted India’s economic mindset from passive consumer of global manufacturing to active participant and that shift matters. The question going forward is whether India can move beyond protection toward genuine competitiveness, building industries strong enough to win not just at home, but in global markets where no tariff wall follows them.
Acknowledgements: I would like to thank Niriksha and Keeba for their valuable contribution to
this report.
7. References
Atlantis Press. (n.d.). The impacts of trade protectionism on the Indian economy. https://www.atlantis-press.com/proceedings/icemci-21/125966047
Cato Institute. (2023). Globalization has propelled India to prosperity. https://www.cato.org/publications/globalization-has-propelled-india-prosperity
Chang, H. J. (2002). Kicking away the ladder: Development strategy in historical perspective. Anthem Press. https://anthempress.com/kicking-away-the-ladder-9781843310273
Data For India. (2026). Counting manufacturing jobs in India. https://www.dataforindia.com
Department for Promotion of Industry and Internal Trade. (2024). FDI statistics. Ministry of Commerce and Industry, Government of India. https://dpiit.gov.in/foreign-direct-investment/foreign-direct-investment-data
Department for Promotion of Industry and Internal Trade. (2025). Fact sheet on foreign direct investment (FDI): From April 2000 to March 2025. Ministry of Commerce and Industry, Government of India. https://dpiit.gov.in/foreign-direct-investment/foreign-direct-investment-data
Down to Earth. (2024). 10 years of Make in India: Did it achieve its goals? https://www.downtoearth.org.in/
Drishti IAS. (2025). The rise of the Indian manufacturing sector.
Government of India. (2024). Economic survey 2023–24. Ministry of Finance. https://www.indiabudget.gov.in/
Government of India. (2024). Union budget 2024–25: Budget speech and customs duty proposals. Ministry of Finance. https://www.indiabudget.gov.in/
India Cellular and Electronics Association, & Ministry of Electronics and Information Technology. (2023). Mobile manufacturing data 2023. Government of India. https://icea.org.in
Indian Council for Research on International Economic Relations. (2023). Working papers on trade policy, tariffs and manufacturing. ICRIER. https://www.icrier.org/publications/working-papers/
International Monetary Fund. (2022). Tariffs and economic activity (IMF Working Paper No. WP/22/40). https://www.imf.org/-/media/files/publications/wp/2022/english/wpiea2022040-print-pdf.pdf
Invest in India. (2023). FDI in Make in India: Transforming the manufacturing landscape. Government of India. https://www.investindia.gov.in/blogs/fdi-make-india-transforming-manufacturing-landscape
IISPPR Data Science Team. (2026). India’s import tariffs and trade patterns: Did Make in India’s tariff policy reduce import dependence and China exposure? Evidence from 2010–2023 [Unpublished internal report]. IISPPR.
Krueger, A. O. (1997). Trade policy and economic development: How we learn. American Economic Review, 87(1), 1–22. https://www.nber.org/system/files/working_papers/w5896/w5896.pdf
Kumar, A. (2021). Global value chains and India’s manufacturing ambitions. Journal of International Trade and Economic Development, 30(4), 521–540.
Macrotrends. (2023). India imports & exports historical data [Data set]. https://www.macrotrends.net
Mehta, S. (2019). Sectoral outcomes of tariff protection: Toys, textiles and the limits of duty policy. Indian Economic Review, 54(2), 201–219.
Mehta, S., & Goyal, N. (2021). Solar manufacturing and trade policy in India: A developmental state perspective. Energy Policy, 152, 112–129.
Ministry of Commerce and Industry, Government of India. (2014). About Make in India. https://www.makeinindia.com/about
Ministry of Commerce and Industry, Government of India. (2014). Annual trade statistics FY 2013–14. https://commerce.gov.in
Ministry of Commerce and Industry, Government of India. (2023). Annual trade statistics. https://commerce.gov.in
Ministry of Electronics and Information Technology, Government of India. (2023). Electronics production data. https://www.meity.gov.in
Ministry of Finance, Government of India. (2018–2024). Union budget documents (2018–19 to 2023–24). https://www.indiabudget.gov.in
Ministry of Statistics and Programme Implementation, Government of India. (2014). Sixth economic census 2013–14. https://mospi.gov.in
Ministry of Statistics and Programme Implementation, Government of India. (2023). Annual survey of unincorporated sector enterprises (ASUSE) 2022–23. https://mospi.gov.in
Ministry of Statistics and Programme Implementation, Government of India. (2024). National accounts statistics 2024. https://mospi.gov.in
Mishra, S. K., & Puri, V. K. (2023). Indian economy (42nd ed.). Himalaya Publishing House.
Nagaraj, R. (2022). Why India’s manufacturing share refuses to rise. Cambridge Journal of Economics, 46(3), 611–629.
Nair, A. (2018). India’s tariff trajectory and its implications for trade negotiations. Economic and Political Weekly, 53(31), 45–52.
Nair, A. (2020). Import compression or import substitution? Revisiting India’s tariff hike outcomes. World Economy, 43(9), 2310–2328.
NITI Aayog. (2018). Strategy for New India @75. Government of India.
Observer Research Foundation. (2025). Emerging economies and the tariff taper. https://www.orfonline.org
Organisation for Economic Co-operation and Development. (2023). FDI regulatory restrictiveness index. OECD.
Patel, D., & Iyer, R. (2023). Protection as scaffolding: Rethinking industrial policy in post-reform India. Cambridge Journal of Economics, 47(2), 233–258.
Reserve Bank of India. (2024). Annual report 2023–24. Reserve Bank of India.
Reserve Bank of India. (2024). Handbook of statistics on Indian economy 2023–24 (Table 90). https://www.rbi.org.in/Scripts/AnnualPublications.aspx?head=Handbook%20of%20Statistics%20on%20Indian%20Economy
Rodrik, D. (2004). Industrial policy for the twenty-first century (CEPR Discussion Paper No. 4767). Centre for Economic Policy Research.
Sharma, V. (2022). India–China trade deficit and the limits of tariff rebalancing. Asian Economic Policy Review, 17(1), 88–105.
Singh, R., & Bansal, M. (2020). Import substitution redux: Lessons India must not repeat. Vikalpa: The Journal for Decision Makers, 45(3), 131–143.
Srinivasan, T. N. (2022). India and regional trade architecture: Lessons from the RCEP withdrawal. World Economy, 45(6), 1789–1812.
United Nations Conference on Trade and Development. (2024). World investment report 2024: Investment facilitation and digital government. United Nations. https://unctad.org/publication/world-investment-report-2024
Vajirao & Reddy Institute. (2024). Make in India: Overview, objectives and achievements. https://vajiramandravi.com/current-affairs/make-in-india/
Verma, K. (2020). Cost pass-through and competitiveness: Tariff hikes in India’s automobile components industry. International Journal of Industrial Organization, 72, 102–644.
World Bank. (2022). World integrated trade solution (WITS) tariff data [Data set]. https://wits.worldbank.org/
World Bank. (2023). Tariff rate, applied, weighted mean, all products — India [Data set]. https://data.worldbank.org/indicator/TM.TAX.MRCH.WM.AR.ZS?locations=IN
World Bank. (2024). World development indicators. World Bank.
World Integrated Trade Solution. (2023). India tariff and trade profile 2011–2023 [Data set]. World Bank. https://wits.worldbank.org/CountryProfile/en/Country/IND/Year/2023/Summary
World Trade Organization. (2020). Trade policy review: India. WTO. https://www.wto.org/english/tratop_e/tpr_e/tpr_ind_21jul26_e.htmhttps://www.wto.org
World Trade Organisation. (2021). Trade policy review: India (WT/TPR/S/403). https://www.wto.org/english/tratop_e/tpr_e/s403_e.pdf
World Trade Organization. (2024). World tariff profiles 2024. WTO. https://www.wto.org/english/res_e/publications_e/world_tariff_profiles24_e.htm