Authors:
Kruthi Paturi, Reedhima Srivastava, Pranshu Dass, Sai Kuche, Devhooti Pant, Rinsha, Madhav Gupta
1. ABSTRACT:
India’s Make in India initiative, launched in 2014, used import tariffs as a tool to boost domestic manufacturing, cut reliance on foreign goods, and build economic self-reliance. This study asks a simple question: did raising tariffs achieve these goals? Using tariff and import data from the WITS database (2010–2023), we look at how tariff rates, import volumes, and import patterns changed over time, with a specific focus on India’s trade relationship with China. We rely on descriptive statistics, category comparisons, and correlation analysis to test how effective tariff protection really was.
The results are mixed. Tariffs did rise during the Make in India years, but the biggest jump happened suddenly in 2018–2019, not as a steady trend after 2014. More surprisingly, India’s total imports nearly doubled between 2010 and 2023 — the opposite of what policymakers hoped for. China’s share of India’s imports also grew, from 11.1% to 16.1%, over the same period. Statistically, the link between tariff rates and import volumes turns out to be weak, suggesting tariffs alone didn’t do much to cut import dependence. Looking at sector by sector, tariff hikes were concentrated mainly in agriculture and consumer goods, while industrial inputs, capital goods, and petroleum — all crucial for production and energy needs — kept facing relatively low tariffs.
Overall, the study suggests that India’s tariff policy worked more like a selective, sector-specific protection tool than a broad strategy to cut import dependence. Tariffs alone weren’t enough. Achieving the real goals of Make in India will likely require tackling deeper issues — manufacturing competitiveness, productivity, infrastructure, and stronger integration into global supply chains.
Keywords: Make in India, Import Tariffs, Domestic Manufacturing, India-China Trade, Foreign Dependence, Tariff Protection, Self Reliance
2. INTRODUCTION:
In 2014, 11.1% of the goods India imported came from China. A decade, three policy overhauls and a flagship ‘self-reliance’ mission later, that number is 16.1% and China’s share peaked not during a forgotten pre-reform era, but in 2016, two years after Make in India launched. This raises the question of whether India reduced its reliance on the country it most wanted to stand apart from, or whether that dependence instead deepened.
This paper examines the trajectory of Make in India, asking whether the instrument, reducing import dependence by progressively raising the import tariffs, functioned as an effective industrial strategy and global positioning tool and delivered on its ambition, or if the hidden costs have quietly outrun the gains. The theoretical stakes of that question are older than Make in India itself: it lies at the center of the ‘True Industrial Policy’ debate, which was between the Asian miracle economies — South Korea, Malaysia, Taiwan — and developing nations such as India.
This case has a shared starting point where the initial trajectories aligned, based on (i.) state intervention to channel resources towards sophisticated industries, typically heavy industries such as steel and petrochemicals and (ii.) high tariffs to protect domestic producers. The two groups diverged at a decisive turning point, which altered their economic outcomes. The divergence was based not in the instrument but in the orientation.
The Asian miracles targeted export markets; exposure to advanced markets enforced competition, compelled firms to raise productivity and sustained technological upgradation. Developing nations, among them India, chose to shield the domestic market from foreign competition instead. This deprived firms of market feedback, raised input costs, discouraged foreign investment and created structural dependence on the very imports the tariffs were meant to replace. The Asian miracle’s focus on export orientation led them to a shift from a low-income status to a high-income status, with sustained levels of growth in their economy. The lesson from the True Industrial Policy literature is not merely historical; it raises the question of whether Make in India risks repeating a similar pattern.
The academic literature on Make in India and import tariff policy has evolved into three broad waves, each asking sharper questions, yet none asking the question that matters the most. The earliest wave, amid the policy’s launch, was mostly diagnostic and asked questions related to the structural aspects of the policy, regulations, infrastructure and whether tariff protection is the right approach when there are such huge structural gaps in the country. The earlier studies were optimistic about the transformational effect and acknowledged there was a need for institutional rectification.
The second wave, around 2020-21, was found to demonstrate that investment-oriented policies outperformed import-restricting measures because India depends on intermediate imports, which, when tariffed heavily, increase their cost and lead to constrained domestic value added. This led to a difficult conclusion by the scholars that the tool and the objective were working against each other. Evaluation coming closer to evidence in the third wave focused more on the need for FDI and productive investment.
Yet a persistent discrepancy remains; most studies ask the same inward-looking questions — Is the policy working for India? What internal bottlenecks need to be addressed? Did manufacturing capacity rise? What most studies overlooked were the outward-facing questions, such as: what did raising tariffs cost India in its global economic relations?
Such questions matter because the costs were real and accruing. This was a signal of concern because by raising steep tariff barriers, India signaled strained global ties that provoked two WTO disputes over electronic tariffs.
This leads us to the second gap that the current literature has not tackled. The majority of the researchers just scratch the surface of the issue, asking the relevant questions yet failing to establish a proper relationship between the variables that could yield a clearer conclusion regarding the policy.
This paper’s central research question is: To what extent did Make in India’s tariff strategy reduce import dependence and China’s share in India’s imports and what external economic consequences accompanied its implementation? This question is pursued through sub-questions and delivers the understanding of the extent to which Make in India’s strategy affected its import volumes as well as its structural dependence on China and explores the external economic consequences it imposed in terms of WTO compliance and diplomatic & supply-chain costs that accompanied its implementation.
What sets this study apart from the existing literature is its evidence-based research. It pairs the aggregate tariff-import correlation along with the distribution of tariffs at the product level and diplomatic ties of the nation to assess whether any benefits justify the external costs of the policy.
3. LITERATURE REVIEW
3.1 Overview
Since the launch of the Make in India initiative in 2014, India has increasingly adopted import tariffs and other industrial policy measures to strengthen domestic manufacturing and reduce dependence on foreign goods. Over time, tariff rates on several products were raised, while complementary measures such as anti-dumping duties, safeguard duties and the Production
Linked Incentive (PLI) schemes were introduced to support domestic industries. Researchers’ conclusions diverge depending on whether they measure success through domestic indicators (GDP, FDI, manufacturing output) or through India’s external trade position (import volumes, import composition, dependence on specific trading partners). This review compares their evidence against each other and against the present study’s own findings, to locate where the literature agrees, where it disagrees and where the gap lies.
3.2 Make in India: Policy Framework, Impact and Competitiveness Challenges
Studies using domestic macroeconomic indicators tend to report favourably on the policy, while studies using structural or input-cost indicators are more cautious.Ghuge (2020) found FDI inflows rose from USD 24.3B (2013–14) to USD 44.9B (2017–18), but his own GDP data shows growth peaking at 8.2% in 2016 before declining to an estimated 6.12% by 2019 — leading Ghuge himself to conclude GDP showed no considerable improvement. Patel(2025) reported similarly strong FDI and export growth (FDI to USD 84.8B by 2022; exports to USD 776B in 2022–23) and this reflected reduced import dependence. This conclusion sits awkwardly against the present study’s own finding that total imports rose 86% over 2010–2023 (USD 1,023B to USD 1,899B) — suggesting FDI and exports grew alongside imports rather than instead of them.
Rawat et al. (2020) add a similar note of caution: India’s rise to 63rd of 190 countries on the Ease of Doing Business Index came without a comparable structural transformation. A second cluster of studies argues the policy’s ambitions outpaced its foundations. Mehrotra (2020) found manufacturing’s share of GDP stuck at 16% from 1991 through 2018, with employment stuck under 12.8% of the workforce — a stagnation spanning several years of Make in India itself. Contractor (2018) reached a similar conclusion from a competitiveness angle, attributing India’s gap with China to infrastructure, regulation and skilled-labour shortages rather than insufficient protection. This lines up with the present study’s category-level data: the highest tariffs fell on Agriculture (32.69%) and Consumer Goods (12.54%), while Industrial products — the largest import category at USD 4,624B — carried one of the lowest tariffs (7.91%). This pattern favours Mehrotra’s and Contractor’s structural view over the more direct tariff-to-outcome link Ghuge and Patel imply.
Tripathy and Dastrala (2023) found the PLI scheme drew real investment into electronics, automobiles and pharmaceuticals, but conditioned this success on continued progress in infrastructure and skills. Taken together, this literature suggests tariff protection alone, without sectoral and institutional reform is unlikely to be sufficient.
3.3 Trade Protectionism and Tariff Policies
This strand examines the tariff instrument directly and its quantitative evidence is more comparable to the present study’s own results.Cheng et al. (2021) found a negative relationship between tariffs and GDP growth (adjusted R²above 99%), though energy consumption had a far larger effect on GDP than tariffs did. This is broadly consistent with the present study’s own near-zero correlation between tariffs and import volumes (r = -0.02, p = 0.94) — both studies find tariffs to be a comparatively weak lever next to other structural variables.
Narayan et al. (2020) used AGE modelling to separate Make in India’s protectionist and investment-led components and found they pulled in opposite directions: the protectionist component alone was predicted to reduce import growth by 3.63%, while the investment component alone was predicted to raise GDP by 1.00%. This is worth noting against the present study’s actual observed data: Narayan et al.’s model predicts tariffs should meaningfully dent import growth, yet the present study finds no such relationship in the real 2010–2023 data. The gap likely reflects the difference between a modelled, isolated prediction and a noisy real-world aggregate where India’s underlying 6–7% annual growth swamps any tariff effect. Ram and Surendar Singh (2021) documented the scale of the escalation directly: average tariffs rose from 13.3% to 17.6% between 2014 and 2019, with agricultural tariffs reaching 43.02%.
Their figures run higher than this study’s own WITS-based averages (peaking at 12.19% in 2019), likely due to differences in tariff-line coverage rather than a real disagreement — but both
studies agree on the same shape: escalation concentrated in 2014–2019, not a smooth post- 2014 climb. Pathania and Bhattacharjea (2020) and Mukherjee (2024) reach a compatible conclusion from the input-cost side: poorly designed tariffs raise costs for the very industries they’re meant to protect. Cherif and Hasanov (2024) provide the cross-country counterpoint —export-oriented economies outperform import-substituting ones on industrialisation and technology, which is closer to the model India’s tariff strategy has followed.Across this cluster — OLS regression, AGE modelling and qualitative policy analysis alike —tariffs consistently emerge as a weak or counterproductive instrument next to investment- or export-oriented alternatives. The present study’s r = -0.02 result adds a direct, India-specific import-volume test to this evidence base.
3.4 Tariff Policy, Import Dependency and Global Value Chain Integration
Paul and Kumar (2020) found many of India’s export-oriented sectors depend heavily on imported inputs and noted imports grew from roughly USD 50B to USD 384B between 2000–01 and 2017–18 — a near eight-fold rise over less than two decades. This complements the present study’s own finding of continued import growth from 2010–2023, suggesting a long-running structural trend that tariff adjustments have not meaningfully interrupted. Mukherjee and Chanda (2021) showed that access to lower-tariff imported inputs improves firm-level productivity — consistent with this study’s own finding that India’s lowest tariffs sit on the categories most tied to production inputs (Petroleum at 2.59%, Capital Goods at 6.72%, Industrial products at 7.91%).
Sector-specific research makes the same case with harder numbers. Mohindroo et al. (2024) and the ICEA study (Joseph, 2024) found high tariffs on smartphone components raised costs and weakened India’s standing against China and Vietnam — a finding the government itself acted on, cutting PCBA duties from 20% to 15% in the 2024 Union Budget. This mirrors, at the product level, the same low-tariff-on-high-import-categories pattern this study finds nationally.
Research on pharmaceuticals and solar energy (Policy Circle, 2024; IEEFA & JMK Research,2025) shows the same entrenched import dependence despite incentive schemes, reinforcing that tariffs alone have not been sufficient in these sectors either.
3.5 Research Gap
The existing literature is fragmented along methodological lines: macro-level studies (Ghuge, 2020; Patel, 2025; Cheng et al., 2021; Narayan et al., 2020) assess GDP, FDI and investment effects; sector-level studies (Mohindroo et al., 2024; Mukherjee & Chanda, 2021; Paul & Kumar, 2020) assess input costs within specific industries; and policy-analytic studies (Ram & Surendar Singh, 2021; Pathania & Bhattacharjea, 2020) assess protectionism’s trade-offs in the abstract. These strands rarely intersect — a national AGE model (Narayan et al., 2020) and a product-level tariff cut (Mohindroo et al., 2024) describe the same underlying phenomenon from disconnected levels of analysis. Few studies test, at the product level and across the full post-2014 period, whether tariffs reduced India’s aggregate import dependence or its dependence on China specifically. The present study addresses this gap by combining the aggregate tariff-import correlation, product-level tariff distribution and India’s China-specific import trajectory into a single, evidence-based assessment.
4. RESEARCH METHODOLOGY:
The data being considered for this study is secondary data. It has been taken from official websites like World Integrated Trade Solutions (WITS) and the World Bank. The data that was taken from these websites initially contained 352,470 rows of India’s tariff schedules and import values by partner country and product, 2010-2023. This data was then cleaned and prepared for the analysis. The total number of rows was reduced to 173,046, which reflects real-world trade conditions but not posted ceilings. Later, the data was cleaned to prepare product fields, which helped in producing a lean, analysis-ready table. The cleaned dataset was loaded into MySQL, which produced a documented SQL script, year-wise and category-wise. The analysis was done in Python using packages like pandas, matplotlib, seaborn and SciPy. It gave an output for visualizations and the correlation test, which was then assembled in Power BI for creating an interactive dashboard.
The primary objective of this study is to understand if the Make in India scheme reduces import dependence and China exposure. To achieve this objective, the paper uses variables such as tariff rates, import values, product categories and partner countries. China and the USA were selected for comparison to understand the changes in India’s trade dependence over time. A total of 4 research questions has been chosen: Did tariffs rise after the Make in India(2014)? Did higher tariffs reduce total import values? Did India reduce its dependence on China? Which categories carry the higher tariffs and do they also carry the most imports?
The data has been arranged to facilitate analysis of trends and import patterns over time. Graphical representations, such as bar charts and line charts, were used to present the tariff rates, total imports and import values from China and the USA.
Descriptive analysis was used to interpret the changes in tariff rates and import volumes after the introduction of the Make in India scheme in 2014. In addition, a Pearson correlation test was conducted to analyse the relationship between tariff rates and import values. The findings obtained from these statistical representations were interpreted to analyse the overall effectiveness of tariff policy on the reduced import dependency and exposure to China imports. Thus, the study adopts quantitative and descriptive research, completely based on secondary data.
5. DATA ANALYSIS AND INTERPRETATION
The analysis focuses on the key trends in India’s import tariffs, import volumes, dependence on China and tariff patterns across product categories. Each finding is interpreted in relation to the objectives of the study to evaluate the effectiveness of the Make in India policy.
5.1 Changes in Tariff Rates after Make in India
The first research question was about whether import tariffs were raised after launching the Make in India campaign in 2014. Data analysis revealed that import duties were really raised in the period under review; the increase was neither slow nor uninterrupted.
As per data, India’s overall average tariff rose from 9.87% in 2010 to 11.14% in 2023. In fact, the lowest yearly average tariff rate that was recorded post-Make in India implementation came in 2016 at 10.13%. Instead of going up right after the launch of the campaign, tariffs dropped a little bit during the 2014-2017 period and then soared abruptly during 2018-2019. The entire series’ highest average tariff rate was recorded in 2019 at 12.2%.
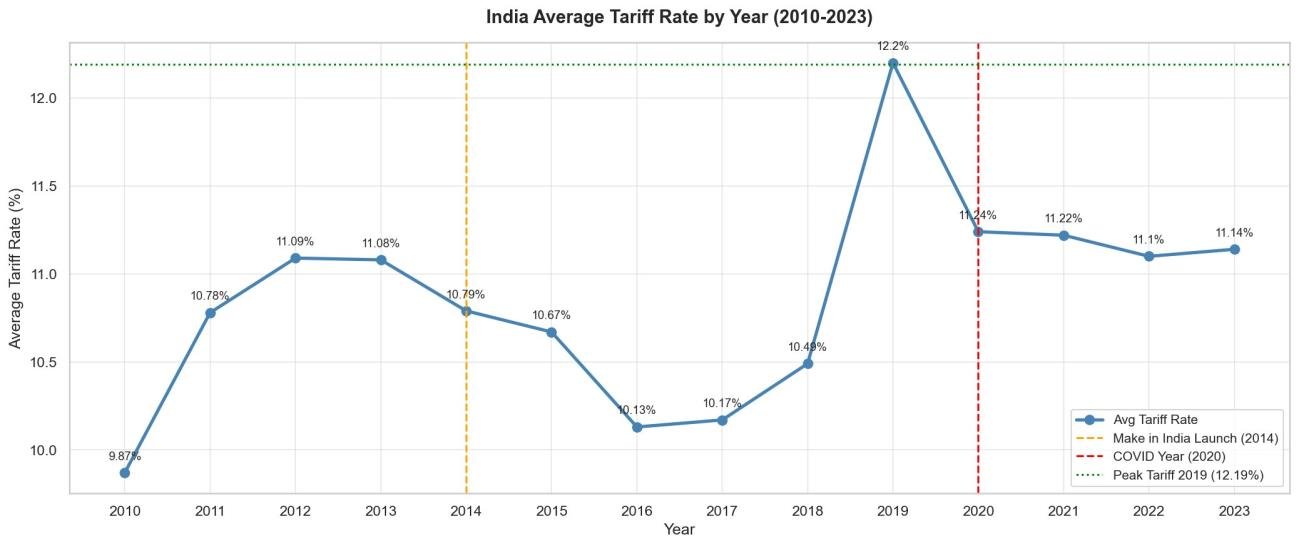
Figure 1
After the 2019 peak, tariffs were eased a bit and remained stable at around 11.1 to 11.2% till 2023. Further illustrating the non-linear nature of tariff changes, a comparison of pre-policy and post policy periods showed that the average tariff during the pre-Make in India period (20102013) was 11.38%, whereas the average rate during the post-policy period (20142023) was 10.67%.
Figure 1 shows the trend in India’s average import tariff rates during 2010-23. Mostly, these results point out that tariff hikes made after the introduction of Make in India are explained by a sudden and large increase in 2018-2019 instead of a continuous upward trend over the post-2014 period.
5.2 Impact of Tariffs on Import Volumes
The second research question aimed to find out if higher tariff rates were related to the drop in India’s total import volumes. Still, the descriptive analysis did not reveal any shrinking of imports with higher tariff levels.
Total imports rose during the time of the study, going from USD 1,023 billion in 2010 to USD 1,899 billion in 2023. Despite tariff rates being higher than the 2010 baseline, imports in 2022 reached their highest level ever recorded at USD 2,094 billion. This is equivalent to an almost 86% overall increase between 2010 and 2023.
Immediately before the major tariff hike of 2018-2019, there was a single period of import decline, 2015-2016, when imports were around USD 1,032 billion and USD 1,134 billion. Imports also fell in 2020 to USD 1,081 billion. This decline was related to the pandemic and not to the tariff policy changes.
A look at the average annual imports before and after the introduction of Make in India further emphasized that, in reality, there was no return to the import-reducing effect. Average annual imports jumped from USD 1,276 billion during 2010-2013 to USD 1,478 billion during 20142023, showing a rise of roughly 15.8%.
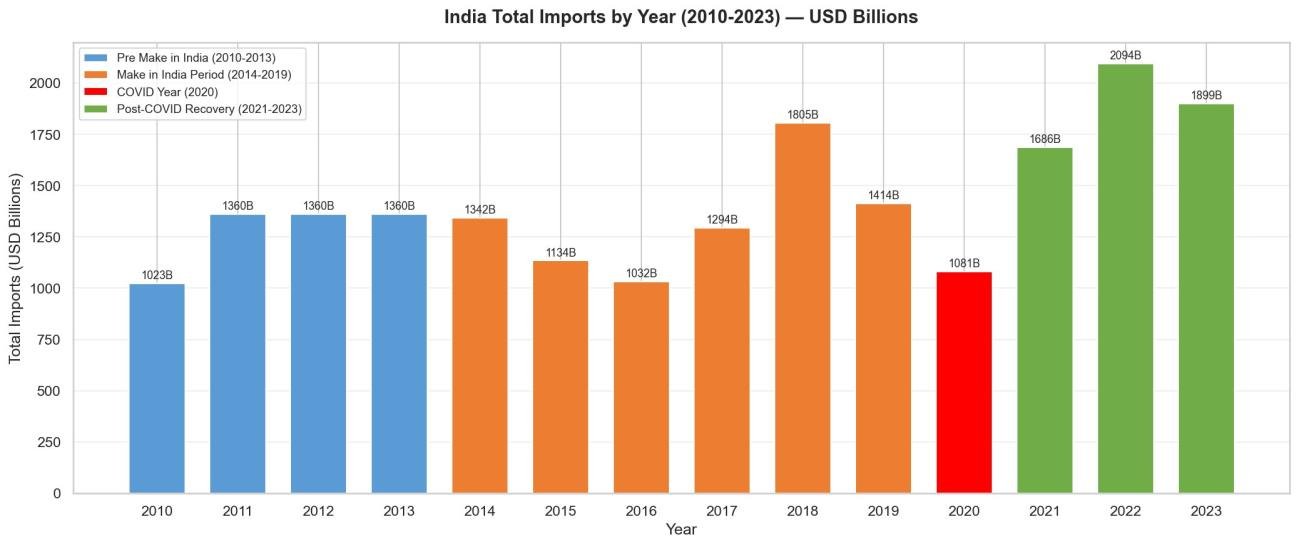
Figure 2
As Figure 2 reveals, import volumes mostly moved upwards over the entire study period, even though there were some changes in tariff rates. So these results suggest that raising tariff levels did not go with lowering total import volumes and that imports kept increasing in the years after Make in India came in.
5.3 India’s Dependence on China
The third research question was whether India had reduced its dependence on imports from China. The answer was no; the importance of China as a source of imports for India actually increased during the period observed.
In 2010, China was the origin of 11.14% of India’s total imports, which gradually increased and touched a high of 17.23% in 2016.Follwing the 2020 Galwan border clash, China’s share temporarily declined, reaching 12.7% in 2020. However, this decline was short-lived, as share increased again to 16.11% in 2023. The second-highest peak during the whole period of the study and still about five percentage points above 2010.
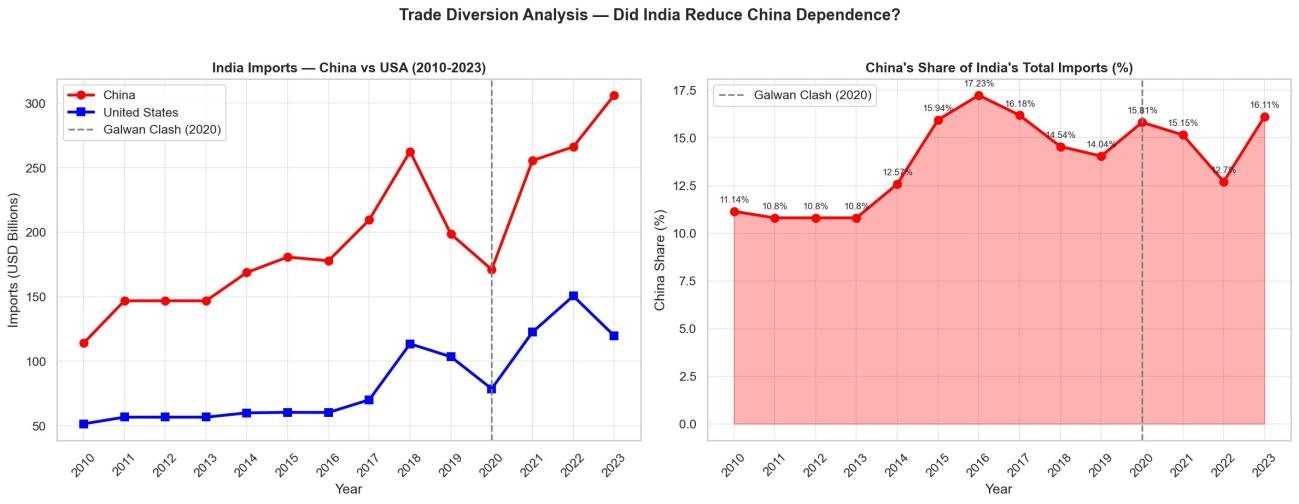
Figure 3
The rise was the same here, marked in the total import values. The import of India from China scaled up from USD 114 billion in 2010 to USD 305 billion in 2023, a near tripling and reaching a record level in 2023. US imports also moved up from USD 51 billion in 2010 to approximately USD 120150 billion by 2023, but what happened was that the rise of China imports went hand in hand with these US imports, rather than replacing them one by one.
During the whole time, the value of Indian imports from China was consistently more than twice that of US imports, which helped China to keep its lead as the main source of Indian imports. Figure 3 demonstrates the parallel increase in imports from China and the changes in the share of China in overall imports.
It resulted in India not reducing its dependence on China during 2010-2023. On the contrary, China’s share in Indian imports recorded a net increase, notwithstanding the occasional decrease in some years.
5.4 Tariffs and Import Patterns Across Product Categories
The fourth research question investigated whether the product categories with the highest tariffs were the same as those contributing exponentially to the largest import volumes. The results from the category-level analysis showed a very distinct opposite trend of tariff levels and import values.
Among the seven major product categories, the WTO HS Agricultural products was one with the highest average tariff rate at 32.69%, but had the lowest total import value at USD 339 billion. Consumer Goods was the second-highest tariff category with an average tariff of 12.54% but a total import of USD 726 billion.
But, product categories with the largest import values generally experienced lower tariff rates. WTO HS Industrial products were the ones with the highest total import value of USD 4,624 billion, with an average tariff rate of only 7.91%. Raw Materials and Intermediate Goods accounted for USD 2,473 billion and USD 2,087 billion imports respectively, with average tariffs of 9.93% and 8.12%. The Capital Goods tariffs were also of a relatively low level, despite being crossed with a fairly high volume of USD 1,291 billion imports, with an average tariff rate of 6.72%. Petroleum products (WTO HS) recorded the lowest average tariff rate among all categories at 2.59%, yet total imports reached USD 1,690 billion.
Individual products showed similar tendencies. Some electronics-related products, like processors, controllers and portable computers, were tariff-free, while the tariff rate levied on crude oil was 38.15%. Yet the product still accounted for USD 102 billion in imports. These findings suggest that the essential commodities and key industrial inputs continue to be imported despite tariff protection because domestic production is insufficient to meet demand and the goods have limited short term substitutes.
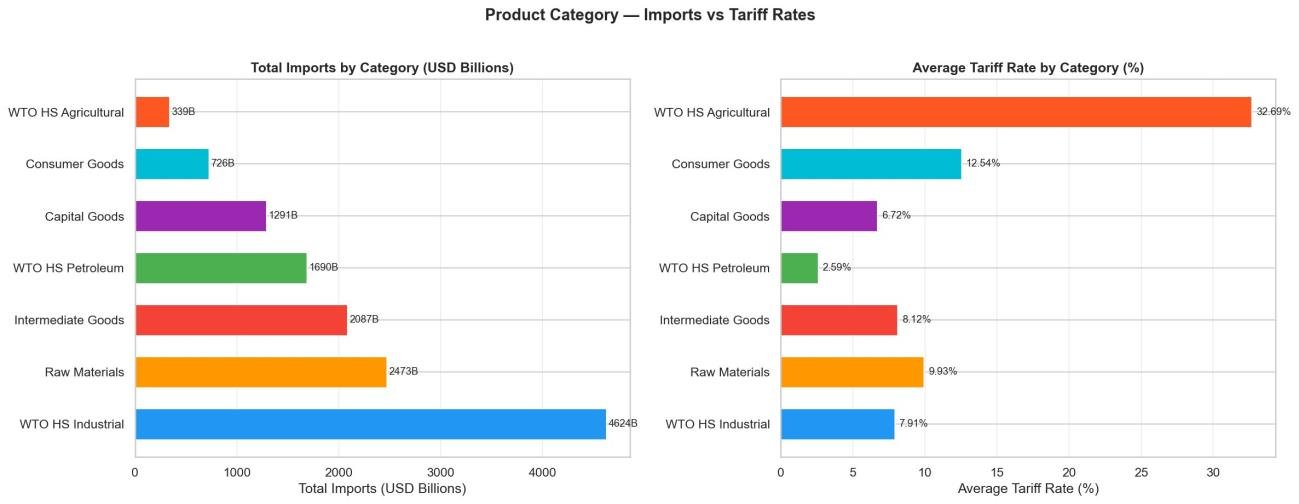
Figure 4
Figure 4 is a comparative chart illustrating average tariff rates and total imports across the seven categories. Here, the results clearly show that product categories receiving the highest tariff protection have generally made-up smaller shares of the imports, whereas the product categories having the largest import volumes typically have been facing pretty low tariff rates.
5.5 Statistical Analysis
5.5.1 Pearson Correlation
The final research question examined whether there was a statistical relationship between India’s average import tariff rates and total import volumes during the study period. To assess this, a Pearson correlation analysis was carried out using 14 annual observations from 2010 to 2023.
The Pearson correlation coefficient was -0.0225, with a p-value of 0.939. The coefficient is very close to zero, indicating that there was almost no linear relationship between tariff rates and total import volumes. Since the p-value is much higher than the 5 per cent significance
Figure 5 presents the scatter plot showing the relationship between average tariff rates and total imports. The scattered pattern of the observations and the almost flat trend line further confirm that changes in tariff rates were not associated with changes in India’s overall import volumes during the study period. level, the relationship is not statistically significant.
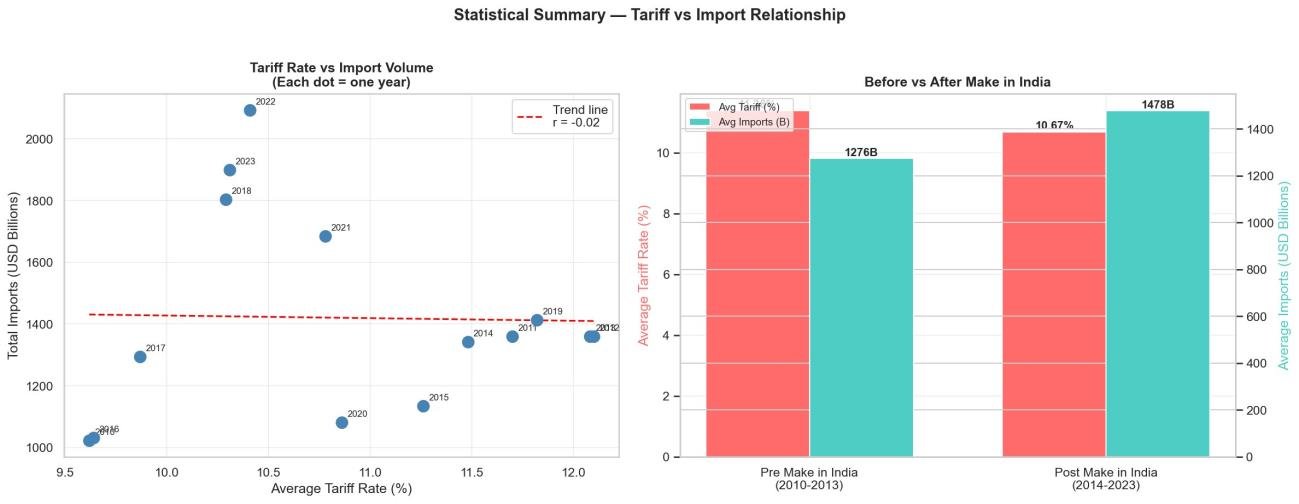
Figure 5
These findings suggest that changes in tariff rates alone did not explain the movement in India’s total imports. However, it should be noted that correlation indicates only the degree of association and does not establish a cause-and-effect relationship between the two variables.
5.5.2 Pre- and Post-Make in India Comparison
A comparison of the periods before and after the introduction of the Make in India policy provides further support for the above findings. During the pre-Make in India period (2010–2013), the average tariff rate was 11.38 per cent, while average annual imports were USD 1,276 billion. In the post-Make in India period (2014–2023), the average tariff rate was 10.67 per cent, whereas average annual imports increased to USD 1,478 billion.
|
Metric |
Pre-Make in India (2010–13) |
Post Make in India (2014 – 23) |
|
Average tariff rate |
11.38% |
10.67% |
|
Average annual imports (USD billions) |
1276 |
1478 |
Table 1
Table 1 shows that average imports were higher during the post-policy period despite a slightly lower average tariff rate. This pattern does not support the view that higher tariffs reduced India’s overall import volumes. Instead, it suggests that total imports were influenced by several other factors, such as domestic demand, global commodity prices, exchange rate movements and the economic disruptions caused by the COVID-19 pandemic.
Overall, both the Pearson correlation analysis and the period comparison lead to the same conclusion: there is no statistical evidence that changes in India’s average tariff rates significantly affected the country’s total import volumes during 2010–2023.
6. DISCUSSIONS AND CONCLUSION:
6.1. Discussion
Tariff Trajectory: Reactive, Not Strategic
When we look at how India’s tariff rates moved over the study period, the picture that emerges is not quite the steady, purposeful climb that Make in India’s protectionist narrative would suggest. Yes, the average tariff rate did reach its highest point 12.19% in 2019, largely on the back of hikes on electronics, auto parts and farm goods. But it had already started retreating by 2020 and settled back around 11.1% by 2023. What makes this even more striking is that the average tariff before Make in India launched (11.38% between 2010 and 2013) was actually higher than the average during the policy years (10.67% between 2014 and 2023). That happens because tariffs quietly dipped between 2014 and 2016 before the sharp 2018–19 surge. So rather than a deliberate, escalating strategy, what we really see is a government responding sector by sector to industry lobbying here, a current account worry there, without an overarching blueprint guiding the decisions. This is echoed by Ram Singh and Surendar Singh’s (2023) finding of a huge across-the-board hike in tariffs from 2014–2019 before a unified policy came to be, with GST exacerbating the situation for tariff effects. That reactive nature is, in large part, why we didn’t see much of a dent in overall import patterns. But even if India had followed a more deliberate and sustained tariff escalation, a more fundamental question remained: would higher tariffs have made any difference to what India imports, or was the instrument itself incapable of suppressing demand, no matter how it was deployed?
Why Tariffs Did Not Reduce Import Volumes
Perhaps the most telling number in this entire analysis is the correlation coefficient between tariff rates and import volumes: r = −0.02, with a p-value of 0.939. In plain terms, knowing what India’s average tariff was in any given year tells us virtually nothing about how much the country imported that year. The relationship is, for all practical purposes, non-existent.
There are two straightforward reasons for this. The first is structural inelasticity: The first is that most of what India imports, industrial goods worth $4,624B, petroleum worth $1,690B, raw materials worth $2,473B, simply cannot be swapped out for domestic alternatives in the short or medium term. When a factory needs a specific machine part or a refinery needs crude oil, a higher import duty doesn’t make those needs disappear; it just makes them more expensive. Tariffs on these goods work as revenue tools, not as brakes on demand.
The second reason is almost ironic: the goods that carry the highest tariffs are the ones India imports the least of. Agriculture faces a 32.69% average duty but accounts for only $339B in imports. Consumer goods face 12.54% but bring in $726B. Meanwhile, the categories of industrial goods, petroleum and raw materials are taxed at 7.91%, 2.59% and 9.93%, respectively. The government kept those rates low deliberately because taxing essential inputs would push up costs for every manufacturer in the country. The unintended consequence of that logic is a tariff structure where the heaviest taxes land on the lightest import categories, leaving the bulk of the import bill virtually untouched. And on top of all this, India’s economy was growing at 6–7% a year through much of this period, generating rising household incomes, expanding factories and growing energy needs, forces that were always going to drive imports upward far more powerfully than any tariff adjustment could pull them down.
These results are consistent with those from prior research (Mukherjee & Chanda, 2021; Narayan et al., 2020; Pathania & Bhattacharjea, 2020). For example, Narayan et al. (2020) found that promoting investment and supporting increasing productivity can achieve more than increasing tariff rates would be able to achieve for each business’s individual needs. Pathania and Bhattacharjea (2020) explained in detail how tariff structures reduce the amount businesses spend on inputs that do not come from their country of origin. Other authors (Mukherjee & Chanda, 2021) supported this argument. They showed evidence that access to imported intermediate goods leads to higher levels of productivity. The current study adds to all of these
previous studies’ conclusions by demonstrating that the tariff level has very little influence on the overall level of dependence on importing goods. Even if the aggregate data showed that tariffs had no measurable effect on overall import volumes, one could still argue that the policy did achieve its more specific strategic goal of reducing India’s structural reliance on China in particular. But the data tells a different story there, too.
Deepening Dependency on China: How and Why
One of Make in India’s most explicit ambitions was reducing how much India depends on Chinese goods, particularly after border tensions made that dependence a strategic concern. The data tell a different story. China’s share of India’s imports went from 11.14% in 2010 to 16.11% in 2023 and in absolute terms, imports from China nearly tripled from $114B to $305B. This is not a minor drift; it is a structural deepening of the relationship.
The 2020 Galwan Valley clash did shake things up briefly. A combination of government restrictions, public boycotts and genuine efforts to find alternative suppliers pushed China’s share down to around 12.7% by 2022. But by 2023, it had bounced back to 16.11%, the second-highest figure in the entire dataset. This reflects that self-reliance goals were undermined by structural realities: India could not find alternative suppliers at comparable scale.
Mekala (2025) found that incentive and protectionism together can attract FDI in electronics and food processing, but the actions needed to generate investment and reduce import dependence may sometimes diverge. This variation helps to shed light on the fact that manufacturing employment improved in some sectors but manufacturing employment improved in some sectors but manufacturing’s share of GDP remained flat, jobs were created but the overall economic importance of manufacturing did not grow because input costs and international competitiveness remained weak.
That quick recovery says something important: the desire to diversify ran into the hard reality that no other supplier, whether domestic or from a third country, could match China’s combination of price, scale and product range across electronics components, machinery, chemicals and pharmaceutical ingredients. US exports to India grew over this period too, but they grew alongside China’s, not instead of them, because the two countries sell India fundamentally different things. The trade diversion that policymakers hoped for simply did not happen at the scale required.
Mekala (2025) found that incentives combined with protectionism produce FDI within electronics and food processing, but the actions required for generating investment and reducing reliance on imports may sometimes differ, leading to a divergence between these two goals within this area of study. This poses the more difficult question as to whether the policy did not lower China’s import dependence on China in particular. This answer is found not in the poor implementation, but in the actual design of the tariff system itself.
Selective Protectionism and India’s Tariff Traps
India’s system of tariffs over this period can be better classified as selective protection and not
form of import substitution. The discrepancies in tariffs rates and the level of imports exposed the logic behind India’s protectionist policy and why it was inevitable to incur the costs. Such discrepancy represents an inefficient policy within India, but also directly shapes India’s global value positioning (GVC) positioning. For example, agricultural products have an average duty of 32.69% yet they represent merely $339B of imports, whereas industrial products with $4,624B, have to pay only 7.91% (Sen, 2020).
With the use of high tariffs for inputs and consumer goods as opposed to industrial categories, which were subject to lower tariffs, where India continued to rely on them. High tariffs were imposed by India on inputs and consumer goods raising costs in industries where there are limited domestic alternatives within India. They were introduced to protect domestic industries, but in reality, domestic firms incurred high costs, failed to scale production and diverted resources away from innovation to meet these costs. As a result, producers fell behind their rivals and lost ground internationally in the export market, because competitiveness depends on price and efficiency. Mukherjee, 2022).
This resulted in more problems like India being left out of RCEP resulting in lack of market access and investors moving towards more predictable and low-cost liable nations. In comparison, India signaled uncertainty and reduced profitability, multinational firms moved their manufacturing operations to RCEP members such as Vietnam, where they could enjoy tariff-free markets which offered smoother entry. Thus, the reduction in foreign direct investment was quite a foreseeable result of India’s tariff policy (Prabhakar, 2026).
Protectionism also contradicted the WTO’s policies concerning subsidies, anti-dumping and non-discrimination. India’s agricultural subsidies, for instance, India defended its Minimum Support price (MSP) subsidies as food security measures, but the WTO ruled they exceeded allowed levels and distorted trade, which have been challenged by other countries due to repeated violation of its international commitments, which has led to distortion in international trade and discrimination against foreign suppliers. All these mechanisms were intended to protect local industries, yet they repeatedly conflicted with their global obligations. India was found in violation in several cases, including disputes over agricultural products. Such misalignment pointed to a larger problem: deploying protectionist instruments without regard for international long-term commitment
In conclusion, India’s tariffs system was structurally incapable of reducing dependence, because of high cost, exclusion from the global supply chain, delayed investment and recurring trade-offs.
6.2. CONCLUSION
Summary
This study asked a direct question: Did Make in India’s use of import tariffs actually reduce India’s dependence on foreign goods and specifically on China, between 2010 and 2023? A study using a dataset of 173,046 records relating to tariff and trade at the product level finds that while there was an increase in import tariffs in accordance with the Make in India initiative, these changes did not completely impact India’s overall reliance on the importation of goods from abroad for the period 2010 to 2023. Tariffs moved in a sharp, concentrated spikes rather than a steady climb. Total imports grew from $1,023B to $1,899B, nearly doubling despite elevated duties. China’s share of imports rose from 11.1% to 16.1% and the brief post-Galwan dip reversed itself within just a few years. The statistical relationship between tariff levels and import volumes was, across the full 14-year series, essentially zero. Where tariff policy did make a difference, it did so within specific sectors; it was never going to move the needle on overall import dependence, because the structure of the tariff schedule and the structure of India’s import needs were working against each other from the start.
While it is clear tariffs haven’t worked, some articles in the literature mention how tariff protection, along with PLIs and strategic targeting of industrial policies, helped create fresh investment avenues in areas such as electronics, pharma and cars.
Thus, the results suggest that tariffs may be most effective as a policy support instrument rather than as an independent option for decreasing import dependence.
Policy Recommendations
What this means for policymakers is that tariffs alone are not a sufficient tool for the goal Make in India set out to achieve. A more effective approach would need to go further:
- Protection should come with an expiry date. Tying tariff cover to productivity targets and sunset clauses would push domestic industries to build real competitiveness rather than simply relying on the shelter indefinitely.
- The revenue that tariffs generate should flow back into building the supply-side capacity that makes import substitution actually possible, particularly in electronics, chemicals and active pharmaceutical ingredient manufacturing, where China’s dominance is most pronounced.
- Trade agreements with ASEAN, South Korea, Japan and the EU need to move faster. Credible alternative supply chains take years to develop; building them after a geopolitical shock hits is far costlier than building them in advance.
- For inputs where India genuinely cannot substitute semiconductors, rare earths, critical APIs, strategic stockpiling and domestic production mandates are worth serious consideration, given how exposed the country remains to supply disruptions.
LIMITATIONS:
Because this research analysis is based on aggregated data for tariffs and trade, it is not possible to understand sectoral impact created by tariff policy. Furthermore, other influences such as fluctuations in exchange rates, price movements of commodities in the global economy, geopolitical events and international supply chains disrupted by COVID-19 may also have contributed to import activity during the timeframe analysed. Thus, the trends seen during the analysis cannot be attributed to tariff modifications alone.
FUTURE RESEARCH:
This analysis works at the level of annual aggregates and broad product categories, which is appropriate for answering the headline question but inevitably smooths over a lot of variation. Three follow-up directions stand out as particularly worthwhile. First, drilling down to the HS-6 product level with a proper panel regression that controls for GDP, exchange rates and commodity price swings would reveal whether tariff changes had meaningful effects in specific product lines that simply get lost when everything is averaged together. Second, pairing the import data with domestic manufacturing output figures from the Annual Survey of Industries would give a fuller picture: it is possible that tariffs suppressed imports in some categories while simultaneously stimulating domestic production and that effect is invisible in import data alone. Third, the WITS dataset carries a known quirk in the 2011–13 figures and a COVID distortion in 2020; cross-checking the key findings against UN Comtrade and RBI balance-of-payments data and running the analysis with those years excluded, would add important robustness to the conclusions drawn here.
REFERENCES:
[1] Rawat, M., Raj, R., & Agarwal, T. (2020). A Critical Review of Make in India as an Import Substitute. SSRN Electronic Journal. https://doi.org/10.2139/ssrn.3569655
[2]Pulicherla, K. K., Adapa, V., Ghosh, M., & Ingle, P. (2021). Current Efforts on Sustainable Green Growth in the Manufacturing Sector to Complement “make in India” for Making “self-reliant India.” Environmental Research, 206, 112263. https://doi.org/10.1016/j.envres.2021.112263
[3]Cherif, R. (2024). The Pitfalls of Protectionism: Import Substitution vs. Export-Oriented Industrial Policy. IMF Working Paper, 2024(086), 1–1. https://doi.org/10.5089/9798400270802.001
[4]Tripathy, A., & Dastrala, S. M. (2023, March 10). Make in India: So Far and Going Ahead. Social Science Research Network. https://doi.org/10.2139/ssrn.4384039
[5] Goswami M, Daultani Y (2022), “Make-in-India and Industry 4.0: technology readiness of select firms, barriers and socio-technical implications”. The TQM Journal, Vol. 34 No. 6 pp. 1485–1505, doi: https://doi.org/10.1108/TQM-06-2021-0179
[6] Mehrotra, S. (2020). “Make in India”: The Components of a Manufacturing Strategy for India. The Indian Journal of Labour Economics, 63(1), 161–176. https://doi.org/10.1007/s41027-019-00201-9
[7] Bose, A. (2026, March 17). Assessing India’s Trade Performance: Pathways to Strategic and Deeper Integration With Global Value Chains – CSEP. CSEP – Centre for Social and Economic Progress. https://csep.org/working-paper/assessing-indias-trade-performance-pathways-to-strategic-and-deeper-integration-with-global-value-chains/
[8] Rijesh, R. (2020). Liberalization, Import of Capital Goods and Industrial Exports: Evidence from Indian Manufacturing Sectors. Global Journal of Emerging Market Economies, 13(1), 239395752097478. https://doi.org/10.1177/2393957520974787
[9] Decoding India’s Tariff Strategy: Protectionism or Pragmatic Policy? (2025, July). India Foundation. https://indiafoundation.in/articles-and-commentaries/decoding-indias-tariff-strategy-protectionism-or-pragmatic-policy/?utm_source=chatgpt.com
[10] Do Import Tariffs Increase Domestic Production or Value in World Consumption? (2024, August 23). Economic and Political Weekly. https://www.epw.in/journal/2024/34/indias-industrial-transformation/do-import-tariffs-increase-domestic-production-or.html
[11] Deshpande, Revati, Global Value Chains Under Strain: India’s tariff Policy in the Era of Trade Wars and Supply Chain Disruptions (March 24, 2026). Available at SSRN: https://ssrn.com/abstract=6758698 or http://dx.doi.org/10.2139/ssrn.6758698
[12] Contractor, Farok J., Thousands of Hindu Gods – Made in China. Seven Reasons Why India’s Manufacturing Competitiveness Lags China’s (May 1, 2018). Rutgers Business Review, Vol. 3, No. 1, 2018, Available at SSRN: https://ssrn.com/abstract=3176026
[13] Paul, M., & Kumar, R. A. (2020). Import intensity of India’s manufactured exports: an industry level analysis. Indian Economic Review. https://doi.org/10.1007/s41775-020-00104-3
[14] The Policy and Operational Challenges in Formulating India’s New Foreign TradePolicy.(n.d.).Orfonline.org. https://www.orfonline.org/research/the-policy-and-operational-challenges-in-formulating-indias-new-ftp
[15] Manocha, A. (2025, March 21). The Hidden Layers of Protection in India’s Import Policy – CSEP. CSEP – Centre for Social and Economic Progress. https://csep.org/blog/the-hidden-layers-of-protection-in-indias-import-policy/
[16] (2021). Cato.org. https://www.cato.org/policy-analysis/indias-new-protectionism-threatens-gains-economic-reform
[17] Mahajan, A., Chand, P., & Pasumarthi, H. V. (2021). An Analysis of Impact of Anti-dumping Duties on India–China Trade. South Asia Economic Journal, 22(2), 233–249. https://doi.org/10.1177/13915614211035052
[18] Making sure you’re not a bot! (2026). Econstor.eu. https://www.econstor.eu/bitstream/10419/228605/1/1744199442.pdf
[19] A COMPARATIVE STUDY OF IMPORT TARIFFS IMPACTING INDIA’S COMPETITIVENESS IN MOBILE MANUFACTURING & EXPORTS RECOMMENDATIONS FOR UNION BUDGET 2024-25. (n.d.). Retrieved June 26, 2026, from https://icea.org.in/wp-content/uploads/2024/10/1.-High-tariffs-on-smartphone-inputs-discourage-GVCs-adversely-impact-competitiveness-and-limit-exports.pdf
[20] Raimondi, V., Piriu, A., Swinnen, J., & Olper, A. (2023). Impact of global value chains on tariffs and non-tariff measures in agriculture and food. Food Policy, 118, 102469. https://doi.org/10.1016/j.foodpol.2023.102469
[21] Keller, W. W., & Pauly, L. W. (2009). Innovation in the Indian Semiconductor Industry: The Challenge of Sectoral Deepening. Business and Politics, 11(2), 1–21. https://doi.org/10.2202/1469-3569.1270
[22] Joseph, R. K. (2022). Reducing Import Dependence on APIs in the Indian Pharmaceuticals Sector: An Analysis of Early Experience of the PLI Phase-I Scheme. SSRN Electronic Journal. https://doi.org/10.2139/ssrn.4008180
[23] Patel, A. (2025). The Impact Of Make In India Initiative On India’s Global Economic Standing. International Journal of Creative Research Thoughts, 13, 2320–2882. https://ijcrt.org/papers/IJCRT25A3333.pdf
[24] Manas Mekala. (2025, August 18). Impact of Trade Protectionism on Inward FDI: A study on India’s Electronics -and Food Processing Industry. https://doi.org/10.13140/RG.2.2.31280.42240
[25] KAPIL DHYANI. (2022, April 27). Make in India V. Made in China. Academia.edu. https://www.academia.edu/77802554/Make_in_India_V_Made_in_China
[26] G., Badri Narayan, Rahul Sen, Chidambaran Iyer, Sangeeta Khorana and Sadhana Srivastava (2020). “A quantitative assessment of economic impact of trade wars and tha ‘Make in India’ program”, ARTNeT Working Paper Series No. 203, December 2020, Bangkok: ESCAP.
[27] Ghuge, N. R. (2020). A Study of Impact of Make in India Campaign on the Indian Economy. International Journal of Economics and Management Studies, 7(2), 92–96. https://doi.org/10.14445/23939125/ijems-v7i2p114
[28] Cheng, X., Fu, X., Tang, Y., & Wang, Z. (2021). The impacts of trade protectionism on the Indian economy. Advances in Economics, Business and Management Research, 203, 1213–1219.https://doi.org/10.2991/aebmr.k.211209.195
[29] Srivastava, A., Devi, V., Mani, S., & Prasad, S. (2025). Impact of Make in India Initiative on Foreign Direct Investment Inflows in Manufacturing Sector: An Empirical Study of Pre and Post Make in India Policy Intervention. International Journal of Academic Excellence and Research, 01(03), 78–89. https://doi.org/10.62823/mgm/ijaer/01.03.101