Authors: SK Sanjana Chithambaram, KR Valliammai, Soumya Mittal, Shaana Faizal, Samanvi Mandapati, Manya Hegade S
ABSTRACT
This study examines whether India’s import tariff increases under the Make in India policy, launched in September 2014, achieved the stated objective of reducing dependence on foreign goods, particularly from China. Using product-level tariff and trade data from the World Bank’s WITS database for 2010–2023, we have analyzed and applied tariff rates, import volumes, and China’s share of India’s imports. Findings here indicate that tariffs rose sharply in the year 2018–2019, with the China-specific weighted average peaking at approximately 8.16% and the simple average reaching 12.2%, yet this had no discernible effect on aggregate import volumes, which continued to grow. China’s share of India’s imports similarly rose from 11.1% to 16.1%, directly contradicting the policy’s geopolitical rationale. A Pearson correlation test was made betweenChina-specific tariff rates and import volumes from China, yielding r = –0.12 (p ≈ 0.72), confirming no statistically significant relationship. The paper portrays a contrast between two sectors through comparative case analysis. The mobile phone/electronics sector, supported by the Production-Linked Incentive (PLI) and the Phased Manufacturing Programme (PMP), saw measurable success. In contrast, the solar panel industry still relies on Chinese imports for over 80% of cell and module requirements despite the tariffs. These outcomes hence illustrate that tariff policy alone is insufficient without complementary industrial capacity-building through supply chain development, technology transfer, and firm-level capabilities.
Keywords: Make in India, import tariffs, trade policy, import dependence, China, mobile phones, solar panels, Production-Linked Incentive, protectionism, WITS database
1. INTRODUCTION
India’s trade policy has shifted markedly since the year 2014. The Make in India initiative, launched in September 2014, departed from the post-1991 liberalization agenda toward a more interventionist, protectionist approach aimed at boosting domestic manufacturing and reducing import dependency, particularly on China (Athukorala, 2020; Panagariya, 2024). The primaryinstrument used was the import tariff. Between the year of 2014 and 2023, India raised customs duties across multiple sectors, with the steepest hikes occurring in the year 2018–2019 Union Budget; this added 5–15% duties on items ranging from mobile phones and automobile components to textiles and agricultural products (Athukorala, 2020). The simple average tariff peaked at 12.2% during this period, while the aggregate weighted average reached 7.32% in 2015 and the China-specific weighted average peaked at approximately 8.16% in 2020, marking a substantial reversal of the post-1991 liberalization trajectory. This paper hence addresses the question of whether this protectionist strategy achieved its intended objectives.
Existing research has documented the shift toward protectionism but largely stopped short of evaluating its outcomes. Panagariya (2024) notes the rise in average import tariffs since 2014, with peaks reaching 12.5% for automobiles, and warns that this trend could jeopardise long-term manufacturing competitiveness. Athukorala (2020) here similarly argues that post-2014 trade policy deviates from the 1991 liberalisation approach, contending that the tariff increases risk jeopardising India’s competitiveness and its integration into the global value chains. Chaudhury (2022) finds that structural obstacles prevented Make in India from attracting substantial foreign direct investment, suggesting that tariff increases alone are insufficient without a parallel improvement in manufacturing capability. Rawat et al. (2021) compare India and China through sectoral case studies and find that while mobile phone manufacturing benefited from tariff protection and the Phased Manufacturing Programme, India’s broader manufacturing performance remains weak, constrained by gaps in infrastructure, productivity, and industrial capacity. Chaudhary (2025) and Chaudhry, Sharma, and Chaudhery (2025) further highlight the persistent imbalances in India–China bilateral trade, noting that it continued its reliance on Chinese imports across several sectors despite policy interventions. None of these studies, however, empirically tested whether tariff hikes actually reduced India’s aggregate import dependence or China’s share of India’s imports; they only described the policy and its structural context without assessing the outcomes against stated goals.
This paper, drawn from data of fourteen years at a product-level (2010–2023) from the World Bank’s WITS database, addresses the four research questions: Did India’s average import tariffs rise after 2014? Did higher tariffs reduce total import volumes? Did dependence on Chinese imports decline following tariff increases? Is there a statistically significant relationship between the tariff levels and import dependence?
To ground the aggregate analysis in this sectoral reality, the study hence examines two contrasting sectors: mobile phones/electronics and solar panels. The mobile phone sector, supported by the Phased Manufacturing Programme (2017) and the Production-Linked Incentive scheme (2020), is widely known as the Make in India success. Domestic electronics production rose from ₹1.90 lakh crore in FY2015 to ₹9.52 lakh crore in FY2024, with nearly 99% of smartphones sold in India being produced domestically by FY2024. Exports grew from a negligible base in FY2016 to ₹88,726 crore by FY2023, and manufacturing facilities expanded from 3 in 2014 to 268 units by 2018. The solar panel sector illustrates the limits of the tariff-driven policy: despite the 25% basic customs duty on cells and 40% on modules (April 2022), the Approved List of Models and Manufacturers, and an expanded PLI allocation (₹4,500 crore to ₹24,000 crore), India yet remains heavily dependent on Chinese imports which are constrained due to technology dependence, limited manufacturing capacity, high capital costs, and low R&D investment. This underscores that tariffs alone are insufficient, absent complementary factors such as supply chain ecosystems, technology transfer, and firm-level capabilities.
Research objective
This study pursues two central objectives. First, it empirically assesses India’s aggregate and sector-specific tariff trajectory from 2010 to 2023 to determine whether the tariff increases introduced under the Make in India policy translated into measurable reductions in India’s import dependence on China at the product and sectoral levels.
Second, through a comparative case study of the mobile phone/electronics and solar panel sectors, it examines why tariff protection succeeded in reducing Chinese import dependence in one sector but failed in the other, identifying supply chain ecosystem development, technology transfer, and firm-level capabilities as complementary factors that mediate the effectiveness of tariff policy as a tool of import substitution.
2. LITERATURE REVIEW
This section discusses key perspectives and prior research on India’s tariff trajectory, sectoral heterogeneity, the Make in India policy, and the evolving India-China bilateral trade relationship. Rather than treating the literature as a single, unified narrative, the review evaluates where scholarsconverge, where they diverge, and why distinguishing genuine disagreement on outcomes from differences in scope, method, and the questions each study set out to answer.
2.1 India’s Protectionist Turn: Tracing the Tariff Trajectory and the Make in India Policy
Over the past thirty years, India’s trade policy has significantly changed. The nation increasingly abandoned the import-substitution policy that had defined the pre-reform era after the 1991 economic changes. Quantitative constraints were lifted, tariff rates were significantly lowered, and India’s integration with the international trading system grew. But the 2014 introduction of the Make in India campaign signaled a change in the focus of policy. In order to encourage indigenous production and lessen dependency on imports, officials increasingly resorted to tariff rises and import-substitution measures, despite the program’s goal of making India a global manufacturing hub. The literature has frequently referred to this change as India’s “Return to Protectionism.”
On the question of whether this shift has occurred, the literature is essentially unanimous. Athurkorala (2020) and Panagariya (2024) both documents that post-2014 trade policy departs from the liberalization trajectory pursued since 1991, and both frame the change as a rise in tariff protection accompanied by import-substitution measures. Where the literature begins to pull apart is on the causal question that follows from this diagnosis: does the return to tariffs actually deliver its intended economic benefits, or does it simply reduce competitiveness while giving the appearance of self-reliance?
Athukorala (2020) and Panagariya (2024) answer this question skeptically, though from different angles. Athukorala’s concern is systemic: rising tariffs risk cutting India off from international value chains at precisely the moment production has become globally fragmented. Panagariya’s critique is more evaluative, distinguishing reactive protectionism, which he associates with eroded investment and growth, from proactive investment-push policy, which he treats as a separate and potentially more productive category. This distinction matters because it means Panagariya’s objection is not to industrial policy as such, but to tariffs used defensively rather than as part of a deliberate capability-building strategy, a nuance that a simple pro- versus anti-protectionism reading of the literature would miss.
Narayanan et al. (2020) approach the same question from a different methodological register altogether. Using an expanded Global Trade Analysis Project (GTAP) framework, their contribution is a general-equilibrium estimate of the combined effect of the US-China trade war and Make in India, rather than a normative argument about whether protection is desirable. This is a useful counterweight to Athukorala and Panagariya: it offers a quantitative channel through which the qualitative concerns those authors raise could, in principle, be tested, but on its own it does not resolve the debate over long-run competitiveness because a general-equilibrium trade-war simulation is not designed to capture firm-level capability building.
Chaudhury (2022) and Rawat et al. (2021) shift the disagreement onto different grounds: not whether tariffs raise or lower welfare in the abstract, but whether the domestic conditions needed for import substitution to succeed were ever in place. Chaudhury argues that structural bottlenecks, rather than tariff levels per se, prevented Make in India from attracting substantial foreign direct investment, implying that tariff increases were addressing the wrong constraint. Rawat et al. reach a compatible conclusion through a different route: comparing India and China sector by sector, they find that mobile phones saw genuine gains under tariff protection and the Phased Manufacturing Programme, while manufacturing performance overall stayed weak because India lagged China in infrastructure, productivity, and industrial capacity. Reading together, Chaudhury and Rawat et al. suggest that the Athukorala/Panagariya concern about competitiveness is not merely theoretical: it is already visible in the uneven, sector-specific results Rawat et al. document. Taken as a whole, the literature agrees that India has shifted toward protectionism since 2014, but it is split productively rather than simply contradictorily on whether tariffs can substitute for the deeper capability gaps that Chaudhury and Rawat et al. identify. This tension between tariff policy and underlying industrial capacity is picked up directly in Section 2.3.
2.2 The Structural Character of India-China Bilateral Trade
The economic relationship between India and China represents one of the most complex and significant bilateral dynamics in contemporary global economics. As Asia’s two largest emerging economies, their trade relationship, characterised by deep interdependence alongside growing strategic competition, has grown at an unprecedented pace, making China India’s largest trading partner despite persistent geopolitical tensions. However, this rapid expansion hides deep imbalances: India’s trade deficit with China hit a record $80.8 billion in 2023. This imbalance largely reflects a structural asymmetry, with India exporting predominantly raw or low-value goods while importing higher-value manufactured products and key components, as much of the existing literature indicates.
The 2020 Galwan clash and a sequence of subsequent shocks COVID-19 disruptions, the US-China trade war, and shifting global supply chains have intensified concerns about over-dependence and renewed scrutiny of the relationship, as Chaudhry, Sharma, and Chaudhry (2025) note. Theiraccount is useful precisely because it disaggregates the picture rather than treating India-China trade as uniformly dependent: they observe that recent policy initiatives such as Make in India, Production Linked Incentive schemes, and the Atmanirbhar Bharat programme have produced genuine decoupling and import substitution in selective sectors, notably smartphones and electronics, while other sectors, such as EVs and semiconductors, remain deeply reliant on Chinese imports and continue to drive the trade deficit.
This sectoral disaggregation is the most valuable contribution of Chaudhry, Sharma, and Chaudhery (2025), but it also exposes the limits of their analysis. The roadblocks they identify China’s manufacturing dominance, India’s reliance on Chinese capital goods, non-tariff barriers,weak domestic infrastructure, and currency volatility are described at a structural, largely descriptive level. What the study does not do is empirically connect these roadblocks to the specific post-2014 tariff increases enacted under Make in India: it establishes that the imbalance exists and outlines plausible contributing factors, but it stops short of testing whether tariff policy itself narrowed or widened the imbalance in the sectors it discusses. This is precisely the empirical gap the present study is positioned to fill, and it echoes the same underlying issue raised in Section 2.1 that documenting a policy shift and its correlates is not the same as establishing what that policy shift caused.
2.3 Sectoral Heterogeneity in Tariff Efficacy
A significant gap in the literature reviewed so far is its tendency to treat tariff policy as though it produces a uniform effect across the economy, when in fact the evidence even within the same authors’ own work points to sharply different outcomes by sector. Panagariya (2024) himself supplies the conceptual basis for expecting this variation: import substitution can succeed where imports substitute for or dominate domestic consumption, since tariff barriers can then allow domestic production to fill the resulting gap, as occurred in mobile phones and toys. Yet he immediately qualifies this claim by insisting that the relevant test is not whether a protected industry survives, but whether the policy raises overall economic growth, a bar he argues Indian import substitution has generally failed to clear. This creates an internal tension worth foregrounding: Panagariya’s own framework predicts sector-level success stories even in a policy he judges to be a net failure, which means citing a successful sector (mobile phones) is not by itself a rebuttal of his broader skepticism.
This tension is precisely what the mobile phone/solar panel contrast is designed to test empirically rather than assert theoretically. Mobile phones are frequently cited, including by Rawat et al. (2021) in Section 2.1, as a genuine success case. But Panagariya’s own analysis suggests why this needs to be treated cautiously rather than generalized: he notes that production subsidies differ fundamentally from tariffs, since subsidies can benefit import-competing and export-oriented firms alike, whereas tariffs only raise the domestic price of import-competing goods. On this reading, mobile phones did not succeed because of tariffs alone but because tariff protection was combined with production-linked incentives and favourable conditions for assembly and localisation of a compound policy environment, not a tariff effect in isolation.
The solar panel sector provides a direct counter-case that tests the limits of Panagariya’s framework and, more broadly, of the optimistic reading in Section 2.1. India remains heavily dependent on solar modules from China; in 2018, China accounted for roughly 84% of India’s solar module imports. Raising tariffs did not meaningfully erode this dependence, which suggests that Panagariya’s precondition for successful import substitution that domestic production can plausibly fill the gap left by import restrictions was not satisfied in this sector, since India lacked the scale, technology, and supply-chain depth to compete with established solar manufacturers.Set against mobile phones, the solar case indicates that the literature’s disagreement over whether tariffs “work” is often a disagreement about which sectoral preconditions were assumed to hold, rather than a disagreement about tariff theory itself.
2.4 Why the Divergence Matters: Supportive Factors as Influencers of Tariff Effectiveness
Read against one another, the mobile phone and solar panel cases resolve without fully closing the tension left open across Sections 2.1 to 2.3. Athukorala and Panagariya’s skepticism about tariffs, Chaudhury and Rawat et al.’s emphasis on structural bottlenecks, and Chaudhry, Sharma, and Chaudhery’s descriptive account of roadblocks all point toward the same underlying claim, but none of them tests it directly: that tariff policy does not work in isolation, and its effectiveness depends on complementary factors such as supply chain ecosystems, technology transfer, firm capabilities, and consistency between trade and industrial policy.
The comparison also clarifies a distinction the descriptive literature tends to blur: the difference between shifting trade patterns and genuine import substitution. In solar, increased tariffs appear to have altered import patterns only marginally, without displacing Chinese control at the module level. In mobile phones, tariffs combined with PLI incentives successfully attracted assembly work to India, even as imports of intermediate components continued largely unabated. This suggests a more modest and more precise conclusion than either the optimistic or the skeptical readings in Section 2.1 offer on their own: the policy produced partial integration into global supply chains rather than complete import replacement, and where it succeeded, it did so through a compound policy mix rather than tariffs alone.
For policymakers, this implies that raising tariffs without investing in manufacturing systems may create the appearance of protectionism without the substantive economic benefits of import substitution. For researchers, the gap that emerges from this review is not simply that more sectors need to be studied, but that existing studies, whether descriptive (Chaudhry, Sharma, and Chaudhery, 2025), evaluative (Panagariya, 2024), or general-equilibrium (Narayanan et al., 2020) stop short of empirically testing the sectoral conditions under which tariffs reduce dependence on Chinese imports. This study aims to fill that gap through a detailed analysis of the mobile phone and solar panel sectors from 2010 to 2023.
3. RESEARCH METHODOLOGY AND ANALYTICAL FRAMEWORK
3.1 Research Methodology
This study employs a mixed-methods research design to examine the relationship between tariff policies and domestic industrial development under the Make in India program. By integrating quantitative trade and fiscal data with qualitative insights from policy documents and scholarly literature, the research captures both the numerical magnitude of the tariff-induced changes and the institutional mechanisms driving these policy implementations (Creswell & Creswell, 2018). The use of a mixed-methods approach helps to ensure credible, replicable, and rigorous findings through comparative analysis of statistical evidence with documentary analysis. The quantitative components are drawn from the World Bank’s World Integrated Trade Solution (WITS) and the World Trade Organization’s Trade Analysis and Information System (TRAINS), where it provides a comprehensive coverage of the applied tariff rates, import volumes, and trade flows at the Harmonised System (HS) six-digit level (World Bank, 2024). The time series spans from 2010–2023, encompassing the pre-Make in India baseline with the policy launch in September 2014, and subsequent implementation phases. This temporal scope enables a before-and-after comparison isolating the initiative’s marginal effect on tariff structures and import dependence.
The primary dependent variables are (a) the Applied Harmonised System (AHS) WeightedAverage tariff rate, measuring overall protection, and (b) sector-specific import values from China, capturing trade flows in the strategically important sectors. The AHS Weighted Average is formally defined as:
AHS Weighted Average = (ti vi) / (vi)
where tᵢ denotes the applied tariff rate for product i, and vᵢ represents the corresponding import value (World Bank, 2024). Here, this trade-weighted metric ensures that products with larger import shares receive proportionally greater weight, reflecting the actual tariff burden on trade flows rather than merely at a statutory rate. In contrast to the basic averages that give equal importance irrespective of trade volume, the weighted average considers the economic relevance of each product category. Independent variables include dummy indicators for major policy interventions, with the launch of Make in India (2014), the introduction of Production-Linked Incentive (PLI) schemes (2020), and the implementation of basic Customs Duties on solar products (2022). Control variables encompass the global economic conditions, exchange rate fluctuations, and WTO commitment periods. The data on India’s aggregate and China’s specific tariffs were extracted from the WITS-TRAINS database (jointly maintained by the World Bank and UNCTAD)
Import values for telephone sets (HS 8517) and solar photovoltaic devices (HS 8541) were obtained from UN Comtrade via WITS, with India as reporter and China as the partner country (World Bank, 2024). The qualitative component draws on the official policy documents from the Ministry of Commerce and Industry, the Ministry of Electronics and Information Technology, and the Ministry of Finance which includes the budget speeches, notification circulars, and scheme guidelines on PLI, the Phased Manufacturing Programme (PMP), and customs duty revisions (Ministry of Electronics and Information Technology, 2019, 2021), supplemented by a peer-reviewed literature offering theoretical grounding (Athukorala, 2020; Gupta et al., 2021).
In this research, the telephonic and solar and photovoltaic sectors have been chosen specifically because of their contrasting outputs. The telephone sector has successfully become a net exporter after Make in India and tariff-imposed policies, whereas the solar and photovoltaic sector turned out as net importer. These extremities help in understanding both pros and cons of the policy implications. Mobile phones reveal that success was not only tariffs. The slow but steady rise of duties was complemented by other policies like PMP, PLI incentives and the rapid growth of assembly plants that made India a big smartphone maker and exporter. By contrast, solar tariffs were less successful, due to the absence of upstream manufacturing capacity in India, high financing costs and reliance on imported equipment and technology. Post safeguard duties and BCDs, imports rebounded, with the message being that tariffs alone cannot create self-reliance without investment in an ecosystem.
The study adds to the fact that tariff-led industrialisation produces sector-specific outcomes. Tariffs succeed only when paired with industrial capabilities, supportive financing, and technological depth. In electronics, tariffs and supporting policies reduced dependence on imports and spurred exports to grow. Tariffs didn’t work in renewables without accompanying investment in R&D, upstream technology and supply chain resilience. The policy implication is clear: India’s industrial strategy needs to combine tariffs with capacity building measures, including subsidised credit, domestic equipment manufacturing and increased R&D funding, if it is to replicate the success of the mobile sector in other strategic industries.
Methodological Limitations:
1. Focusing on two sectors (mobile phones and solar PV) provides depth but limits generalisability across India’s broader industrial landscape.
2. Weighted averages reflect trade flows but may obscure intra‑sectoral variations, especially in industries with diverse product categories.
3. It relies on secondary data sources such as WITS TRAINS that may not fully capture firm-level dynamics or may be behind policy announcements.
Tariff results under Make in India were greatly influenced by external variables and global supply chains. India became an assembly hub as a result of tariff escalation and multinational investment in mobile phones, which are integrated into disjointed global value chains. On the other hand, solar PV modules were mostly dependent on Chinese-dominated upstream supplies like poly silicon and wafers, rendering tariffs useless in the absence of domestic production. Vulnerabilities were increased by geopolitical tensions like the Doklam and Galwan battles, and India’s policy autonomy was limited by WTO disputes over solar content criteria. Supply chains were further disrupted by the COVID-19 pandemic, revealing reliance on imported parts, particularly in renewable energy, where funding and logistical limitations compromised tariff protection. Exchange rate volatility altered import costs, sometimes offsetting tariff effects, and persistent technology dependence—limited R&D and reliance on imported equipment—meant tariffs could shield assembly but failed to drive innovation or upstream integration. Together, these external pressures reveal that tariffs alone cannot secure self‑reliance without parallel ecosystem investment.
The AHS weighted average is generally preferred for correlation analysis like Karl Pearson’s coefficient because it measures the real relationship between tariffs and imports, it avoids distortions due to tariff lines with negligible trade flows and produces statistically more powerful and more interpretable results. The Karl Pearson Correlation coefficient calculated with variables India’s applied import tariffs on China (AHS weighted average) and the total import volume in USD thousand from China to India considered annually is r = –0.12, and the hypothesis test p ≈ 0.72. This is a very weak negative correlation, essentially close to zero. It suggests that tariff changes did not have a consistent or strong linear effect on the volume of imports from China. The analytical framework organises the empirical investigation around four graphical analyses: aggregate tariff trends, China-specific tariffs, mobile phone imports, and solar photovoltaic imports, as it moves from macro-level patterns to sector-specific outcomes (Krugman & Obstfeld, 2018).
3.2 Analytical Framework
The empirical analysis here examines the four graphical trends to assess whether tariff-led industrial policy reduced India’s import dependence on foreign goods, particularly from China, under the Make in India initiative.
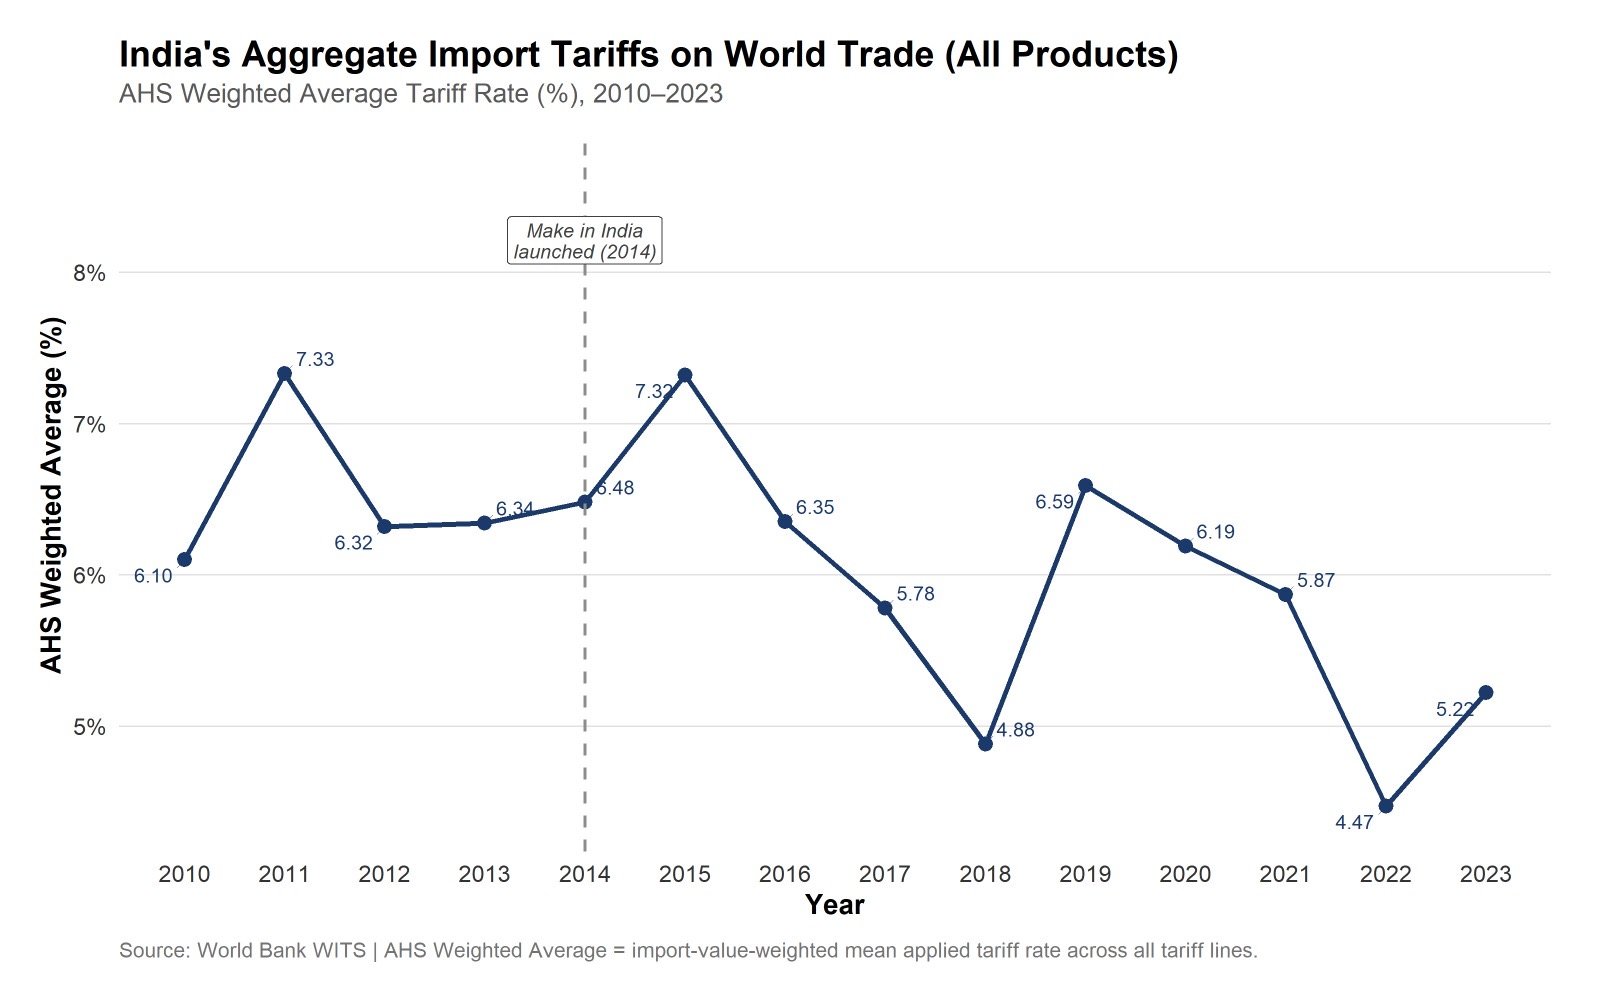
Figure 1: India’s Aggregate Import Tariffs on World Trade (All Products), AHS Weighted Average (%), 2010–2023.
Source: World Bank
Aggregate Tariff Trends graph here presents India’s AHS Weighted Average tariff rate on all products from the period of 2010 to 2023. The data reveal a strategic oscillation rather than monotonic liberalisation. During the pre-2014 baseline, tariffs hovered between 6.10% and 7.33%, reflecting the legacy of post-1991 reforms (Panagariya, 2024). The 2014 launch marked an inflexion point here as the tariffs rose up to 7.32% in 2015, signalling that the government intended to use customs duties as an active industrial policy instrument. The period 2017–2018 saw a fall up to 4.88%, aligning with WTO rationalisation commitments, before rebounding back almost to 6.59% in 2019 amid stronger PLI schemes. COVID-19 introduced volatility, causing the rates to dip to 4.47% in 2022 and partially recover to 5.27% in 2023, indicating a continuing balancing act between protection and compliance.
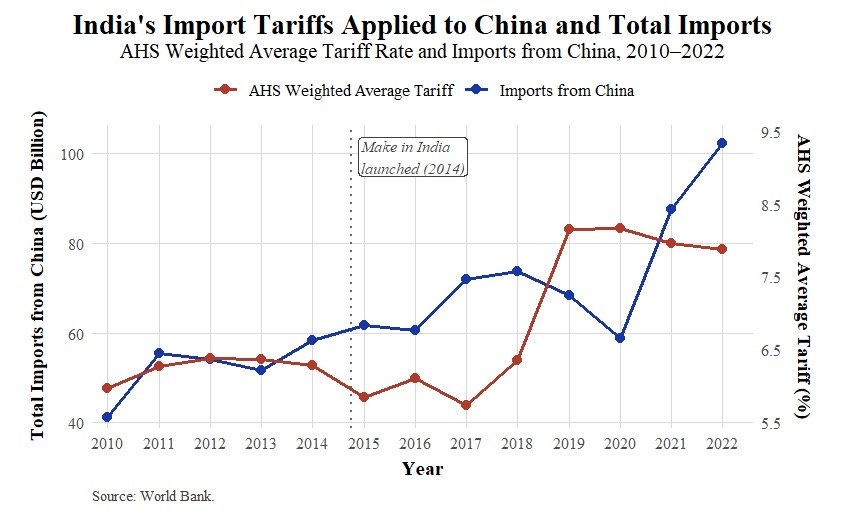
Figure 2: India’s Import Tariffs Applied to China (All Products), AHS Weighted Average (%), Import Value (USD Thousand), 2010–2022.
Source: World Bank
Tariffs Applied to Chinese Imports: This figure helps to disaggregate the analysis to China-specific tariffs. India’s trade data for 2010–2022 demonstrates that, despite rising tariffs, moving from roughly 5.8% to almost 8.15% by 2019, imports from China expanded substantially from $40 billion in 2010 to $102 billion in 2022 approximately, driven primarily by equipment, electronics, chemicals, and consumer goods. The structural break occurred during the period of 2018–2019, when tariffs surged from 6.35% up to 8.15%, coinciding and intensifying due to geopolitical tensions including the Doklam standoff and Galwan Valley clash (Chaudhary, 2025; Chaudhry et al., 2025). This pattern indicates India’s enduring structural dependence on Chinese supply chains, particularly in capital-intensive industries where credible domestic alternatives remain constrained. The peak of 8.16% in 2020 represented the apex of India’s protectionist posture as it shows, gradually declining to 7.88% by 2022 as practical constraints of sustaining high tariffs on essential commodities became much more evident. Although the launch of Make in India in 2014 reflected an explicit policy goal of promoting self-reliance, the continued growth in imports suggests shortcomings in execution, including insufficient infrastructure, gaps in technology transfer, and weaknesses in supply chain resilience.
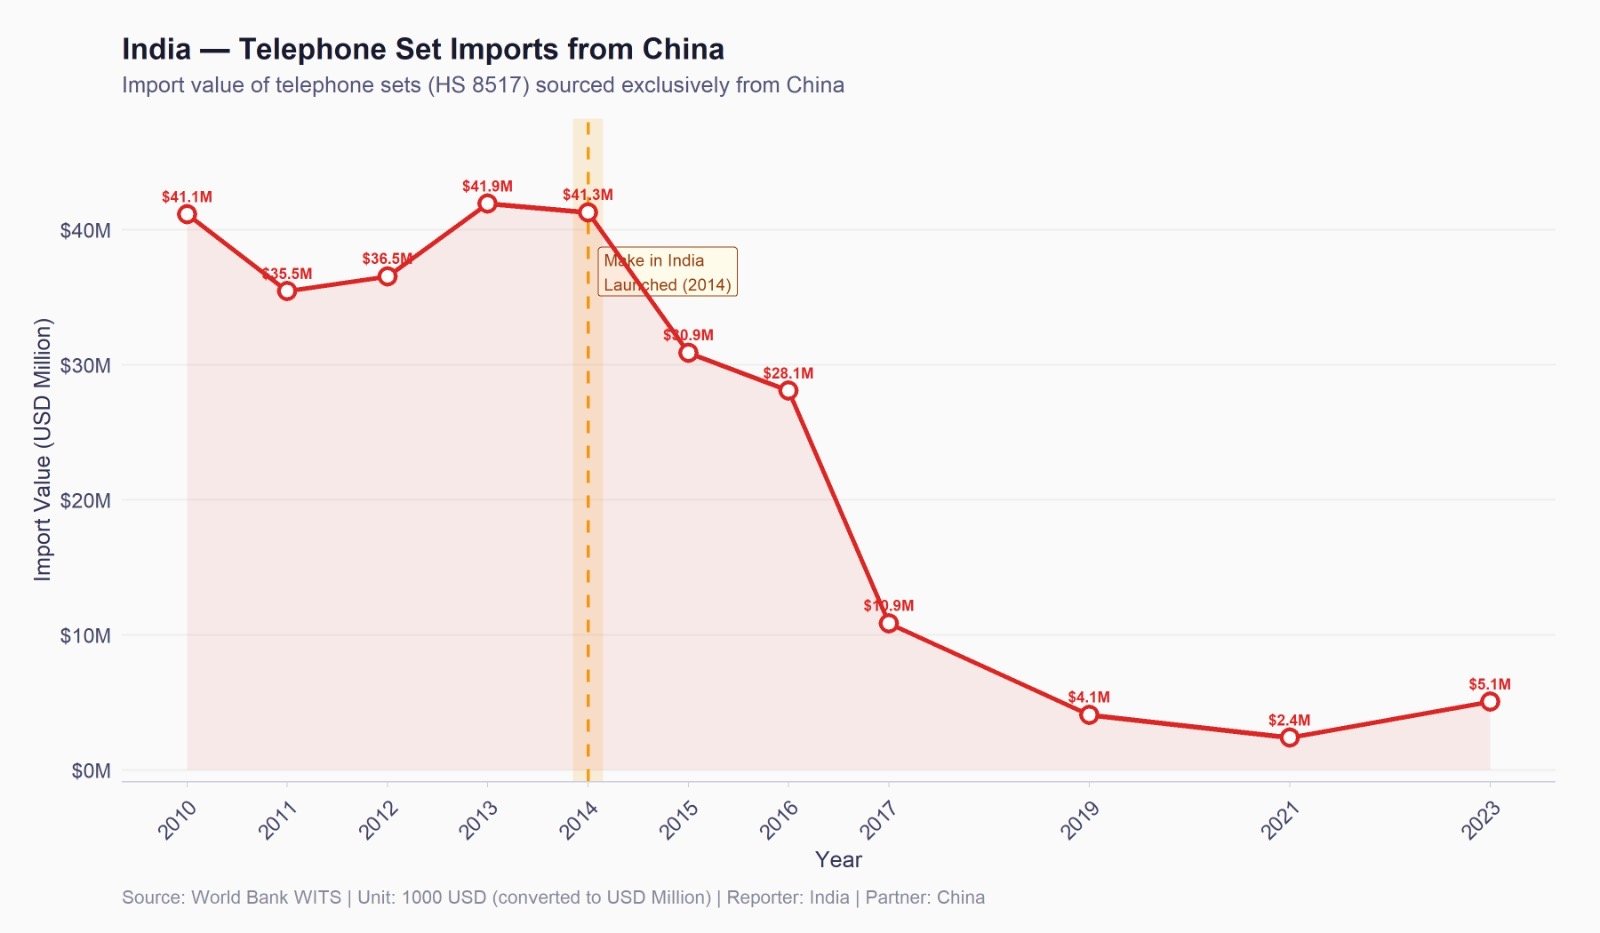
Figure 3: India’s Telephone Set Imports from China (HS 8517), Import Value (USD Million), 2010–2023.
Source: World Bank WITS
The Mobile Phones and Electronics sector examines telephone set imports (HS 8517) from China. During the period of 2010–2014, the imports still remained high ($35.5–$41.9 million) with negligible customs duties on finished phones. But the turning point emerged in 2015, with a sustained decline in the following phased duty escalation (0% to 20% by 2019) and the PLI scheme for large-scale electronics manufacturing (Press Information Bureau, 2025). By 2023, imports had plummeted up to $5.1 million, which was an 87.6% decline from the 2014 peak, indicating that the genuine import substitution through the expansion of domestic assembly (Gupta et al., 2021).
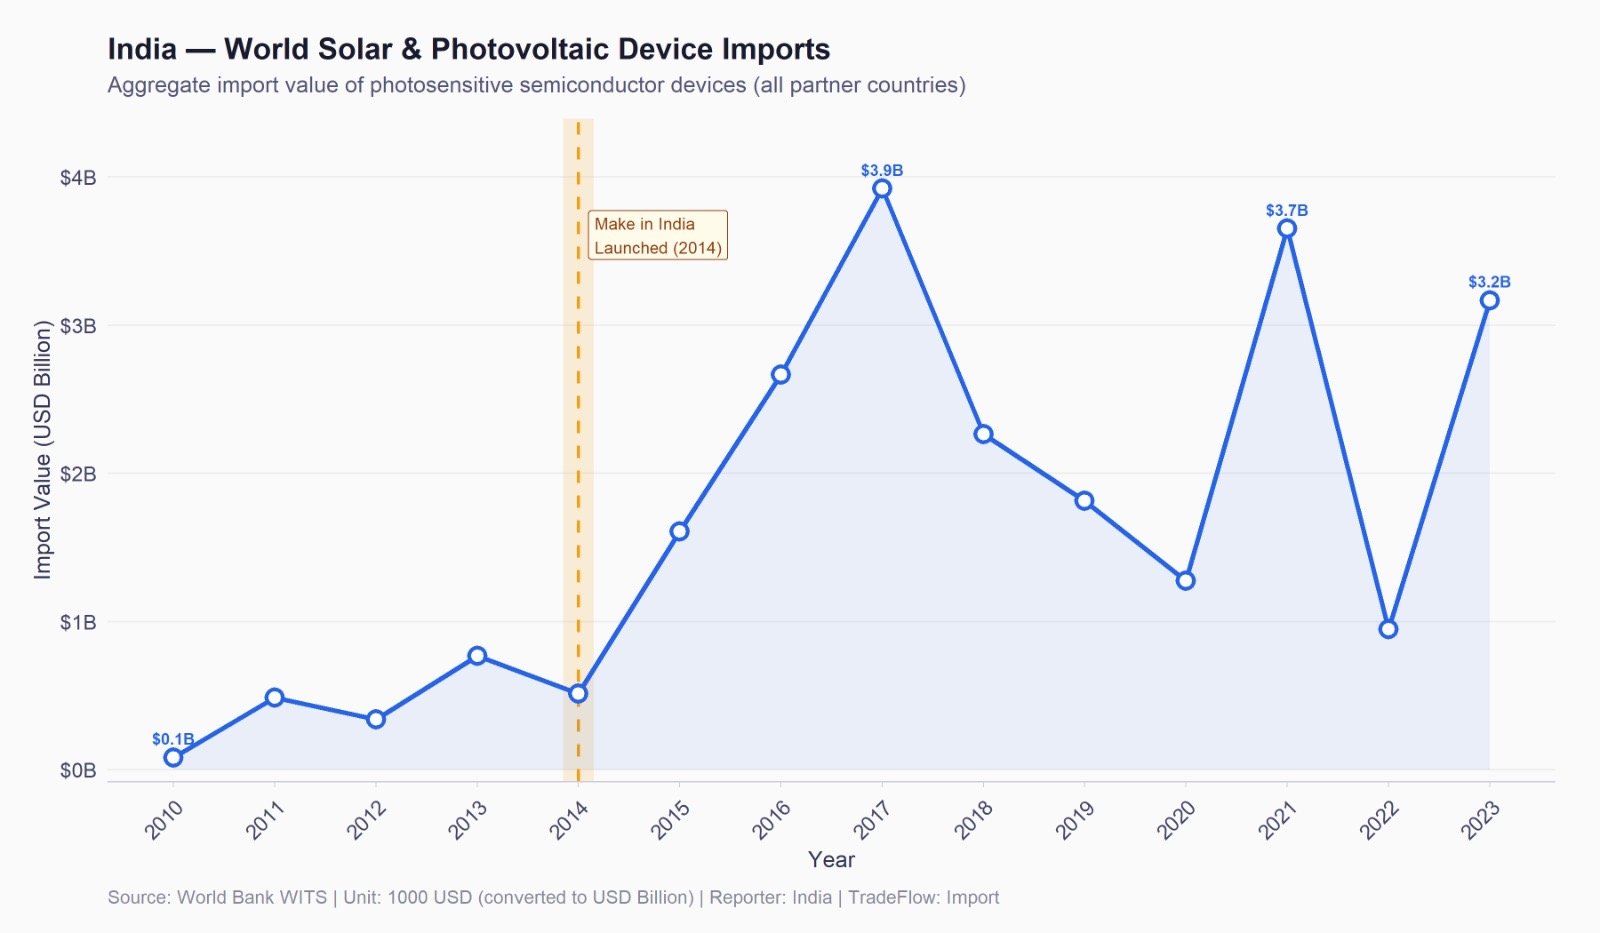
Figure 4: India’s Solar and Photovoltaic Device Imports from China, Import Value (USD Billion), 2010–2023.
Source: World Bank.
Solar Photovoltaic Devices: this graph here presents a contrasting case. Despite the Jawaharlal Nehru National Solar Mission (2010) and local content requirements, imports surged up to $3.9 billion in 2017 following India’s WTO case, as it was defeated in a dispute over domestic content requirements (Shiradkar et al., 2022). Although safeguard duties (2018) and Basic Customs Duties (2022) were imposed, imports rebounded back up to $3.7 billion in 2021 and $3.2 billion in 2023 respectively. The divergence from mobile phones is attributed to India’s limited domestic manufacturing scale, negligible wafer and poly silicon capacity, and technological dependence on Chinese upstream inputs (Biswas et al., 2022; The Energy and Resources Institute, 2025).
4. CASE STUDY AND ANALYSIS
The Make in India policy has been implemented across a range of sectors, with varying levels of success. These differences may be attributed to the supporting policy measures adopted, the responsiveness of individual sectors to these measures, and the extent to which industries were able to utilise the support provided by the government. The mobile phone industry represents one of the most successful outcomes of the initiative, while the solar manufacturing sector has witnessed comparatively limited progress. Examining these two sectors provides insight into the factors shaping the effectiveness of tariff-led industrial policy.
The mobile phone and solar manufacturing industries have been selected due to their contrasting outcomes under the Make in India initiative. While mobile manufacturing emerged as one of the programme’s most successful examples of tariff-supported industrialisation, the solar manufacturing sector has achieved comparatively limited progress despite similar policy interventions. Their comparison enables an assessment of the conditions under which tariff-led industrial policy is more or less effective.
4.1 Mobile Phone Industry Under Make In India Policy
India’s Make in India (2014) initiative, which placed great emphasis on trade protectionism, employed import tariffs as a key industrial policy tool to reduce dependence on imports and promote domestic manufacturing. Under the Phased Manufacturing Programme (PMP) introduced in 2015, the Basic Customs Duty on imported mobile handsets was progressively raised – 10% till 2017, 15% till 2018, and 20% by 2018-19- thus making imports relatively costlier and domestic assembly more attractive.
The policy significantly expanded India’s mobile manufacturing capacity. Mobile phone imports declined from 78% (FY2015) to just 4% (FY2024), coupled with electronics production rising from ₹1.90 lakh crore (FY2015) to ₹9.52 lakh crore (FY2024). Nearly 99% of smartphones sold were manufactured in India, with annual production reaching 33 crore units and over 75% of the production being 5G-enabled. Manufacturing units expanded from only 3 in 2014 to 268 by 2018, of which roughly 37% were mobile phone plants. Furthermore, exports rose from zero (FY2016) to ₹88,726 crore (FY2023). Output recovered sharply under the PMP and subsequent Production-Linked Incentive (PLI) scheme, although a fall in production, to 10% in 2014–15 from 24% in 2012–13, was witnessed following the closure of Nokia’s Chennai plant, tracing a pronounced “saucer-shaped” growth pattern with production growing roughly 1100% between 2014–15 and 2019–20.
Despite these achievements, tariff-led industrialisation remains constrained by several structural limitations. India’s electronics industry accounts for only about 4% of the global electronics market. India’s shallow integration into the global value chains is evident in a lack of indigenous R&D and the complete absence of semiconductor foundries. While smartphone exports have surged, the limited expansion of domestic component and PCB manufacturing has left the industry reliant on imported inputs. Ultimately, although strategic tariffs stimulated domestic manufacturing and assembly, they did not fundamentally transform India’s dependence on imported inputs, foreign technology, and overseas capital.
This suggests that the success of the mobile phone industry cannot be attributed to tariff protection alone, but also to its interaction with complementary policy measures such as the Phased Manufacturing Programme, the Production-Linked Incentive scheme, and expanding manufacturing capacity, which together facilitated greater integration into global production networks.
4.2 Solar Industry Under Make in India Policy
India’s Make in India initiative extended its tariff-led approach to solar manufacturing through a precisely staged policy architecture. Since April 2022, the Ministry of New and Renewable Energy has imposed a Basic Customs Duty (BCD) of 25% on imported solar cells and 40% on imported solar modules, raising the cost of imports relative to domestic production. This was complemented by the Approved List of Models and Manufacturers (ALMM), effectively excluding foreign suppliers from most government-backed projects. The Production-Linked Incentive (PLI) scheme, introduced in 2021 and modelled on China’s Top Runner programme (2017), began with ₹4,500 crore and was expanded to ₹24,000 crore in the February 2022 Budget after strong industry response. Despite these measures, technology adoption lags: in 2019, 87% of modules from India’s top seven manufacturers still used multi-Si wafers, and Indian lines remain built around smaller 156–158mm wafers against China’s 166–210mm, raising unit costs.
Structural gaps persist beneath the tariff layer. Domestic manufacturers pay three to four times the interest rates Chinese manufacturers pay on debt, and IREDA’s own lending rates for manufacturing run up to 105 basis points higher than its rates for solar/wind deployment. Manufacturers still import machinery mainly from China or Europe; Siemens CVD reactors, Czochralski furnaces, and PECVD reactors alone make up 40% of equipment costs in a PERC facility, none of it produced domestically. R&D investment remains minimal: the 2022–23 Union Budget allocated just ₹35 crore for renewable R&D, and the Department of Science andTechnology funded only ₹208 crore of solar R&D between 2015 and 2020, almost entirely to academic labs rather than industry. China’s contrasting state-backed financing, subsidised clustering, and R&D scale, by comparison, helped it secure 77% of global poly silicon capacity. Tariffs have thus protected assembly, but not closed India’s deeper technology and capital dependence.
In contrast to the mobile phone industry, tariff protection in the solar manufacturing sector remained constrained by technological dependence, limited domestic research and development, high financing costs, and continued reliance on imported manufacturing equipment. The contrasting experiences of the two sectors indicate that while tariff protection can stimulate domestic manufacturing, its effectiveness ultimately depends on the presence of complementary industrial capabilities, technological advancement, and resilient domestic supply chains.
5. FINDINGS
Despite India substantially increasing its import tariffs following the launch of the Make in India programme in 2014, total import volumes did not exhibit a meaningful decline, nor did reliance on Chinese goods decrease. Overall tariff rates rose consistently after 2014, while China-specific tariffs jumped from 6.35% in 2018 to 8.15% in 2019 and then reached a high of 8.16% in 2020 (World Bank WITS, 2024). At the same time, India’s overall import volume continued to increase, and China’s share of India’s imports climbed from 11.1% to 16.1%, suggesting that higher tariffs did not reduce India’s dependence on Chinese imports during the study period. A Pearson correlation test between China-specific average tariff rates and total import volumes from China yielded r = –0.12 (p ≈ 0.72), indicating no statistically significant linear association between tariff rates and total import volumes from China.
This study focuses on mobile phones and solar panels as contrasting case studies because they exhibit different outcomes under the same tariff environment; one centred on assembly with feasible localisation, the other characterised by technology intensity with substantial upstream dependencies. The mobile phone industry, supported by the Phased Manufacturing Programme (PMP) and the Production-Linked Incentive (PLI) scheme, shows demonstrable gains: domestic electronics production increased from ₹1.90 lakh crore in FY2015 to ₹9.52 lakh crore in FY2024, and imports of telephone sets from China fell by 87.6% from $41.3 million in 2014 to $5.1 million in 2023 (World Bank WITS, 2024). In contrast, the solar panel sector highlights the boundaries of tariff-led policymaking. Even after imposing a 25% basic customs duty on cells and 40% on modules starting in April 2022, India continued to depend heavily on Chinese imports, which stood at $3.2 billion in 2023, compared with $3.9 billion in 2017 (World Bank WITS, 2024). The sector remained constrained by a limited domestic manufacturing base, technological dependence on upstream inputs, insufficient research and development, and high capital costs. These findings hence indicate that tariffs alone cannot deliver the broader objective of lowering import dependence; instead, stronger industrial capacity, technological progress, targeted investment, and a functional domestic supply chain are required as essential complementary factors.
6. DISCUSSION
The impact of India’s tariff hikes under its Make in India programme has been more complicated than expected. Although tariff protection was meant to promote local manufacturing and reduce dependence on imports, there is evidence to suggest that these objectives were not fully realised in the aggregate. Increased tariffs didn’t halt the rise in total imports, and reliance on Chinese goods remained. The findings are in line with the previous studies of Athukorala (2020), Panagariya (2024) and Chaudhury (2022), who argued that tariff protection alone cannot enhance manufacturing competitiveness without structural changes. This is further supported by the present study, which found no statistically significant linear association between China-specific tariff rates and import volumes from China (r = –0.12, p ≈ 0.72).
The sectoral analysis helps explain why aggregate outcomes differed across industries and highlights the importance of comparing sectors with different levels of domestic productive capability. The mobile phone industry benefited not only from tariff protection but also from targeted government initiatives, investment incentives, and the gradual development of domestic manufacturing and assembly ecosystems. In contrast, the solar industry remained constrained by technological dependence, limited domestic manufacturing capacity, weaker supply-chain integration, and high capital requirements, reducing the ability of domestic producers to substitute for imported components. This divergence suggests that tariff protection is more effective when accompanied by complementary industrial capabilities. Tariffs alone may provide temporary protection but are insufficient to generate sustained import substitution in sectors lacking domestic technological capability and integrated supply chains.
However, the reliance on aggregate WITS data and Pearson correlation has limitations. It does not capture external shocks such as the COVID-19 pandemic, WTO disputes over domestic content requirements, or evolving global supply chain dynamics, including friend-shoring trends. Trade patterns may also have been influenced by factors beyond tariff policy. Hence, future trade and industrial policy should focus on building domestic capabilities rather than strengthening border protection. A more sustainable solution would be to invest in technology, research and development, infrastructure and supply-chain management. The success of import-substitution policies ultimately depends not only on higher tariffs but also on the strength of the domestic industrial ecosystem
7. CONCLUSION
India’s trade policy since 2014 has undergone one of the most significant shifts in the country’s economic narrative since the landmark reforms of 1991. This paper has tried to lift the veil on the “Make in India” initiative, with a focus on whether strategic application of import tariffs has lived up to its promise of stimulating self-reliance and disconnection from Chinese supply chains. The empirical evidence compiled from 2010 to 2023 reveals a complex and contradictory reality. While the Indian government successfully put up a protectionist wall, with the simple average tariff peaking at 12.2% and the China-specific weighted average reaching approximately 8.16%, this study finds that the wall contributed very little to stem the tide of foreign goods. Almost 100% increases in import volumes from China were seen, and the statistical relationship between increases in China-specific tariffs and import reduction from China continued to be non-existent (r = –0.12, p ≈ 0.72).
Perhaps the most important finding is the continued and increasing dependence of India on China. Although the policy aims to reduce import dependence, the share of China in imports has increased to 16.1%. Furthermore, it shows that there is no statistically significant relationship (r = –0.12, p ≈ 0.72) between higher China-specific tariff rates and declines in import volumes from China over the study period. This means that tariff protection alone was insufficient to achieve the objective of import substitution. The different experiences of the mobile phone and the solar industries are an example of what this study calls the “Sectoral Paradox”. The mobile phone sector benefited from tariffs supported by the Production-Linked Incentive (PLI) scheme, infrastructure development and expansion of manufacturing. The solar sector was constrained by technological dependence, limited domestic capacity and weak supply-chain integration. Tariffs alone cannot reduce import dependence without strong domestic industrial capacity.
8. LIMITATIONS AND SCOPE FOR FUTURE RESEARCH
The present study offers a detailed empirical evaluation, but it has limitations. A major limitation is the use of aggregate and product-level data from the WITS database, which can suffer from reporting lags and thus may hide the latest changes in trade behaviour from 2024 onward. The use of Pearson correlation provides only a simple measure of association and does not establish causality between tariffs and import trends. Moreover, this analysis lumps “imports” together as one category. It does not fully distinguish between “intermediate goods” used for further manufacturing and “capital goods” for infrastructure. Future research needs to carry out a more granular “Value-Added” analysis to determine whether India is merely shifting from importing finished Chinese goods to importing Chinese components for domestic assembly, known as trade diversion. Moreover, the disruptive effects of the COVID-19 pandemic and the subsequent global supply chain “friend-shoring” trends need to be explored further. Further research can explore the role of the Production-Linked Incentive (PLI) schemes in a wider range of sectors like semiconductors or specialty chemicals to see how far the “Mobile Phone Model” is truly replicable. The interaction between regional free trade agreements and domestic protectionism is an important frontier for trade scholars.
REFERENCES
Athukorala, P. C. (2020). Trump’s trade war: An Indian perspective. Australian National University.
Biswas, S., Kale, A., Srinivasan, A., & Singh, A. (2022). Making India a leader in solar manufacturing: Ways to achieve technology leadership and global competitiveness. Council on Energy, Environment and Water.
Bouët, A., Decreux, Y., Fontagné, L., Jean, S., & Laborde, D. (2004). A consistent, ad-valorem equivalent measure of applied protection across the world: The MacMap-HS6 database. CEPII Working Paper.
Chaudhary, S. (2025). India-China trade dynamics: Dependency, deficit, and decoupling trends. SSJAR.
Chaudhry, S., Sharma, P., & Chaudhery, U. (2025). Interlocking giants: Understanding India-China trade dynamics. European Economic Letters.
Choudhury, R. N. (2022). Why did the Make in India scheme fail to attract FDI inflows in the Indian manufacturing sector? Public Administration. https://doi.org/10.1002/pa.2341
Creswell, J. D., & Creswell, J. W. (2018). Research design: Qualitative, quantitative, and mixed methods approach (5th ed.). SAGE Publications.
Goel, M. (2016). Solar rooftop in India: Policies, challenges and outlook. Green Energy & Environment, 1(2), 129–137. https://doi.org/10.1016/j.gee.2016.08.003
Government of India, Ministry of Finance. (2024). Economic survey of India 2024–25. Ministry of Finance.
Gupta, N., Kumar, P., & Saini, R. (2021). India’s electronics industry: Potential for domestic manufacturing and exports. ICRIER-ICEA. https://icrier.org/publications/neha-gupta-priya-kumar-and-rachit-saini/
Invest India. (2026). Basic customs duty: India’s vision for Atmanirbhar solar manufacturing. Ministry of New & Renewable Energy.
Iyer, C. G. (2021). Mobile phone manufacturing in India. Centre for Development Studies.
Krugman, P. R., & Obstfeld, M. (2018). International economics: Theory and policy (11th ed.).
Pearson.Kumar, K. (2023). Aatmanirbhar Bharat and Make in India: A step towards making India self-dependent. The International Journal of Social Sciences and Humanities Invention, 10(1), 7560–7568. https://doi.org/10.18535/ijsjshi/v10i01.01
Ministry of Electronics and Information Technology. (2019). Notification circulars and scheme guidelines pertaining to Production-Linked Incentive schemes. Government of India.
Ministry of Electronics and Information Technology. (2021). Scheme guidelines for large-scale electronics manufacturing. Government of India.
Narayanan, B. G., Sen, R., Iyer, C., Khorana, S., & Srivastava, S. (2020). A quantitative assessment of economic impact of trade wars and the Make in India program. [Working paper].
Panagariya, A. (2024). India’s trade policy and a road map for its liberalization. Columbia University.
Press Information Bureau. (2025). Mobile manufacturing sees unprecedented growth under PLI. Government of India.
Rawat, M., Raj, R., & Agarwal, T. (2020). A critical review of Make in India as an import substitute. SSRN Electronic Journal.
Rupal, V. (2020). India’s exit from the RCEP: Why and what’s next? (Discussion Paper). Social and Political Research Foundation.
Saraswat, V. K., Priya, P., & Kumar, N. (2022). India’s tariff policy and Production-Linked Incentives: Balancing WTO commitments and Atmanirbhar Bharat [Working Paper]. ICRIER.
(Please verify exact title and authors)
Shiradkar, N., Arya, R., Chaubal, A., Deshmukh, K., Ghosh, P., Kumar, S., Kottantharayil, A., & Vasi, J. (2022). Recent developments in solar manufacturing in India. Solar Compass, 1, Article 100009. https://doi.org/10.1016/j.solcom.2022.100009
The Energy and Resources Institute. (2025). Annual report 2024–2025. https://teriin.org/files/TERI-Annual-Report-2024-25.pdf
World Bank. (2024). World Integrated Trade Solution (WITS). https://wits.worldbank.org
The authors sincerely acknowledge Balkaran Singh for his valuable assistance and contribution to the writing and preparation of this research paper.