AUTHORS:
ASTHA SINGHA, DIVYA, HARDEE PRAJAPATI, NABIRA AZIZ AND VAISHNAVI PARAG PRABHU
ABSTRACT
Public investment in education is critical for human capital formation and socio-economic development; however, its effectiveness depends not only on the level of budgetary allocation but also on the extent to which allocated resources are realised as actual expenditure. This study examines the budget execution gap in India’s school education sector by analysing the relationship between Budget Estimates (BE), Revised Estimates (RE), and Actual Expenditure (AE) during 2018–19 to 2023–24. Addressing the limited attention given in the existing literature to the budget execution process as a continuum, the study employs secondary data and a descriptive and comparative approach to examine expenditure patterns at the national, regional, state and subsectoral levels. The findings indicate a substantial expansion in budgetary allocations alongside a persistent gap between allocated and actual expenditure. Utilisation weakened during 2020–21 before improving in the subsequent years, while regional and state-level analysis reveals substantial variation in expenditure performance. The comparison of BE, RE and AE further demonstrates that budgetary revisions can substantially influence the assessment of expenditure performance and provide a clearer indication of the extent to which revised provisions are ultimately utilised. The study therefore argues that education financing should be assessed not merely by the magnitude of allocations, but through the broader process of budgetary commitment, revision and actual expenditure.
KEYWORDS:
Education Financing; Budget Execution; Budget Estimates; Revised Estimates; Actual Expenditure; Expenditure Gap; Budget Utilisation; India.
INTRODUCTION
Education is an important component of socio-economic development, with public expenditure playing a central role in expanding access and supporting the provision of quality education. In India, the commitment of the state towards education is reflected in constitutional provisions and policy frameworks, including the Right to Education Act and the National Education Policy. Despite these commitments, public expenditure on education has remained below the recommended marking of 6 per cent of GDP. This raises questions not only about the adequacy of budgetary allocations but also about their translation into actual expenditure. Within this broader context, school education forms the primary focus of this present study showing its importance for universal access and large-scale public financing.
A budget allocation represents an initial financial commitment and does not necessarily correspond to the amount ultimately spent. The movement from the Budget Estimate (BE) to the Revised Estimate (RE) and finally to Actual Expenditure (AE) can provide a more detailed picture of the executed budget. The examination of these stages makes it possible to distinguish between the amount initially provided, subsequent revisions, and the resources ultimately utilised.
The existing research works on education financing in India have examined issues related to expenditure adequacy, its utilisation, efficiency, governance, fiscal federalism, equity, and also the educational outcomes. However, these dimensions are often considered independently. Less attention has been given to examining the budgetary process as a continuum from initial allocation to revised provision and final expenditure, particularly across different geographical levels within school education.
The present study addresses this gap by examining BE, RE, and AE in school education during 2018–19 to 2023–24, with analysis at the national, regional, and state levels. A limited comparison with higher education is also undertaken to provide a sub-sectoral perspective on budget execution. Through secondary data and a descriptive comparative approach, this study examines expenditure gaps and utilisation patterns while remaining cautious about drawing causal conclusions from the available data.
LITERATURE REVIEW
Overview
In India public education financing has been studied very extensively from various dimensions that rarely meet: the adequacy of expenditure, its efficiency, the conditions of governance under which it is executed, and its distributional and the effects of outcome.
This review organises the literature under four major themes and then assesses it critically, with mainly two questions in mind. First, what does the literature establish with confidence? Second, what does it leave unresolved, and why? The second question matters more for this study because, as the synthesis will show, the existing literature repeatedly shows a gap between commitment of budget utilisation and the actual expenditure without being able to locate where in the budgetary process that gap arises. Throughout, BE denotes the Budget Estimate, RE the mid-year Revised Estimate, and AE the Actual Expenditure.
Theme 1: Education as public investment and the persistent financing shortfall
The first theme shows how education expenditure is a long-term investment in human capital rather than spending on welfare. Tilak (2007) grounds this in the Kothari Commission’s case for public financing as an instrument for expanding access to education and reducing inequality among people, while De and Endow (2008) argues that expenditure on education should be evaluated as an investment whose returns depend on the sustained commitment rather than one-off increases. Motkuri and Revathi (2024) provides the empirical dimension and establishes a long-run positive relationship between the public education expenditure and economic growth of any society.
The same literature, however, also documents how far India remains from adequate financing. Multiple studies merge on the finding that education expenditure has stayed in the 3 to 4.5 per cent of GDP range despite the rise in absolute allocations, against the 6 per cent benchmark (De and Endow, 2008; Dubey, 2010; Mehrotra, 2011; Tilak, 2007; Motkuri and Revathi, 2024). Here two refinements matter. First, the shortfall is relative to the expanding
of responsibilities: De and Endow (2008) note that expenditure grew in the 1990s yet it lagged the faster-growing requirements of universal elementary education, and Dubey (2010) makes a parallel argument for the Right to Education framework. Rise in budgets therefore cannot be read as adequate financing. Second, the financial burden is unevenly distributed. Motkuri and Revathi (2024) estimated that roughly 75 per cent of total public education expenditure is done by States, against about 25 per cent by the Centre, with the Centre’s share declining from 27.5 per cent in 2010-11 to around 22 per cent; education absorbs more than 20 per cent of State budgets but under 10 per cent of the Union budget. The adequacy question is thus inseparable from the federal distribution of fiscal responsibility.
Theme 2: From allocation to utilisation: under-allocation, under-utilisation and efficiency
A second theme shifts its attention from how much is allocated to how much of it is spent, and what the spending actually produces. De and Endow (2008) provide the framework: public education expenditure should be assessed through allocation, composition and utilisation rather than announced commitments. The literature working within this framework distinguishes three conceptually separate failures : under-allocation (resources insufficient to requirements), under-utilisation (allocated resources not converted into expenditure), and inefficient utilisation (expenditure occurring without proportionate improvement in services or outcomes).
The empirical evidence for the third failure is the strongest and the most consequential. Mohanty and Bhanumurthy (2020), using data analysis across major Indian states, find wide variation in public expenditure efficiency and show that governance quality is the dominant explanatory factor, with states spending education resources more efficiently than health but with substantial resource-saving potential everywhere. Yadava and Neog (2019) reach a complementary conclusion: some states improve social-sector outcomes through better expenditure management without increasing any total spending. Sinha (2025), using stochastic frontier analysis over 2014-2023 and confirms the pattern more recently, estimating technical efficiency scores ranging from 0.68 to 0.93 across states and attributing most of the variation in outcomes to inefficiency rather than some random shocks. Read together, these studies mean that higher spending does not automatically yield better performance, and that identical allocations can produce different results depending on institutional capacity.
The evidence for under-utilisation is real but it’s thinner. CBGA’s district studies of Samagra Shiksha document delayed fund releases, weak financial management and administrative bottlenecks, and the CAG’s 2025 audit of PM POSHAN and ICDS finds substantial unspent balances at the district level. These are careful descriptive audits of some specific schemes, however there is not systematic sector-wide evidence, and they measure utilisation after the fact. It can be noticed that the literature rarely distinguishes whether an unspent balance reflects an allocation that was revised downward mid-year or a fully maintained provision that implementing agencies have failed to absorb, because the utilisation is typically computed against whichever denominator the study happens to have. Choudhary (2026) illustrates the variation across programmes that Union expenditure is spread across Samagra Shiksha, PM POSHAN, central universities, IITs, NITs, UGC, student aid and PM-USHA, and execution differs sharply across them with research and innovation averaging around 47 per cent utilisation of allocated funds between 2017-18 and 2024-25.
Theme 3: Fiscal federalism, governance and budget execution
The differences documented in Theme 2 point to their institutional setting. Education is a Concurrent List subject, and State Governments carry the larger share of financing (Tilak, 2007; Motkuri and Revathi, 2024). This structural position has consequences for execution. Chakrabarti and Joglekar (2006) find important interstate differences in education expenditure driven by fiscal capacity. Other than that Mehrotra (2011) also shows that intergovernmental transfers have not consistently neutralised these disparities. Ramanjini and Gayithri (2023) add a dynamic dimension: state education expenditure is pro-cyclical with respect to the GSDP, economic downturns compress education spending (particularly higher education), and Union transfers have not insulated state education budgets during the downturns.
Fiscal capacity alone, however, does not explain the execution differences; governance can operate through specific mechanisms. Mohanty and Bhanumurthy (2020) and Sinha (2025) both identify that governance quality and the institutional capacity are the central determinants of expenditure efficiency, and the audit evidence in Theme 2 locates the mechanisms concretely: timing of fund releases, financial management and reporting, and coordination between all levels of government. These all mechanisms bear directly on the budget cycle. Delay in releases and implementation constraints would be expected to push expenditure below a maintained provision, while mid-year revisions alter the provision itself. Yet Theme 3, like Theme 2, examines these factors through overall expenditure, utilisation or outcomes rather than just going through the successive stages of the budget cycle, so the linkage remains inferential.
Theme 4: Equity, composition and educational outcomes
A final theme asks whether allocated and spent resources are well directed and whether they actually improve education. Jhingran and Sankar (2009), using district-level indices, find that resource allocation does not always correspond to educational needs, limiting what disadvantaged districts can do with available funds, while also showing that targeted funding can improve the provision where it is appropriately directed. The implication is not simply that more money should flow to disadvantaged regions, but that allocations should be aligned with differing requirements and implementation capacity.
There are two further cautions that temper this theme. On composition, education budgets mix recurring expenditure such as salaries with capital and quality-related spending; these recurring expenditure is not inherently inefficient, and the meaningful question is whether overall composition matches programme and regional needs. On outcomes, Johnson and Parrado (2021) show that 75 to 88 per cent variation in each year in district learning scores may reflect measurement errors in NAS and ASER data, which undermines any direct conclusion from expenditure changes to learning changes. The financial execution and educational outcomes are therefore very distinct dimensions of performance that should not be treated as interchangeable.
CRITICAL SYNTHESIS AND RESEARCH GAP
The literature merges on one proposition and divides on a second. The point of convergence here is that India’s education financing is constantly falling short of the 6 per cent benchmark in a structural rather than transitory way, and that the burden of financing falls disproportionately in the States. The point of divergence is more consequential: whether additional expenditure by itself improves educational performance. Motkuri and Revathi (2024) talked-about a long-run positive association between public education expenditure and growth, yet the efficiency literature (Mohanty and Bhanumurthy, 2020; Yadava and Neog, 2019; Sinha, 2025) shows that states with comparative spending achieves different results. The two findings are reconcilable only if the level of allocation is necessary but not in sufficient condition for effective financing, and if the binding limit in many cases lies downstream of the budget decision, in execution.
The credibility of that second theme of evidence is really uneven, and the literature rarely acknowledges this. The efficiency estimates rest on the frontier and DEA techniques whose results are sensitive to input and output selection; the utilisation findings from CBGA and the CAG are descriptive audits of the particular schemes; and Johnson and Parrado (2021) shows that the outcome data are too noisy to support the direct expenditure-outcome results. Taken seriously, this variety of outcomes supports only a qualified conclusion. The literature here also establishes that money often fails to reach the ground, but it is largely silent on where the budgetary process failure occurs.
This silence has a practical cost. Because studies examine allocation, utilisation, governance and outcomes as separate measures, an observed expenditure gap is typically attributed to whichever stage the author happens to measure. An audit finds the unspent balances and concludes that the implementation is weak. A budget analysis finds allocations below benchmarks and concludes that commitment is weak. Neither can establish whether the gap arose because the original Budget Estimate was revised downward mid-year or because a fully maintained Revised Estimate was not fully spent,or because the successive stages of the budget cycle are not traced together. The result is a literature that detects the existence of the gap but cannot localise it.
This is the gap the present study of ours addresses. By tracing Budget Estimates, Revised Estimates and Actual Expenditure as successive stages of a single execution process, across all the national, regional, state and subsectoral levels for 2018-19 to 2023-24, the study operationalises the distinction between under-allocation, mid-year revision effects and under-utilisation of revised provisions, a distinction the existing literature repeatedly gestures at but does not measure.
RESEARCH QUESTIONS
1. What is the gap between Budget Estimates (BE), Revised Estimates (RE), and Actual Expenditure in major Union Government education schemes during the study period?
2. How do expenditure utilization patterns differ between School Education and Higher Education schemes
3. What do the observed expenditure gaps indicate about patterns of budget utilization and implementation in India’s education sector?
GENERAL OBJECTIVE
To examine the gap between budget allocation and actual expenditure in India’s education sector by analysing Budget Estimates, Revised Estimates, Actual Expenditure, and expenditure utilization across major Union Government education schemes.
SPECIFIC OBJECTIVES
1. To analyse the differences between Budget Estimates, Revised Estimates, and Actual Expenditure across selected education schemes.
2. To compare expenditure utilization between School Education and Higher Education programmes.
3. To identify expenditure trends and interpret what they indicate about budget utilization and implementation patterns in India’s education sector.
METHODOLOGY
Research Design
The study adopts a descriptive and comparative research design to examine the relationship between budget allocation and actual expenditure in India’s education sector.
Descriptive research is appropriate because the study seeks to analyse financial trends and expenditure patterns without manipulating any variables. The comparative approach enables examination of expenditure patterns across selected school-education schemes, with a limited comparison with Higher Education using comparable department-level data. The examination of differences in budget utilization across selected education schemes, This design is consistent with the study’s objective of understanding expenditure gaps through systematic analysis of government financial data.
Nature of Research
The study is quantitative in nature and is based entirely on secondary data. Financial information is analysed using numerical indicators such as Budget Estimates (BE), Revised Estimates (RE), Actual Expenditure, expenditure gaps, and utilization rates. The research focuses on identifying expenditure trends and interpreting patterns in budget utilization rather than establishing causal relationships.
Data Selection Criteria
The study uses a pre-compiled secondary dataset supplied by IISPPR rather than a primary sample. For the national, regional and state-level analysis, observations classified within the supplied school-education schemes dataset for 2018–19 to 2023–24 are retained. The state-level analysis uses the ten states represented in that dataset, and the regional analysis uses the seven regions represented there. For the subsectoral comparison, only department-level observations for the Department of School Education and Literacy and the Department of Higher Education with complete and comparable BE, RE and AE figures are used; the common comparison year is 2023–24. Observations with missing BE, RE or AE values are excluded from the relevant calculation. This selection keeps the comparison based on the same financial concepts and utilisation formula while avoiding the treatment of the school-scheme and higher-education department datasets as one continuous series.
Data Collection Tool
The research relies exclusively on secondary data. The dataset includes financial information relating to Budget Estimates, Revised Estimates, Actual Expenditure, and expenditure utilization for selected education schemes across multiple financial years. Government budget documents and Ministry of Education publications are referred to only for contextual understanding and interpretation wherever required.
Data Scope and Comparability
The study does not estimate total public education expenditure for India. The national, regional and state-level tables (including Tables 1–6 and the related figures) use the supplied school-education schemes dataset. Higher Education is analysed separately from department-level Union Budget/Demands for Grants data. Because these datasets have different units of analysis and coverage, their values are not combined into a single six-year education series. The direct School Education–Higher Education comparison is restricted to 2023–24, for which both departments have BE, RE and AE, and both are evaluated using the same RE-based utilisation measure, RE–AE gap and budget-revision rate.
Variables Used
The independent variables include Budget Estimates (BE), Revised Estimates (RE), type of education scheme, and financial year. The dependent variables are Actual Expenditure, expenditure gap (BE–Actual and RE–Actual), and expenditure utilization rate. These variables facilitate comparison of expenditure performance across schemes and over time.
The following measures are applied consistently across the comparable BE–RE–AE observations:
- BE–AE gap = BE − AE;
- RE–AE gap = RE − AE
- BE-based utilisation (%) = (AE ÷ BE) × 100
- RE-based utilisation (%) = (AE ÷ RE) × 100
- Budget revision rate (%) = ((RE − BE) ÷ BE) × 100
- aggregate utilisation (%) = (ΣAE ÷ ΣBE) × 100 for the school-education schemes dataset.
A positive gap indicates expenditure below the relevant provision, while a negative BE–AE gap indicates that AE exceeded the original BE. For cross-subsector comparison, RE-based utilisation is treated as the primary comparable indicator because RE incorporates the budgetary revision made during the financial year.
Ethical Considerations
The study uses only secondary data obtained from IISPPR and publicly available government sources. Since no human participants are involved, issues relating to informed consent and confidentiality do not arise. The researchers ensure accurate reporting, proper acknowledgement of data sources, and objective interpretation of findings.
Limitations
The study is limited to the secondary dataset and therefore depends on the scope and completeness of the available data. The analysis focuses on expenditure patterns rather than educational outcomes and is descriptive in nature; consequently, it identifies trends and utilization gaps without establishing causal relationships.
DATA ANALYSIS AND INTERPRETATION
National-Level Analysis
Introduction to Data Analysis and Interpretation
This section analyses budgetary and expenditure patterns in India’s education sector using secondary data provided by the IISPPR team and supplementary information compiled from official budget documents and parliamentary sources. The analysis examines the relationship between budget allocation and actual expenditure, with particular attention to expenditure gaps and budget utilisation during the period 2018–19 to 2023–24.
The analysis considers both the absolute expenditure gap and the utilisation rate in order to assess the extent to which allocated resources were translated into actual expenditure. The utilisation rate is calculated as the proportion of the allocated budget that was actually spent. Examining these indicators together provides a more comprehensive assessment of budget execution than considering the size of allocations alone. The findings are presented through quantitative tables and figures are interpreted in relation to expenditure efficiency, financial management, and implementation within the education sector.
National Budget Expenditure Trends
Table 1. National Budget Allocation and Actual Expenditure on School Education, 2018–19 to 2023–24
|
Financial Year |
Budget Allocation (₹ crore) |
Actual Expenditure (₹ crore) |
Unspent Amount (₹ crore) |
Utilisation Rate (%) |
|
2018–19 |
68,881.12 |
63,528.79 |
5,352.33 |
92.23 |
|
2019–20 |
74,679.94 |
69,123.34 |
5,556.60 |
92.56 |
|
2020–21 |
68,772.37 |
61,268.79 |
7,503.58 |
89.09 |
|
2021–22 |
81,482.23 |
75,662.63 |
5,819.60 |
92.86 |
|
2022–23 |
96,956.44 |
89,872.36 |
7,084.08 |
92.69 |
|
2023–24 |
1,07,822.36 |
1,00,549.43 |
7,272.93 |
93.25 |
Source: IISPPR Education Budget Analysis Report, based on secondary data from the Ministry of Education, Government of India, and Union Budget Documents.
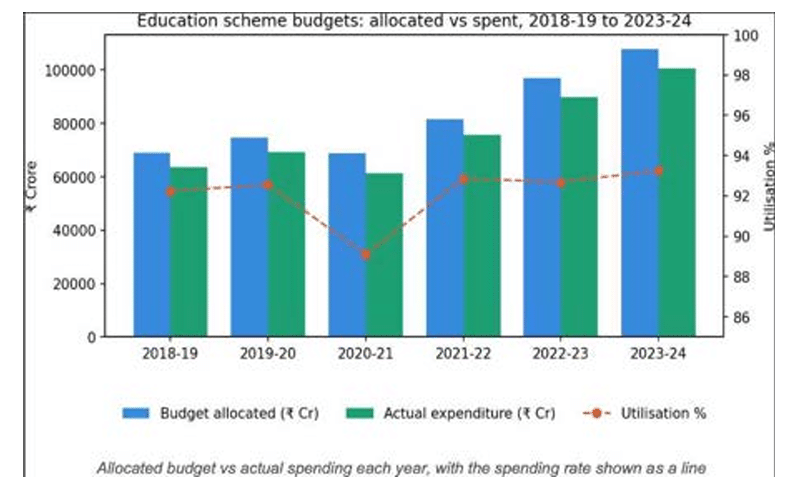
The national data indicate a substantial expansion in budgetary allocation over the study period. Budget allocation increased from ₹68,881.12 crore in 2018–19 to ₹1,07,822.36 crore in 2023–24, representing an increase of approximately 56.5%. Actual expenditure increased from ₹63,528.79 crore to ₹1,00,549.43 crore during the same period, an increase of approximately 58.3%.
Despite this overall growth, actual expenditure remained below the allocated amount in each year. Cumulatively, approximately ₹4,98,594 crore was allocated during the six-year period, while actual expenditure amounted to approximately ₹4,60,005 crore. This resulted in an aggregate expenditure gap of approximately ₹38,589 crore.
The annual pattern shows considerable variation. The expenditure gap increased from ₹5,352.33 crore in 2018–19 to ₹5,556.60 crore in 2019–20 before reaching its highest level of ₹7,503.58 crore in 2020–21. The corresponding utilisation rate also declined to 89.09% in 2020–21, the lowest recorded during the study period.
Following this decline, expenditure utilisation improved to 92.86% in 2021–22 and stood at 92.69% in 2022–23. By 2023–24, utilisation had increased further to 93.25%. This indicates a recovery in expenditure execution after 2020–21, although actual expenditure continued to remain below the allocated amount.
Figure 1. National Budget Allocation and Actual Expenditure on School Education, 2018-19 to 2023–24
Source: IISPPR Education Budget Analysis Report, based on secondary data from the Ministry of Education, Government of India, and Union Budget Documents.
Figure 1 demonstrates a general upward movement in both budget allocation and actual expenditure over the study period, while maintaining a consistent difference between the two. The gap becomes particularly relevant in the later years because the scale of the overall allocation has increased substantially.
National Expenditure Gap and Budget Utilisation
The utilisation rate ranged from 89.09% to 93.25% during the study period, indicating that the majority of allocated resources were converted into actual expenditure, although complete utilisation was not achieved in any year.
The relationship between the utilisation rate and the absolute expenditure gap is particularly important for interpreting expenditure performance. In 2018–19, a utilisation rate of 92.23% corresponded to an expenditure gap of ₹5,352.33 crore. By 2023–24, utilisation had increased to 93.25%, yet the absolute gap was ₹7,272.93 crore. Thus, an improvement in the percentage of budget utilised did not eliminate the substantial value of resources that remained unspent.
This reflects the effect of the expanding budget base: even a relatively small proportion of non-utilisation can represent a significant amount in absolute terms.
The year-wise figures are reported in Table 1 and are not repeated here. The main point is the relationship between the utilisation rate and the absolute expenditure gap. The pattern shows why percentage utilisation and the absolute amount left unspent should be read together. A small share of non-utilisation can still represent a sizeable amount when the budget base is large.
From a public financial management perspective, allocation and utilisation therefore provide different information about budget execution. The allocation shows the provision made, while the utilisation rate shows the proportion of that provision recorded as expenditure.
Key National-Level Findings
The national-level analysis identifies three principal findings:
- Expansion in budgetary allocation and expenditure: Budget allocation increased by approximately 56.5% between 2018–19 and 2023–24, while actual expenditure increased by approximately 58.3%.
- Persistent expenditure gap: Actual expenditure remained below allocation throughout the study period, resulting in a cumulative gap of approximately ₹38,589 crore.
- Improved utilisation alongside continued absolute gaps: Utilisation increased from 89.09%in 2020–21 to 93.25% in 2023–24; however, the expenditure gap remained ₹7,272.93 crore in 2023–24. This indicates that improvements in utilisation rates do not necessarily eliminate substantial unspent resources in absolute terms.
Overall, the national evidence suggests that the assessment of education financing should consider not only the growth of budgetary allocations but also the extent to which those allocations are converted into actual expenditure. The observed national-level pattern provides the basis for examining variations in expenditure performance across states, regions, and education categories in the subsequent sections.
Regional and State-Level Analysis
Regional Analysis
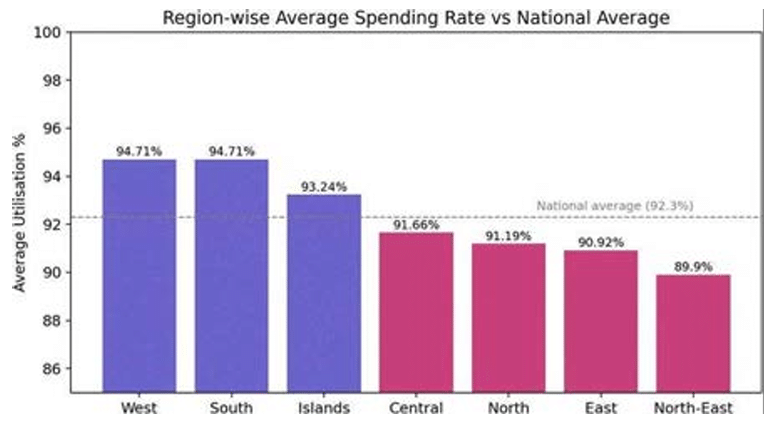
The regional analysis examines differences in education budget allocation, actual expenditure and utilisation across seven regions: North, South, East, West, Central, North-East and Islands. The regional figures collectively correspond to the national totals, allowing expenditure performance to be examined at a more disaggregated geographical level. The West and South recorded the highest utilisation rates at 94.71% each, followed by the Islands at 93.24%. Central, North and East recorded utilisation rates of 91.66%, 91.19% and 90.92%, respectively. The North-East recorded the lowest utilisation rate at 89.90%. This indicates that the utilisation of education funds varied across regions, although the differences were relatively moderate in percentage terms.
An important distinction emerges when utilisation rates are considered alongside the absolute expenditure gap. The North had the largest allocation of ₹1,54,241.76 crore and the largest absolute unspent amount of ₹13,583.90 crore, despite recording a utilisation rate of 91.19%. In contrast, the West recorded a higher utilisation rate of 94.71% and an unspent amount of ₹3,299.54 crore. This demonstrates that a relatively high utilisation rate does not necessarily correspond to a small absolute expenditure gap when the overall allocation is large.
The North-East recorded the lowest utilisation rate at 89.90%, with an unspent amount of ₹2,980 crore against an allocation of ₹29,510.04 crore. The regional differences may be associated with variations in administrative capacity, fund-flow mechanisms, geographical conditions and implementation processes. However, the available expenditure data do not establish direct causal relationships between these factors and the observed utilisation rates.
They should therefore be treated as possible areas for further investigation rather than definitive explanations.
Figure 2. Regional Variation in School Education Budget Utilisation Compared with the National Average, 2018–19 to 2023–24
Source: IISPPR Education Budget Analysis Report, based on secondary data from the Ministry of Education, Government of India, and Union Budget Documents.
State-Level Analysis
The state-level analysis examines education budget allocation, actual expenditure, unspent amounts and spending rates across the ten states included in the dataset. The analysis provides a more detailed view of expenditure performance and helps identify differences between the scale of budgetary allocation and the extent to which allocated funds were converted into actual expenditure.
Uttar Pradesh received the highest allocation among the ten states, amounting to ₹78,315.43 crore, and recorded actual expenditure of ₹70,519.42 crore. This resulted in an unspent amount of ₹7,796.01 crore and a spending rate of 90.05%. Bihar recorded the second-highest allocation of ₹41,995.10 crore and spent ₹37,881.10 crore, resulting in an unspent amount of ₹4,114.00 crore and a spending rate of 90.20%.
Maharashtra recorded a comparatively higher spending rate of 95.07%, with ₹38,927.45 crore spent against an allocation of ₹40,943.99 crore. Among the ten states, Tamil Nadu recorded the highest spending rate at 96.41%, spending ₹22,744.32 crore out of an allocation of ₹23,592.23 crore. Karnataka also recorded a relatively high spending rate of 94.50%, while Gujarat and Andhra Pradesh recorded spending rates of 94.03% and 93.54%, respectively.
The remaining states like West Bengal, Madhya Pradesh and Rajasthan recorded spending rates of 91.69%, 91.76% and 91.31%, respectively. Their expenditure performance therefore remained relatively close to the lower-performing states in percentage terms, although the absolute expenditure gaps varied according to the size of their respective allocations.
Table 2. State-wise Budget Allocation, Actual Expenditure, and Utilisation Rate among the Top 10 States by Budget Allocation, 2018–19 to 2023–24
|
State |
Allocated (₹ crore) |
Actual Expenditure (₹ crore) |
Unspent (₹ crore) |
Utilisation Rate |
|
Uttar Pradesh |
78,315.43 |
70,519.42 |
7,796.01 |
90.05% |
|
Bihar |
41,995.10 |
37,881.10 |
4,114.00 |
90.20% |
|
Maharashtra |
40,943.99 |
38,927.45 |
2,016.54 |
95.07% |
|
West Bengal |
34,006.77 |
31,180.55 |
2,826.22 |
91.69% |
|
Madhya Pradesh |
31,081.78 |
28,521.07 |
2,560.71 |
91.76% |
|
Rajasthan |
30,900.09 |
28,216.18 |
2,683.91 |
91.31% |
|
Karnataka |
25,826.47 |
24,405.03 |
1,421.44 |
94.50% |
|
Tamil Nadu |
23,592.23 |
22,744.32 |
847.91 |
96.41% |
|
Andhra Pradesh |
22,726.43 |
21,259.33 |
1,467.10 |
93.54% |
|
Gujarat |
20,309.34 |
19,097.79 |
1,211.55 |
94.03% |
Source: Ministry of Education, Government of India, Analysis of Budgeted and Actual Expenditure on Education / State-wise education expenditure data, 2018–19 to 2023–24. Calculations by the author based on the reported allocation and actual expenditure figures.
The state-level findings indicate that higher allocation does not necessarily translate into a higher spending rate. Uttar Pradesh, despite receiving the largest allocation, recorded the lowest spending rate among the ten states at 90.05%. In contrast, Tamil Nadu achieved the highest spending rate of 96.41% with a substantially smaller allocation. This demonstrates the importance of considering both the scale of allocation and the proportion of funds actually spent when assessing expenditure performance.
The absolute expenditure gap also provides a different perspective. Uttar Pradesh recorded the largest unspent amount at ₹7,796.01 crore, followed by Bihar at ₹4,114.00 crore. Tamil
Nadu, despite having the highest spending rate, had the smallest absolute unspent amount of ₹847.91 crore. Thus, percentage-based spending performance and the absolute value of unspent funds should be interpreted together rather than treated as interchangeable indicators.
Overall, the ten-state analysis demonstrates considerable variation in education expenditure performance. While most states recorded spending rates above 90%, differences remain in both utilisation levels and the absolute amount of funds left unspent. These variations provide a basis for examining state-level differences in budget execution, while the available expenditure data alone do not establish the specific administrative, institutional or implementation factors responsible for these differences.
Interpretation of Regional and State-Level Findings
The regional and state-level analysis indicates that education expenditure performance is geographically uneven. While some regions and states recorded relatively high utilisation rates, others showed comparatively larger expenditure gaps. The findings also demonstrate that utilisation percentage and absolute expenditure gap capture different dimensions of budget execution.
The North provides a clear example of this distinction at the regional level. Although its utilisation rate was 91.19%, its large allocation resulted in the highest absolute unspent amount among the regions. Similarly, Uttar Pradesh recorded 90.05% utilisation but had an absolute expenditure gap of ₹7,796.01 crore. These findings indicate that assessment of expenditure performance should consider both the proportion of funds utilised and the absolute value of funds remaining unspent.
The findings therefore suggest that budget size alone cannot be treated as an indicator of expenditure performance.At the same time, the dataset is descriptive and does not allow direct causal conclusions regarding why particular regions or states perform differently. Administrative capacity, fund-flow arrangements, procurement processes, geographical conditions and implementation mechanisms may provide areas for further investigation, but establishing their individual effects would require additional data.
School Education Analysis
The analysis of school-education schemes examines the extent to which allocations were translated into actual expenditure across States and Union Territories during 2018–19 to 2023–24. The supplied dataset provides year-wise information on allocation, actual expenditure, expenditure gaps, and utilisation rates for school-education schemes. Across the six-year period, approximately ₹4,98,594 crore was allocated, of which around ₹4,60,005 crore was actually spent. This resulted in an aggregate expenditure gap of approximately ₹38,589 crore, corresponding to an overall utilisation rate of about 92.3%. The figures therefore indicate that while the majority of allocated resources were utilised, complete absorption of the budget was not achieved in any year.
National Variation
The year-wise national school-education series is presented in Table 1. The pattern shows a sustained increase in the scale of school-education financing, although the increase was not accompanied by complete expenditure of the amounts allocated. Allocation rose from ₹68,881.12 crore in 2018–19 to ₹1,07,822.36 crore in 2023–24, an increase of approximately 56.5%, while actual expenditure rose from ₹63,528.79 crore to ₹1,00,549.43 crore, an increase of approximately 58.3%. Nevertheless, actual expenditure remained below allocation in every year, demonstrating that increased budgetary provision did not automatically translate into full budget utilisation.
The most notable deviation occurred in 2020–21. Allocation declined to ₹68,772.37 crore from ₹74,679.94 crore in the preceding year, while actual expenditure fell to ₹61,268.79 crore. Consequently, the expenditure gap increased to ₹7,503.58 crore and the utilisation rate fell to 89.09%, the lowest level recorded during the study period. The supplied analysis associates this period with COVID-19-related disruptions to schooling, construction activities and fund-release procedures. However, the available dataset itself does not establish a causal relationship between the pandemic and the expenditure decline; the COVID-19 period is therefore best treated as an important contextual factor rather than a definitive causal explanation.
Following 2020–21, expenditure performance improved. The utilisation rate increased to 92.86% in 2021–22, remained at 92.69% in 2022–23 and reached 93.25% in 2023–24. Nevertheless, the improvement in percentage utilisation did not eliminate the absolute expenditure gap: in 2023–24, when utilisation reached its highest level, ₹7,272.93 crore still remained unspent. This demonstrates that a higher utilisation percentage does not necessarily imply a smaller monetary gap when the overall budget is expanding.
Regional Variation
The school-education data also reveal substantial regional differences in budget utilisation. The West and South recorded the highest utilisation rates, at 94.71% each, whereas the North-East recorded the lowest rate at 89.90%. The North received the largest allocation among the regions, amounting to ₹1,54,241.76 crore, and consequently also recorded the largest absolute unspent amount of ₹13,583.90 crore despite a utilisation rate of 91.19%. The East recorded a utilisation rate of 90.92%, while the Central region utilised 91.66% of its allocation.
Table 3. Regional Variation in School-Education Budget Utilisation
|
Region |
Allocated (₹ crore) |
Spent (₹ crore) |
Unspent (₹ crore) |
Utilisation Rate |
|
West |
62,417.23 |
59,117.69 |
3,299.54 |
94.71% |
|
South |
1,01,987.79 |
96,588.93 |
5,398.86 |
94.71% |
|
Islands |
647.21 |
603.45 |
43.76 |
93.24% |
|
Central |
43,013.68 |
39,427.84 |
3,585.84 |
91.66% |
|
North |
1,54,241.76 |
1,40,657.86 |
13,583.90 |
91.19% |
|
East |
1,06,776.75 |
97,079.53 |
9,697.22 |
90.92% |
|
North-East |
29,510.04 |
26,530.04 |
2,980.00 |
89.90% |
Source: Researcher’s compilation based on the supplied dataset.
The regional pattern indicates that the size of an allocation alone does not determine expenditure performance. The West and South achieved relatively high utilisation despite substantial allocations, while the North-East recorded the lowest utilisation rate. At the same time, the North’s large unspent amount is partly associated with the scale of its allocation: a moderate difference in utilisation can translate into a considerable monetary gap when the budget base is large. The supplied analysis suggests that differences in administrative capacity, geographical and logistical constraints, and fund-release processes may contribute to regional variation. These factors should, however, be understood as possible implementation-related explanations rather than causal conclusions established by the dataset.
State-Level Variation
State-level figures further demonstrate that high allocations do not necessarily result in proportionately large expenditure gaps, as shown in Table 2. Uttar Pradesh recorded the largest allocation at ₹78,315.43 crore but a utilisation rate of only 90.05%, leaving ₹7,796.01 crore unspent, while Tamil Nadu recorded the highest utilisation rate at 96.41% with an unspent amount of approximately ₹847.91 crore.
The state-level variation reinforces the finding that budget size alone cannot explain expenditure performance. Tamil Nadu, despite receiving a substantial allocation, recorded a high utilisation rate and a comparatively small unspent amount. Conversely, Uttar Pradesh and Bihar recorded considerably larger unspent balances. Given that the ten largest-budget states account for nearly 70% of the total national allocation, their expenditure performance has a significant influence on the overall national gap. Consequently, even incremental improvements in utilisation among large-budget states could reduce the aggregate expenditure gap substantially.
Interpretation of School Education Expenditure
Taken together, the school-education findings point to a persistent budget-to-implementation gap rather than a simple shortage of budgetary allocation. The national trend demonstrates that allocations and expenditure have both expanded, but complete utilisation has not been achieved, and, as shown above, the utilisation percentage and the absolute unspent amount must be read together when the budget base is expanding.
These findings indicate that expenditure planning and monitoring are relevant areas for improving budget absorption, although the data do not allow these factors to be quantified individually or establish direct causality. They should therefore be considered as potential implementation-related explanations that warrant further investigation.
Higher Education Analysis
The analysis of higher education expenditure examines the relationship between Budget Higher Education. Examining these three measures together provides a clearer understanding of how initial budgetary provisions change during the financial year and the extent to which revised provisions are converted into actual expenditure.
Table 4. Higher Education: Budget Estimates, Revised Estimates and Actual Expenditure, 2019–20 to 2023–24
|
Financial Year |
Expenditure Gap (₹ crore) |
Utilisation Rate (%) |
|
2018–19 |
5,352.33 |
92.23 |
|
2019–20 |
5,556.60 |
92.56 |
|
2020–21 |
7,503.58 |
89.09 |
|
2021–22 |
5,819.60 |
92.86 |
|
2022–23 |
7,084.08 |
92.69 |
|
2023–24 |
7,272.93 |
93.25 |
Source: Union Budget/Demands for Grants data compiled in the supplied dataset. The 2023–24 utilisation rate of 125.62% is calculated against the original Budget Estimate. Against the Revised Estimate, utilisation was approximately 96.76%.
The data show considerable variation in higher education expenditure performance over the study period. In 2019–20, the Budget Estimate was ₹38,317.01 crore and actual expenditure stood at ₹36,916.37 crore, resulting in a gap of ₹1,400.64 crore and a utilisation rate of 96.34%. This indicates relatively high budget utilisation during the year.
A substantial decline occurred in 2020–21. The Budget Estimate increased to ₹39,466.52 crore, but the Revised Estimate was reduced to ₹32,900 crore and actual expenditure stood at ₹32,377.76 crore. Consequently, the BE–AE gap increased to ₹7,088.76 crore and the utilisation rate fell to 82.04%, the lowest level recorded during the period. However, the RE–AE gap was considerably smaller at ₹522.24 crore. This difference indicates that the revision of the original budget brought the estimated provision much closer to the eventual level of actual expenditure. In 2021–22, expenditure performance showed some recovery, although it remained below the 2019–20 level. The Budget Estimate of ₹38,350.65 crore was revised downward to ₹36,031.57 crore, while actual expenditure amounted to ₹33,530.91 crore. The BE–AE gap was ₹4,819.74 crore and the RE–AE gap was ₹2,500.66 crore, resulting in a utilisation rate of 87.43%. Thus, although the revised provision was closer to actual expenditure than the original estimate, a notable gap remained between the revised allocation and expenditure.
A stronger improvement was observed in 2022–23. The Budget Estimate and Revised Estimate were both ₹40,828.35 crore, while actual expenditure reached ₹38,556.80 crore. The utilisation rate consequently increased to 94.44%, and the expenditure gap declined to ₹2,271.55 crore. This indicates a substantial improvement in expenditure execution compared with the two preceding years. The 2023–24 figures present a distinct pattern. The initial Budget Estimate was ₹44,094.62 crore, while the Revised Estimate increased substantially to ₹57,244.48 crore. Actual expenditure reached ₹55,392.68 crore. As a result, actual expenditure exceeded the original Budget Estimate by ₹11,298.06 crore, producing a negative BE–AE gap of -₹11,298.06 crore.
However, actual expenditure remained ₹1,851.80 crore below the Revised Estimate. The utilisation rate calculated against the original Budget Estimate was therefore 125.62%, while utilisation against the Revised Estimate was approximately 96.76%. This distinction is important because the latter provides a more appropriate measure of expenditure against the revised provision. The 2023–24 figures demonstrate why the BE–RE–AE relationship is important when interpreting expenditure performance. A comparison based only on the original Budget Estimate would suggest expenditure beyond the initial provision. However, the substantial upward revision means that actual expenditure remained below the revised provision. Therefore, the BE–AE and RE–AE gaps provide different information: the former captures the change from the initial budgetary provision, while the latter provides a clearer indication of expenditure against the revised provision.
Interpretation of Higher Education Expenditure
The higher education analysis demonstrates that budget execution is not a static process. Initial allocations may be revised during the financial year, and actual expenditure may differ considerably from the original provision. The comparison between BE–AE and RE–AE gaps is therefore important for identifying the extent to which budgetary provisions were aligned with expenditure during implementation. The difference between the two measures is particularly evident in years where the Revised estimate was lower than the original Budget Estimate. In such cases, the apparent expenditure gap against the initial provision was substantially reduced when actual expenditure was compared with the revised provision. This indicates that Revised Estimates provide an important intermediate measure for understanding expenditure performance and should be considered alongside the original allocation and final expenditure. The 2023–24 case further demonstrates the importance of considering the entire budget cycle. Actual expenditure was substantially higher than the original BE of ₹44,094.62 crore but remained below the RE of ₹57,244.48 crore. Consequently, interpreting the year solely through the original allocation would present a different picture of expenditure performance than an assessment based on the revised provision.
Overall, the higher education findings indicate that expenditure performance should be assessed through the combined movement of BE, RE and Actual Expenditure. The data show relatively weak utilisation in 2020–21 and 2021–22, followed by improved expenditure execution in 2022–23 and a substantial upward budget revision in 2023–24. These findings provide the basis for the subsequent comparative analysis of school and higher education, where differences in their budget execution patterns can be examined systematically.
Comparative Analysis
National-Level Comparison
The national-level analysis provides the broader context for understanding expenditure patterns across the school education sector. Between 2018–19 and 2023–24, the overall budget allocation increased substantially, while actual expenditure also recorded growth over the same period. However, the increase in actual expenditure did not completely eliminate the gap between the amount allocated and the amount spent. The data therefore indicate that expansion in budgetary provision was accompanied by a persistent, although varying, expenditure gap.
A comparison of annual utilisation rates further shows that budget execution varied across the study period. The utilisation rate declined during the period of disruption and subsequently improved in the later years. The recovery indicates an improvement in expenditure execution, but the continued presence of an expenditure gap suggests that higher allocations alone did not automatically translate into complete absorption of available funds.
The national findings provide an important baseline for interpreting the subsequent regional, state-level, school-education and higher-education results. While the aggregate figures show the overall scale and direction of education expenditure, they do not capture the variation that occurs across different regions, states or subsectors. The subsequent analysis therefore examines whether the national pattern is reflected consistently at these disaggregated levels.
Regional-Level Comparison
The regional comparison confirms the pattern presented in Table 3. Against a national average utilisation rate of approximately 92.3%, the West and South recorded the highest utilisation rates at 94.71% each, followed by the Islands at 93.24%, while the North-East recorded the lowest rate at 89.90%. The difference between the highest and lowest regional utilisation rates is approximately 4.81 percentage points, indicating measurable variation in the ability of regions to convert allocated funds into actual expenditure. The relatively higher performance of the West and South suggests stronger expenditure execution within the dataset, whereas the lower utilisation of the North-East indicates comparatively greater difficulty in absorbing allocated resources.
An important distinction emerges when utilisation rates are considered alongside the absolute amount of unspent funds. The North received the largest allocation of ₹1,54,241.76 crore and recorded a utilisation rate of 91.19%; despite this relatively moderate percentage gap, it had the largest absolute unspent amount of ₹13,583.90 crore. In contrast, the West recorded a higher utilisation rate of 94.71% and an unspent amount of ₹3,299.54 crore. This demonstrates that a relatively small percentage difference in utilisation can translate into a substantial monetary gap when the overall allocation is large.
The North-East presents the opposite pattern. It recorded the lowest utilisation rate at 89.90%, with ₹2,980 crore remaining unspent against an allocation of ₹29,510.04 crore. Thus, while its absolute unspent amount was considerably lower than that of the North, its lower utilisation rate indicates a greater proportional expenditure gap. The supplied analysis associates this regional pattern with factors such as administrative capacity, difficult terrain, logistical constraints and slower fund-release processes. These factors should be treated as possible explanations indicated by the dataset rather than as directly established causal relationships.
The North received the largest allocation of ₹1,54,241.76 crore and, despite a moderate utilisation rate of 91.19%, the largest absolute unspent amount of ₹13,583.90 crore; the West, with a higher utilisation rate of 94.71%, left only ₹3,299.54 crore unspent. A relatively small percentage difference in utilisation can thus translate into a substantial monetary gap when the overall allocation is large.
State-Level Comparison
The state-level findings reinforce the broader pattern observed in the regional analysis: expenditure performance varies across geographical units, and the scale of allocation does not necessarily correspond to higher utilisation. Across the ten states included in the dataset, spending rates ranged from 90.05% in Uttar Pradesh to 96.41% in Tamil Nadu, indicating a difference of approximately 6.36 percentage points.
The state-level comparison reinforces the pattern observed in Table 2: expenditure performance varies across geographical units, and the scale of allocation does not necessarily correspond to higher utilisation. Across the ten states included in the dataset, utilisation rates ranged from 90.05% in Uttar Pradesh to 96.41% in Tamil Nadu, a difference of approximately 6.36 percentage points. Uttar Pradesh, despite receiving the largest allocation, recorded the lowest utilisation rate, while Tamil Nadu achieved the highest rate with a substantially smaller allocation, and Maharashtra combined a large allocation of ₹40,943.99 crore with a comparatively high utilisation rate of 95.07%.
When considered alongside the regional findings, this pattern indicates that expenditure performance cannot be assessed solely on the basis of allocation size or utilisation percentage. Large allocations can produce substantial absolute expenditure gaps even when utilisation remains above 90%, while states with smaller allocations may achieve higher proportional utilisation.
The state-level comparison therefore strengthens the broader finding that budgetary performance is multidimensional. However, the available data remain descriptive and cannot establish why particular states perform differently. Administrative capacity, fund-flow arrangements, procurement processes and implementation mechanisms may provide possible areas for further investigation, but their individual effects cannot be determined from the expenditure data alone.
School Education and Higher Education Comparison
To provide a methodologically consistent comparison, School Education & Literacy and Higher Education are examined using department-level Union Government budget data for the same financial years. The comparison distinguishes between Actual Expenditure (AE), Budget Estimates (BE), and Revised Estimates (RE), rather than treating these measures as interchangeable. For 2022–23, the comparison is restricted to Actual Expenditure because comparable BE and RE figures for both departments are not available in the dataset. For expenditure levels, budget revisions, and expenditure execution.
The comparison is based on the utilisation and expenditure-difference measures defined in the methodology. In particular, BE utilisation is calculated as (AE/BE) × 100, while RE utilisation is calculated as (AE/RE) × 100. These measures allow the execution of the two departments’ budgets to be assessed using the same calculation procedure. However, the results should be interpreted as a comparison of budget execution and expenditure patterns, rather than as a measure or ranking of the relative efficiency or effectiveness of School Education and Higher Education.
Table 5. Comparative Budget Execution of School Education & Literacy and Higher Education, 2022–23 to 2023–24
|
Indicator |
School Education & Literacy |
Higher Education |
|
2022–23 Actual Expenditure (₹ crore) |
58,639.56 |
38,556.80 |
|
2023–24 Budget Estimate (BE) (₹ crore) |
68,804.85 |
44,094.62 |
|
2023–24 Revised Estimate (RE) (₹ crore) |
72,473.80 |
57,244.48 |
|
2023–24 Actual Expenditure (AE) (₹ crore) |
67,792.00 |
55,392.68 |
|
BE Utilisation (%) |
98.53 |
125.62 |
|
RE Utilisation (%) |
93.54 |
96.76 |
|
BE–AE Difference (₹ crore) |
1,012.85 |
−11,298.06 |
|
RE–AE Difference (₹ crore) |
4,681.80 |
1,851.80 |
|
Budget Revision Rate (%) |
5.33 |
29.82 |
Source: Compiled from the department-level Union Government budget data used in the study.
Notes: AE = Actual Expenditure; BE = Budget Estimate; RE = Revised Estimate. BE
Utilisation = (AE/BE) × 100; RE Utilisation = (AE/RE) × 100; BE–AE Difference = BE −AE; RE–AE Difference = RE − AE; Budget Revision Rate = [(RE − BE)/BE] × 100.
The 2022–23 comparison is restricted to Actual Expenditure because comparable BE and RE figures for both departments are not available in the dataset. A negative BE–AE difference indicates that actual expenditure exceeded the original Budget Estimate.
The comparison in Table 7 indicates differences in the scale and execution of Union Government expenditure across School Education & Literacy and Higher Education. In 2022–23, Actual Expenditure was ₹58,639.56 crore for School Education & Literacy compared with ₹38,556.80 crore for Higher Education. Since comparable BE and RE figures for both departments are not available for this year, these figures are interpreted only as differences in actual expenditure and are not used to calculate or compare budget utilisation.
For 2023–24, the availability of BE, RE, and AE permits a more detailed assessment of budget execution. School Education & Literacy recorded an Actual Expenditure of ₹67,792.00 crore against a BE of ₹68,804.85 crore and an RE of ₹72,473.80 crore. This corresponds to a BE utilisation rate of 98.53 per cent and an RE utilisation rate of 93.54 per cent. The positive BE–AE difference of ₹1,012.85 crore and RE–AE difference of ₹4,681.80 crore indicate that actual expenditure remained below both the original and revised provisions.
Higher Education recorded an Actual Expenditure of ₹55,392.68 crore against a BE of ₹44,094.62 crore and an RE of ₹57,244.48 crore. The resulting BE utilisation rate was 125.62 per cent, while RE utilisation was 96.76 per cent. The negative BE–AE difference of ₹11,298.06 crore indicates that actual expenditure exceeded the original budget provision.
However, the subsequent upward revision of the provision resulted in an RE of ₹57,244.48 crore, against which actual expenditure remained ₹1,851.80 crore lower. Thus, the RE utilisation rate provides a more meaningful indication of execution against the revised provision.
The budget revision rates also differ substantially between the two departments. School Education & Literacy recorded a revision rate of 5.33 per cent, whereas Higher Education recorded a revision rate of 29.82 per cent. This indicates a considerably larger adjustment between the initial and revised budget provision in Higher Education during 2023–24.
These results should be interpreted as differences in budget allocation, revision, and expenditure execution, rather than as evidence that one sector is inherently more efficient or effective than the other. The higher BE utilisation rate observed for Higher Education is partly influenced by the substantial upward revision of its original budget provision.
Consequently, RE-based utilisation provides a more comparable indicator of execution once mid-year or subsequent budget revisions are taken into account.
Figure 3. Comparative Budgetary Performance of School Education and Higher Education, 2023–24
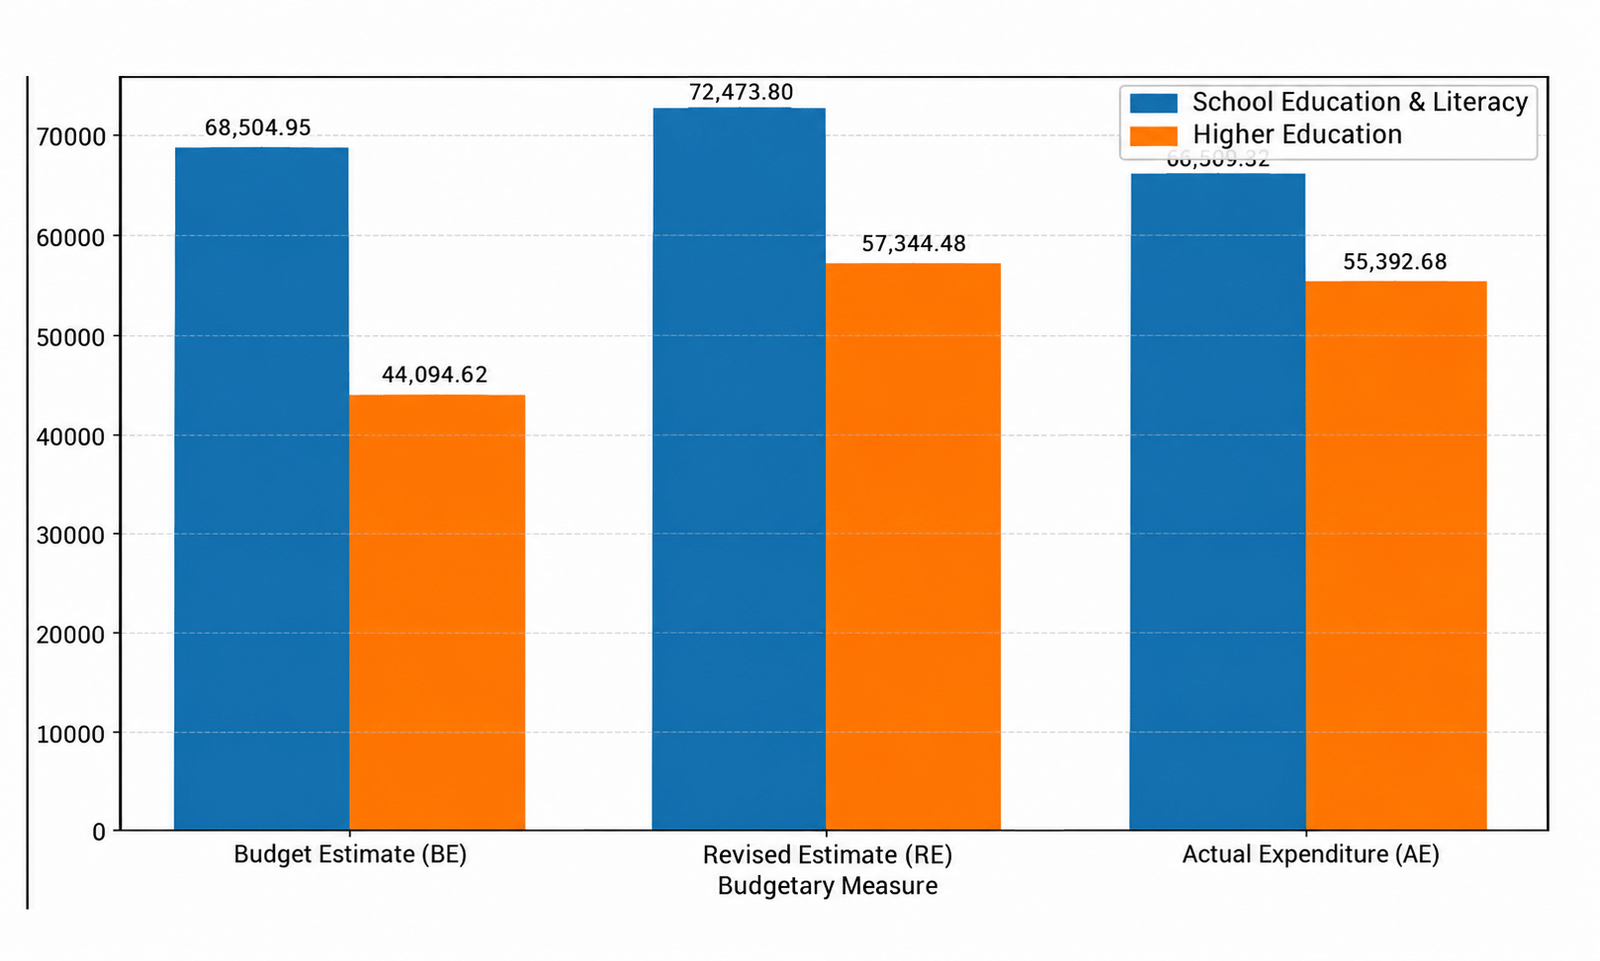
Source: IISPPR Education Budget Analysis Report, based on secondary data from the Ministry of Education, Government of India, and Union Budget Documents.
Allocation Size and Actual Expenditure
The combined findings demonstrate that the size of an education budget does not, by itself, determine how effectively allocated resources are converted into actual expenditure. At the national level, budget allocation increased by approximately 56.5% between 2018–19 and 2023–24, while actual expenditure increased by approximately 58.3%. Nevertheless, a cumulative expenditure gap of approximately ₹38,589 crore remained during the study period.
The same pattern is visible at the regional and state levels. The North received the largest regional allocation of ₹1,54,241.76 crore and recorded the largest absolute unspent amount of ₹13,583.90 crore, despite having a utilisation rate of 91.19%. In contrast, the West and South recorded higher utilisation rates of 94.71%.
At the state level, Uttar Pradesh provides a clear example of this received the largest allocation among the selected states but recorded a utilisation rate of 90.05% and an unspent balance of ₹7,796.01 crore. Tamil Nadu, despite receiving a substantial allocation of approximately ₹23,592 crore, achieved a utilisation rate of 96.41% and had an unspent amount of approximately ₹848 crore.
The comparison therefore suggests that increasing allocations should not be treated as the sole indicator of improved education financing. depends on the extent to which allocated resources are actually converted into programme expenditure. The evidence points towards the importance of examining budget execution, fund flow and implementation capacity alongside the level of financial allocation.
Overall Comparative Findings
The comparative analysis across national, regional, state and subsectoral levels reveals several consistent patterns in education expenditure.
First, education allocations and actual expenditure increased substantially over the study period, but the increase did not eliminate the gap between available resources and actual expenditure. At the national level, allocation increased by approximately 56.5% and actual expenditure by approximately 58.3% between 2018–19 and 2023–24, while a cumulative expenditure gap of approximately ₹38,589 crore remained.
Second, expenditure utilisation varies considerably across geographical units. The West and South recorded the highest regional utilisation rates at 94.71%, whereas the North-East recorded the lowest at 89.90%. At the state level, utilisation among the ten states included in the dataset ranged from 90.05% in Uttar Pradesh to 96.41% in Tamil Nadu. This indicates that expenditure performance is not uniform and that differences persist even among states with substantial budget allocations.
Third, allocation size and utilisation are distinct dimensions of expenditure performance: a relatively high utilisation rate can coexist with a large absolute expenditure gap when the overall budget is large.
Fourth, the direct School Education–Higher Education comparison is restricted to the common 2023–24 department-level BE–RE–AE dataset. Using the same RE-based utilisation measure, School Education and Literacy recorded 93.54% utilisation and Higher Education recorded 96.76%. Higher Education nevertheless underwent a much larger upward budget revision (29.82% compared with 5.33% for School Education), demonstrating why a common BE–RE–AE framework is necessary before comparing expenditure performance.
Finally, the findings suggest that the central issue is not simply the quantum of education funding, but the extent to which allocated resources are translated into actual expenditure across different administrative and geographical contexts. The observed variations point towards the importance of budget-execution processes, fund-flow mechanisms and implementation capacity in understanding expenditure shortfalls. However, the present analysis is descriptive and identifies these as areas for further investigation rather than establishing direct causal relationships.
Taken together, the comparative evidence demonstrates that education financing should be assessed through three interconnected dimensions: the amount allocated, the extent to which the allocation is revised, and the amount ultimately spent. This provides the analytical basis for the subsequent discussion of the findings in relation to the study’s research questions and the broader literature on education financing, governance and implementation.
DISCUSSION OF THE FINDINGS
The findings demonstrate a persistent gap between budgetary allocation and actual expenditure in India’s education sector. At the national level, the school-education schemes dataset shows that allocation increased from ₹68,881.12 crore in 2018–19 to ₹1,07,822.36 crore in 2023–24. Actual expenditure also increased over the period, from ₹63,528.79 crore to ₹1,00,549.43 crore. Despite this growth, actual expenditure remained below allocation in every year, resulting in a cumulative expenditure gap of approximately ₹38,589 crore.
The findings also show that utilisation rate and absolute expenditure gap represent different dimensions of budget performance. National utilisation ranged from 89.09% in 2020–21 to 93.25% in 2023–24. Although 2023–24 recorded the highest utilisation rate in the six-year period, approximately ₹7,272.93 crore remained unspent. This demonstrates that a relatively high utilisation percentage can coexist with a substantial absolute expenditure gap when the overall allocation is large.
The 2020–21 decline represents a notable deviation from the broader trend. Utilisation fell to 89.09% and the expenditure gap increased to ₹7,503.58 crore. The supplied dataset identifies disruptions to school operations, construction activities and fund-release processes during the COVID-19 period as important contextual factors. However, these data do not independently establish causality, and the COVID-19 explanation should therefore be treated as contextual rather than as a statistically established causal relationship.
The regional and state-level findings demonstrate considerable geographical variation in expenditure performance. The West and South recorded relatively high utilisation, while the North-East recorded the lowest regional utilisation rate. At the state level, the ten states included in the dataset also showed substantial variation, with spending rates ranging from 90.05% in Uttar Pradesh to 96.41% in Tamil Nadu. Uttar Pradesh and Bihar additionally recorded large absolute unspent balances of ₹7,796.01 crore and ₹4,114 crore, respectively.
These findings suggest that the size of a budget does not by itself determine expenditure performance. The concentration of large unspent amounts in high-budget states means that improvements in expenditure utilisation among these states could have a significant effect on the overall national expenditure gap. At the same time, the available data do not permit the direct attribution of state-level differences to particular administrative or institutional factors.
Such factors should therefore be treated as potential explanations requiring further investigation. The subsectoral comparison provides an additional perspective on budget execution when the departments are assessed using a common BE–RE–AE framework. In 2023–24, the Department of School Education and Literacy recorded a Budget Estimate (BE) of ₹68,804.85 crore, which was revised upward to ₹72,473.80 crore, while Actual Expenditure (AE) stood at ₹67,792.00 crore. This corresponds to a BE utilisation rate of 98.53% and an RE utilisation rate of 93.54%. Higher Education recorded a BE of ₹44,094.62 crore, which was subsequently revised upward to ₹57,244.48 crore, with AE of ₹55,392.68 crore. Its BE utilisation rate was 125.62%, while RE utilisation was 96.76%. The substantially higher revision in the Higher Education budget, reflected in a budget revision rate of 29.82% compared with 5.33% for School Education and Literacy, indicates a considerably larger adjustment between the original and revised provisions.
The BE-based utilisation rate for Higher Education exceeding 100% requires careful interpretation. Actual expenditure exceeded the original BE of ₹44,094.62 crore by ₹11,298.06 crore; however, the provision was subsequently revised upward to ₹57,244.48 crore. Against this revised provision, actual expenditure remained ₹1,851.80 crore below the RE, resulting in an RE utilisation rate of 96.76%. Therefore, the BE utilisation rate should not be interpreted in isolation as evidence of over-expenditure or weaker budget execution. The RE-based utilisation rate provides a more appropriate indication of expenditure execution against the revised provision after budgetary adjustments have been incorporated.
The comparison also reinforces the importance of distinguishing between the school-education schemes dataset used for the national, regional and state-level analysis and the department-level BE–RE–AE dataset used for the subsectoral comparison. These datasets differ in their unit of analysis, coverage and analytical purpose and are therefore not treated as interchangeable. The former examines expenditure across selected school-education schemes and geographical units over the six-year period, whereas the latter provides a department-level comparison of budget provisions, revisions and actual expenditure for the specified budgetary period. Accordingly, the subsectoral comparison is interpreted as an assessment of differences in budget execution and expenditure patterns rather than as a ranking of the relative efficiency or effectiveness of School Education and Literacy and Higher Education.
Overall, the findings indicate that the central policy issue is not simply the expansion of education allocations, but the extent to which allocated resources are translated into actual expenditure. Budget execution, fund-flow mechanisms, planning, monitoring and implementation capacity therefore remain important areas for further examination. The findings are descriptive and identify these factors as possible areas of explanation rather than establishing direct causal relationships.
POLICY RECOMMENDATIONS
1. Institutionalise a BE-RE-AE based Budget Monitoring.
The Ministry of Education and State Finance Departments can introduce a BE-RE-AE based budget monitoring framework to assess education expenditure as a continuous process of allocation, revision and actual expenditure rather than relying only on the initial Budget Estimate. Each major education programme and state could maintain a budget-execution dashboard reporting BE, RE, AE and utilisation rates on a quarterly or mid-year basis. This would enable policymakers to identify whether expenditure gaps emerge at the initial planning stage, during budget revision, or during implementation. The recommendation is particularly relevant because the study demonstrates that BE and RE can present substantially different pictures of expenditure performance, as observed in Higher Education in 2023-24, where actual expenditure exceeded the original BE but remained below the revised provision.
2. Consider Targeted Budget-Execution Support in High-Budget States.
States with large education allocations and substantial absolute expenditure gaps could be considered for targeted technical support in areas such as expenditure planning, financial monitoring, PFMS use and treasury reconciliation. This suggestion follows from the size of the observed gaps: changes in utilisation among high-allocation states can affect the aggregate expenditure gap. However, the specific causes of state-level expenditure gaps would require further investigation before designing state-specific interventions.
3. Improve Fund Flow, Expenditure Planning and Administrative Processes.
The study identifies timely fund release, expenditure planning, administrative processes and financial monitoring as relevant areas for further investigation. The available data do not establish how much each factor contributes to the observed gaps. Education departments could therefore use advance expenditure plans, improve coordination between Union and State governments, monitor fund-release delays, and align procurement and programme schedules with available budget provisions. Such measures may be particularly useful for programmes involving multiple levels of government, where implementation schedules and fund flows need to remain aligned with the financial year.
4. Strengthen District-Level Monitoring of Education Expenditure.
Financial accountability should be extended beyond the states through stronger district-level expenditure monitoring. State-level figures can sometimes hide problems that occur at the district or implementation level. The literature reviewed for this study points out issues such as unspent balances and weaknesses in financial monitoring at lower administrative levels.
Therefore, regular district-level reviews could track sanctioned funds, releases, expenditure and unspent balances. Periodic independent audits and public disclosure of district-wise unspent amounts would therefore improve transparency and accountability. This recommendation is mainly based on the existing literature and is not a direct finding of the present state and national level data analysis and would require further assessment and targeted intervention at the district level.
5. Develop Separate Budget-Execution Strategies for School and Higher Education.
The government should consider using different approaches for School Education and Higher Education, as their budget structures and implementation processes are different. While School Education involves greater coordination with State Governments and the implementation of centrally sponsored programmes, Higher Education includes universities, centrally funded institutions, research institutions, scholarships and other programmes.
Therefore, School Education could focus more on timely fund transfers, programme implementation and state-level monitoring, while Higher Education could focus on institutional expenditure planning, research and infrastructure spending, scholarships and managing changes in the budget. A differentiated approach would better reflect the specific needs and implementation structures of the two sectors, without assuming that one sector is more efficient than the other.
CONCLUSION
This study began with a simple observation: knowing how much India allocates to school education tells us surprisingly little about how effectively that money is translated into actual expenditure. Over 2018–19 to 2023–24, examining Budget Estimates (BE), Revised Estimates (RE), and Actual Expenditure (AE) together shows why the distinction matters. Allocation, revision, and actual expenditure represent three different stages of the budget process, and each can present a different picture of budget execution.
At the national level, both allocation and actual expenditure increased considerably over the six-year period, but the gap between the two was not eliminated. The cumulative expenditure gap was approximately ₹38,589 crore, with the largest gap occurring in 2020–21 and only partial improvement by 2023–24. Even in 2023–24, when utilisation reached 93.25 per cent, approximately ₹7,272.93 crore remained unspent. The finding highlights an important distinction between relative and absolute budget performance: an increase in the utilisation rate does not necessarily imply that the absolute expenditure gap has been eliminated, particularly when the overall allocation is large.
The regional and state-level findings reinforce this distinction. The analysis shows considerable geographical variation in expenditure utilisation and in the absolute value of unspent funds. The North, despite recording a comparatively strong utilisation rate, accounted for a large absolute unspent balance because of its substantially larger allocation. In contrast, the North-East recorded the lowest regional utilisation rate. At the state level, the findings similarly demonstrate that expenditure performance cannot be assessed from budget size alone. Uttar Pradesh and Tamil Nadu, for example, illustrate differences in utilisation performance, while Uttar Pradesh and Bihar recorded particularly large absolute unspent balances. However, these variations cannot be attributed conclusively to specific administrative or institutional factors using the available aggregate data. The School Education–Higher Education comparison further demonstrates why BE, RE, and AE should be considered together. In 2023–24, School Education & Literacy recorded a BE of ₹68,804.85 crore, an RE of ₹72,473.80 crore, and AE of ₹67,792.00 crore, corresponding to BE and RE utilisation rates of 98.53 per cent and 93.54 per cent, respectively.
Higher Education recorded a BE of ₹44,094.62 crore, which was subsequently revised to ₹57,244.48 crore, while AE stood at ₹55,392.68 crore. This resulted in a BE utilisation rate of 125.62 per cent and an RE utilisation rate of 96.76 per cent. The BE-based figure above 100 per cent should not be interpreted in isolation as evidence of overspending or weaker budget execution. Rather, it indicates that actual expenditure exceeded the original provision, while the subsequent upward revision meant that actual expenditure remained below the revised provision. Considering BE and RE together therefore provides a more complete picture of the budget-execution process.
An important methodological qualification is that the School Education–Higher Education comparison is based on a different dataset from the school-education scheme dataset used for the national, regional, and state-level analysis. The former consists of department-level BE, RE, and AE figures, whereas the latter covers selected school-education schemes and their geographical distribution. These datasets differ in their unit of analysis, coverage, and analytical purpose and are therefore not treated as interchangeable or as one continuous series. The subsectoral comparison is consequently limited to comparable department-level budget execution indicators and should not be interpreted as a ranking of the relative efficiency or effectiveness of School Education & Literacy and Higher Education.
Returning to the three questions that guided the study the size of the BE–RE–AE expenditure gap, the differences in budget utilisation between School Education & Literacy and Higher Education, and the implications of these patterns for implementation—the findings indicate that expenditure execution cannot be understood from the scale of the initial allocation alone. The data point to fund-flow processes, planning, monitoring and implementation capacity as areas for further investigation, but they do not establish these factors as causal explanations.
Future research could therefore move beyond aggregate expenditure patterns by examining state- and district-level implementation, the timing of fund releases, programme-level expenditure, administrative capacity, and educational outputs and outcomes. Such analysis would help determine whether observed expenditure gaps reflect delays in fund flows, implementation constraints, planning weaknesses, or other institutional factors.
Ultimately, this study shifts the question from simply asking how much India allocates to education to asking how much of that commitment is translated into actual expenditure.
The journey from budget announcement to expenditure is an important part of public financial management, and understanding that journey is essential for assessing how effectively public resources are converted into educational provision.
REFERENCES
Centre for Budget and Governance Accountability. (2020). Budgetary analysis of Samagra Shiksha Abhiyan: A case study of two districts in Andhra Pradesh & Uttar Pradesh. CBGA India. https://www.cbgaindia.org/study-report/budgetary-analysis-samagra-shiksha-abhiyan-case-study-two-districts-andhra-pradesh-uttar-pradesh/
Chakrabarti, A., & Joglekar, R. (2006). Determinants of expenditure on education: An empirical analysis using state level data. Economic and Political Weekly, 41(15), 1465–1472. https://www.epw.in/journal/2006/15/special-articles/determinants-expenditure-education.html
Choudhary, J. (2026). Demand for Grants Analysis 2026–27: Education. PRS Legislative Research. https://prsindia.org/files/budget/budget_parliament/2026/DfG_Analysis_2026-27-Education.pdf
Comptroller and Auditor General of India. (2025). Report No. 9 of 2025: Performance audit on implementation of PM POSHAN (including ICDS and Mid-Day Meal Scheme). Government of India. https://cag.gov.in
De, A., & Endow, T. (2008). Public expenditure on education in India: Recent trends and outcomes (RECOUP Working Paper No. 18). Research Consortium on Educational Outcomes and Poverty. https://assets.publishing.service.gov.uk/media/57a08ba0e5274a31e0000c84/WP18-ADfin.pdf
Dubey, M. (2010). The Right of Children to Free and Compulsory Education Act, 2009. Social Change, 40, 1–13. https://doi.org/10.1177/004908570904000102
Department of Higher Education, Ministry of Education, Government of India. (2026). Notes on Demands for Grants, 2026–2027.
Jhingran, D., & Sankar, D. (2009). Addressing educational disparity: Using district-level education development indices for equitable resource allocations in India (World Bank Policy Research Working Paper No. 4955). World Bank.
https://openknowledge.worldbank.org/entities/publication/2cd71d07-a2ab-5d03-bb37-a579ea5fa0a5
Johnson, D., & Parrado, A. (2021). Assessing the assessments: Taking stock of learning outcomes data in India. International Journal of Educational Development, 84, 102409. https://doi.org/10.1016/j.ijedudev.2021.102409
Mehrotra, S. (2011). The cost and financing of the Right to Education in India: Can we fill the financing gap? International Journal of Educational Development, 32, 65–71. https://doi.org/10.1016/j.ijedudev.2011.02.001
Mohanty, R. K., & Bhanumurthy, N. R. (2020). Assessing public expenditure efficiency at the subnational level in India: Does governance matter? Journal of Public Affairs, 21(2), e2173. https://doi.org/10.1002/pa.2173
Motkuri, V., & Revathi, E. (2024). Private and public expenditure on education in India: Trends over last seven decades and impact on economy. Indian Public Policy Review. https://doi.org/10.55763/ippr.2024.05.01.002
Ministry of Education, Government of India. (2022). Analysis of budgeted expenditure on education 2017–18 to 2019–20. https://www.education.gov.in/sites/upload_files/mhrd/files/statistics-new/Analysis_of_Budgeted_Expenditure_on_Education_2018-2020.pdf
Ramanjini, & Gayithri, K. (2023). Is public education expenditure pro-cyclical in India? [Preprint]. Research Square. [https://doi.org/10.21203/rs.3.rs-3457576/v1](https://doi.org/10.21203/rs.3.rs-3457576/v1)
Sinha, J. K. (2025). Efficiency of public education expenditure in India: A stochastic frontier analysis of state-level secondary school completion. Journal of Behavioral Economics and Policy, 1(2). https://doi.org/10.55121/jbep.v1i2.1205
Tilak, J. B. G. (2007). The Kothari Commission and financing of education. Economic & Political Weekly, 42(10). https://www.epw.in/journal/2007/10/special-articles/kothari-commission-and-financing-education.html
Yadava, A. K., & Neog, Y. (2019). Public sector performance and efficiency assessment of Indian states. Global Business Review, 23, 493–511. https://doi.org/10.1177/0972150919862664