Authors:
Daantrana Kakoti, Gargi Shaiju, Gurmeet Kaur, Manvi Jain, Salil Dhyani, Shivani Pawar, Zainab Fatima
Abstract
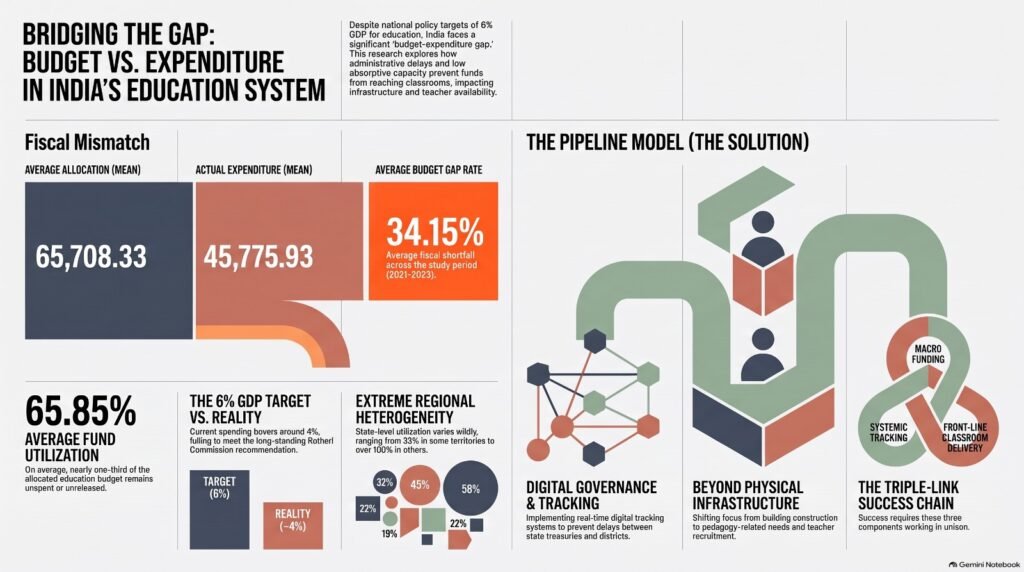
The present study aims to analyze the difference between the budgets allocated and expenditures incurred in India’s education system. It studies the inefficiencies associated with the fund usage that influence critical educational aspects through a quantitative analysis. Contradicting the general belief that increased monetary inputs improve the quality of education, this study attempts to explain the relation between the education budget and its effects on the educational outcomes using a comprehensive “Pipeline” model, which incorporates the digital governance aspect for addressing the issue and thereby making efforts towards the realization of 6% of GDP budget requirement proposed by the Kothari Commission back in 1966.
To the research, the study uses secondary level state data from various sources like PRS India, PFMS, UDISE+, National Achievement Survey, and Indian States Budgets. The association between the budget-expenditure gap and chosen education-sector variables, including school infrastructure, teacher vacancies, and pupil-teacher ratio, was analyzed using pooled regression and Panel Data Fixed Effects approach.
1. Introduction
In emerging countries like India, the distribution of public resources and institutional management are critical in defining the outcome of classrooms, social equality, and perseverance of students. To achieve the objectives of Sustainable Goal, it is important to address the disparities in the education budget, school facilities, as well as institutional management. The central focus of the Literature Review is to address the barriers in the form of learning inequalities through fiscal policies, digital governance issues, and everyday problems at school. It is an attempt to synthesize the current literature pertaining to the three interconnected topics, namely National Education Budget Trends, Digital Governance, and Frontline School Management along with persistent absenteeism. The problem of mismatch between budget allocation and actual expenditure in the Indian education system is an important one, which impacts the quality, availability, and equity of education. Even though the government has invested heavily in the education sector, there are still obstacles to the utilization and implementation of funds that are impeding its impact. The current literature review aims to explore the problem of mismatch between budgeting and expenditure in the education sector through the identification of four major themes.
Policy Targets, Budget Allocation and Expenditure Patterns
Even though policy guidelines set by various commissions such as Kothari Commission (1966) to the current National Education Policy (2020) have advocated for at least 6% of the GDP on education, spending has been much lower. Various authors have noted a gap between budget allocation and education performance because of poor management of funds and implementation challenges. Other researchers have noted that there is a low allocation of GDP towards elementary education. Although there has been an increase in the allocation of funds in the education sector ranging from The Kothari Commission (1966) to The New Education Policy (2020) and the share have gone up to 6% of the total GDP for improving elementary education in India, still there is a continuous gap existing between the public expenditure and learning outcomes, resource formation, and expenditure. Ore allocation of 3% of the total expenditure only on the elementary sector. The traditional educational frameworks believed in the principle that increased expenditure on Education would result in better academic performance. But research studies reveal that the actual expenditure in the education sector is only 4% GDP and 1.5% in the case of elementary education. There is a clear gap between the allocation of funds by the government, expenditure, and achievement in school facilities and learning.
Fiscal Execution and Administrative Challenges
One of the major problems with universal primary education in India is related to the discrepancy between the intended macro-budget allocation for the sector and the actual allocation through State finance mechanisms. While the national-level policy framework stipulates that 6% of the gross domestic product must be spent on education, the actual outcome is far from the target, and elementary education receives an insignificant share of the national income. The macro-budget gap is further aggravated by implementation problems associated with the state and central administration mechanism. Funds allocated do not flow into classrooms because of delay in the allocation of money from state treasuries to district administrations. Thus, the absorptive capacity of states with poor education is restricted. Fiscal implementation emerges from the literature as an issue in the education sector of India. The issue that frequently emerges in the literature is that of a discrepancy between the amount that budgets allocate and the expenditures that occur via the state’s financial and administrative institutions. There may be delays in fund transfer from the state’s treasury to districts and implementation institutions; lack of coordination across different departments; and limited absorptive capability such that sanctioned funds do not reach schools on time. Such problems become especially relevant where administrative capacity is low. An additional allocation of funds, in this context, will not automatically result in an improvement in school infrastructure and classroom delivery. The literature, thus, recognizes a separate stage in the education finance chain process that of fiscal execution. Allocation creates financial capacity while execution determines its effective utilization. There are delays in payment of funds, poor coordination among the administrative departments, and insufficient absorptive capacity in educationally lagging states that hinder the process of utilization of public finance effectively. As a result, despite the increase in budgetary provisions planned, they fail to bridge the gap in infrastructure or classroom facilities.
Infrastructure, Teacher Vacancies, and Learning Outcomes
Public spending on the primary education segment continues to be highly tilted towards the increase in physical capital, thereby leaving out the essential pedagogy-related requirements in the classroom setting. Public expenditure both at the central and state level gets used by centrally sponsored programs, which are mostly inclined towards the construction of school buildings, civil amenities, and welfare. Although these objectives have succeeded in ensuring the growth in physical accessibility and enrollment rates throughout India, the operational issues get neglected. This is because of the existence of chronic teacher shortage problems in states, especially in the densely populated states located in the north and east of the country. The reviewed studies indicate that the allocation of education expenditures is significant. Traditionally, public expenditure has been directed towards physical infrastructure, school buildings, civil infrastructure, and welfare programs. This kind of spending can facilitate increased access and enrolment, yet the absence of infrastructure alone cannot ensure improvement in education outcomes. The problems related to teacher shortage, absenteeism, lack of teaching materials, and poor interaction in classrooms can hinder learning from any capital investments. Hence, the literature review indicates the presence of a connection between spending and outcomes whereby the spending may help build physical infrastructure; however, its impact on literacy, numeracy, attendance and academic success is determined by investments in teachers and teaching process. This is especially important to the current research because it means that the analysis of the budget-expenditure gap should also consider indicators of infrastructure and teacher performance. Chronic teacher vacancies lead to poor levels of literacy and numeracy among students, and thus students shift from government-run schools to cheaper private schools. The research indicates that expenditures have primarily been concentrated on infrastructure as opposed to quality. Teacher absenteeism, which is high in rural areas and poorer states, as well as poor teaching tools and lack of engagement in the classroom, has had negative impacts on literacy and numeracy. Welfare programmed have increased enrollment, but according to the literature, there have been few gains in attendance and learning without effective teacher recruitment and classroom-level activities.
Digital Governance and Post-Pandemic Reform
The government is enhancing the education budget but still cannot satisfy the ground-level needs, The paragraph suggests that budget allocation alone does not serve the purpose, and we need an additional measure to make the whole process more efficient and transparent. Ravselj et al. (2022), based on Public Administration Theory, talks about the need for new digital tools such as tracking systems and online portals. Here, the authors describe the limitations of how people get confused about the concept of Digital Government (only digitizing government operations) and Digital Governance, which leads to fragmentation of public services and inefficiency in their delivery. Digital Governance makes the administration more efficient by changing the relationship between the government and the public. Together, these papers indicate the importance of how the money should reach the required level and become transparent by introducing digital governance frameworks. There have been increasing concerns regarding the role of digital governance in enhancing transparency and accountability in the funding process. The use of digital tracking, online administrative systems, as well as investment in digital learning and teacher training post-pandemic period, are regarded as key initiatives aimed at enhancing fund utilization and accountability. It is, however, stressed that technology reforms must go together with effective fiscal governance. most recent trends in the budget of public education system show a continued recovery of budget
From the declines during the pandemic period, adoption of digital platforms and skill-based learning. The budgetary allocations described in the reviewed literature pertain to the education budget for the Union Government, which went down from ₹99,312 crore to ₹93,224 crore in 2021-22, and further increased to ₹104,584 crore in 2022-23, exceeding ₹1 trillion. When taken collectively, the studies provide different pieces of the puzzle in that expenditure-related literature recognizes the allocation and utilization issue, governance literature describes the means to monitor the issue, while school-based literature justifies the significance of its proper implementation. This increase included the allocation of resources towards digital learning and training of teachers digitally, which went beyond conventional schools.
The key takeaway point from these three different papers on the themes discussed is through the concept of ‘Pipeline’ as it suggests that success in education can be attained only through the formation of a continuous chain in which the following three components play a significant role: Macro level funding, Digital governance (systemic tracking), Front line delivery (teaching at the classroom level). In case any one of these components is missing in the chain, then the whole chain fails. All researchers in all three papers have reached the conclusion that although there has been an increase in the amount of money spent by the government but still the target of allocating 6% of GDP to education has not been fulfilled. The reason behind this is the gap between budgetary funding and teaching at classroom level. From all the studies reviewed, one recurring theme is that increased financial allocations to education are not enough. Good educational results rely on the continuity of a chain starting from the right financial allocations to good financial management, good governance, and finally to proper classroom application.
Research Gap and Future Policy Directions
The extant literature studies aspects such as education budgets, expenditures, infrastructure, teacher shortages and governance, but there is no analysis of the factors mentioned above combined. One of the limitations that should be addressed is that there is a shortage of empirical evidence about the association between disparities in budget allocations and expenditures and chosen school-sector indicators such as school infrastructure, teacher availability, and pupil-teacher ratio. The effectiveness of digital governance and real-time expenditure tracking at the school level is not sufficiently explored. Moreover, there is no adequate comparison of expenditures’ efficiency for States with different levels of fiscal and administrative capacity and different socio-economic conditions. The present research seeks to bridge this gap by investigating the association between the budget-expenditures discrepancy and selected school-sector variables in the States and Union Territories.
2. Methodology:
The research philosophy guiding this study is positivism. The positivist paradigm asserts that knowledge is derived from observable, empirical, and objective phenomena. Given the central question “The Gap Between Allocation and Expenditure in the Indian Education System”, the main discussion of this paper, this study follows a deductive approach. The literature review outlines clear theoretical directions. In this research paper, the methodology, which is explanatory quantitative, is designed to investigate the systematic mismatch between the government budget allocation for education and the actual education expenditure in the Indian education system.
The geographic scope of the study is the Indian continent and its several regions. The targeted population for this research is all the government and government-aided primary and elementary schools across all states and union territories in India. Private and unaided schools fall under the exclusion criteria as they fall outside the scope of public budget expenditure. This study mainly relies on secondary, state-level administrative data. For a comparative analysis of “different administrative capabilities and socio-economic backgrounds”, we have included all 28 States and 8 Indian territories. As secondary administrative data sources, the PRS India budget reports, the Public Financial Management System (PFMS), UDISE+, and the National Achievement Survey are also taken. Another important secondary data sources for this research paper are the Union and State Budget Documents, PRS India Budget Analysis, National Education Policy, and the government and state policy papers. The research focuses on the budget-expenditure gap rate as the major explanatory variable and evaluates its association with three observed school-sector indicators, namely school infrastructure, teacher vacancies, and pupil-teacher ratio. Panel Data Fixed Effects estimate is utilized in this research work to analyze these associations and to manage state-level heterogeneities, (regional administrative disparities). In this methodology, alongside the comparative analysis, both qualitative and quantitative analyses are used. In the research study, diagnostic attention was given to multicollinearity, heteroskedasticity, autocorrelation, and possible endogeneity. Yet, since the panel is only three years long and no identification strategy has been reported, the results are seen as associations and not as causal effects. The research study has realistic limitations includes the lack of standardized quantitative index for digital governance, the time lags between infrastructure development and literacy level improvement. In this research , statistical software such as R and Stata will be used for data analysis ensuring high replicability. This research framework is designed to generate the expected insight about the vital outputs which specifically focuses on budget-expenditure gap’s impact in the Indian education system.
3. Data Analysis
The empirical study explores the relationship between the budget-expended gap and certain selected measures of the school sector’s performance. In particular, the primary independent variable used in this analysis is the budget expenditure gap ratio, whereas the dependent variables include infrastructure, teacher vacancies, and pupil-teacher ratio. The study starts with descriptive statistics and continues with yearly comparisons, correlations, ordinary least squares regressions, and ultimately a two-way fixed effects panel regression.
4. DATA, VARIABLES AND ANALYTICAL FRAMEWORK:
4.1 Data Source and Coverage:
The data, which are used for the analysis, is that of secondary state level administrative panel data. There are 108 state-year observations of 36 States/Union Territories for three financial years. The panel includes three financial years only, which gives it a shorter time dimension. While the dataset comprises 36 States/Union Territories, the time span in hand restricts its ability to track developments across States over a longer period of time. Hence, the econometric findings should be treated with care since these are treated as evidence of association rather than causal effects. The main variables considered for the study are educational allocation, educational expenditures, budget shortfall, budget shortfall percentage, infrastructure variable, and vacancy percentage of teachers and Pupil-Teacher Ratio.
4.2 Data Audit:
|
Item |
Result |
|
Observations |
108 |
|
States/UTs |
36 |
|
Years |
3 (2021, 2022, 2023) |
|
Unique State-year keys |
108 |
|
Duplicate State-year observations |
0 |
|
Teacher vacancy observations |
107 |
|
Attendance observations |
0 |
|
Learning-score observations |
0 |
|
State GDP/control observations |
0 |
|
Infrastructure proxy |
Functional electricity (%) scaled to 0-1 |
Table 2.2 (i): Data Audit Information
4.3 Data Sources:
The data, used for this data analysis, gathered from the Ministry of Education/PRABANDH-PFMS sources for FY2021-22 and PRABANDH state-wise data for FY2022-23 and FY2023-24. Infrastructure and pupil-teacher ratio are drawn from UDISE+-related data, while teacher vacancy is drawn from UDISE+/Ministry of Education teacher-post information
4.3 Variables Used in the Analysis:
|
Variable |
Role |
Definition |
Unit |
Expected Direction |
|
Allocation Education |
Fiscal variable |
Reported education allocation in the gathered data |
Dataset monetary units |
— |
|
Actual Expenditure Education |
Fiscal variable |
Reported expenditure/release measure from the data set is used as the fiscal execution measure and does not assume that it is equal to the budget allocation. |
Dataset monetary units |
— |
|
Budget Gap |
Derived fiscal variable |
Allocation minus actual expenditure |
Dataset monetary units |
— |
|
Budget Gap Rate (%) |
Main explanatory variable |
Budget-expenditure gap relative to allocation |
Percent |
Negative/positive association tested |
|
Infrastructure Index |
Dependent variable |
Electricity-based infrastructure proxy |
0–1 index |
Negative relationship expected |
|
Teacher Vacancy (%) |
Dependent variable |
Percentage of teacher vacancies |
Percent |
Positive relationship expected |
|
Pupil-Teacher Ratio |
Dependent variable |
Number of pupils per teacher |
Ratio |
Positive/negative relationship tested |
Table 4.3 (i): Data of Variables Used in the Analysis
4.4 Descriptive Statistics:
|
Variable |
Mean |
SD |
Min |
Max |
N |
|
Allocation (source units) |
65,708.33 |
112,960.47 |
5.73 |
602,908.74 |
108 |
|
Actual expenditure/release (source units) |
45,775.93 |
106,442.14 |
2.16 |
665,950.99 |
108 |
|
Budget gap rate (%) |
34.15 |
45.25 |
-90.06 |
99.73 |
108 |
|
Utilization rate (%) |
65.85 |
45.25 |
0.27 |
190.06 |
108 |
|
Infrastructure proxy (0-1) |
0.877 |
0.162 |
0.247 |
1.000 |
108 |
|
Teacher vacancy (%) |
13.01 |
12.94 |
0.00 |
71.75 |
107 |
|
Pupil-teacher ratio |
18.12 |
7.40 |
5.75 |
48.75 |
108 |
Table 4.4 (i): Data of Descriptive Statistics
Table presented above summarizes key fiscal and educational variables used in this study. The fiscal levels exhibit very large dispersion, while the gap rate and utilization rate show substantial heterogeneity in execution across State/UT-year observations. The infrastructure variable demonstrates high average value, while the teacher vacancy shows rather wide spread and the pupil-teacher ratio demonstrates significant variability.
|
year |
Mean |
Mean |
Mean |
Mean |
Mean |
Mean |
Mean |
|
2021 |
963.1033 |
690.9211 |
272.182 |
29.959 |
0.863 |
14.25 |
19.46 |
|
2022 |
98047.6697 |
121037.5508 |
-22989.8 |
-9.547 |
0.881 |
13.09 |
18.12 |
|
2023 |
98114.2319 |
15599.3125 |
82514.9194 |
82.030 |
0.886 |
11.63 |
16.76 |
Table 4.4 (ii) Yearly Data of Descriptive Statistics
The mean budget gap rate equals to 34.15 percent. Nevertheless, the standard deviation is considerably higher compared to many of the outcome variables demonstrating considerable dispersion of fund execution. The presence of negative gap rates indicates that, for some State/UT-year observations, the reported expenditure/release measure is higher than the reported allocation. This should not necessarily be interpreted as expenditure exceeding the legally authorized budget provision, since the dataset uses a reported expenditure/release measure. Therefore, negative gap rates are interpreted as instances in which the reported expenditure/release measure exceeds the reported allocation in the available data.
4.5 Year-wise Fiscal and Outcome:
The following table shows the yearly averages of percentage-based fiscal indicators and three observed variables. Analysis and Interpretation. Average gap ratio increases from 29.96 percent in 2021 to -9.55 percent in 2022 and up to 82.03 percent in 2023. On the other hand, the change in percentage-based values is rather modest: Infrastructure proxy increases from 0.863 to 0.886, teacher vacancies decrease from 14.25 percent to 11.64 percent, and pupil-teacher ratio decreases from 19.47 to 16.76 in three periods.
4.6 State-wise Outcome:
|
State Name |
Mean Gap |
Mean Gap Rate |
Mean Utilization |
|
Dadra and Nagar Haveli and Daman and Diu |
3434.86 |
67.9314977 |
32.0685 |
|
Lakshadweep |
222.0767 |
60.9005206 |
39.09948 |
|
Uttarakhand |
21013.1467 |
60.531843 |
39.46816 |
|
Andaman and Nicobar Islands |
2505.9633 |
59.9216885 |
40.07831 |
|
Ladakh |
4779.4333 |
57.1263399 |
42.87366 |
|
Manipur |
10073.6933 |
52.1218558 |
47.87814 |
|
Mizoram |
8941.5467 |
50.040739 |
49.95926 |
|
Delhi |
8492.07 |
48.1233127 |
51.87669 |
|
Himachal Pradesh |
12961.0933 |
46.2018917 |
53.79811 |
|
Uttar Pradesh |
147459.2467 |
44.0792514 |
55.92075 |
|
Arunachal Pradesh |
14979.1567 |
43.9006021 |
56.0994 |
|
Maharashtra |
35401.24 |
42.5309713 |
57.46903 |
|
Sikkim |
2849 |
42.2994596 |
57.70054 |
|
Nagaland |
5717.52 |
41.6512271 |
58.34877 |
|
Tripura |
8577.4733 |
41.3267109 |
58.67329 |
|
Goa |
383.57 |
38.8091055 |
61.19089 |
|
Jammu and Kashmir |
29316.56 |
38.6101682 |
61.38983 |
|
Chandigarh |
4742.36 |
36.6755626 |
63.32444 |
|
Chhattisgarh |
12186.4433 |
36.5447063 |
63.45529 |
|
Andhra Pradesh |
21125.5967 |
33.9970006 |
66.003 |
|
Madhya Pradesh |
76864.2567 |
33.4760118 |
66.52399 |
|
Assam |
50830.3367 |
33.2111025 |
66.7889 |
|
Tamil Nadu |
44054.76 |
29.4173746 |
70.58263 |
|
Karnataka |
12780.9067 |
28.6282988 |
71.3717 |
|
Meghalaya |
8583.6933 |
28.1533789 |
71.84662 |
|
Haryana |
7563.89 |
25.3280275 |
74.67197 |
|
Telangana |
11516.1767 |
25.0507501 |
74.94925 |
|
Gujarat |
19115.04 |
21.4619152 |
78.53808 |
|
Bihar |
80150.8767 |
21.4161904 |
78.58381 |
|
Rajasthan |
43163.6833 |
18.4745179 |
81.52548 |
|
Puducherry |
120.4067 |
11.8252003 |
88.1748 |
|
West Bengal |
11563.7867 |
10.0177242 |
89.98228 |
|
Odisha |
-1153.9233 |
2.5129043 |
97.4871 |
|
Punjab |
-938.87 |
0.7667729 |
99.23323 |
|
Jharkhand |
201.1433 |
0.5593332 |
99.44067 |
|
Kerala |
-2011.5667 |
-4.3086993 |
104.3087 |
Table 4.6 (i): Data of State-wise Outcome
The data on the average gap, gap rate, and utilization rate of each State/UT during the time span under analysis is provided in this table. It can be seen from the analysis above that there were differences in the level of fiscal execution among jurisdictions. Dadra and Nagar Haveli and Daman and Diu had the highest gap rate (67.93%), followed by Lakshadweep (60.90%) and Uttarakhand (60.53%). At the same time, Jharkhand, Punjab, and Odisha had small gaps of 0.56%, 0.77%, and 2.51% correspondingly. There are negative average gaps in Odisha, Punjab, and Kerala, indicating that the reported expenditure/release measure was higher than the reported allocation in the available data. These negative values should therefore be interpreted as differences between the two reported fiscal measures rather than as evidence of expenditure beyond the approved budget.
4.7 Budget allocation over time
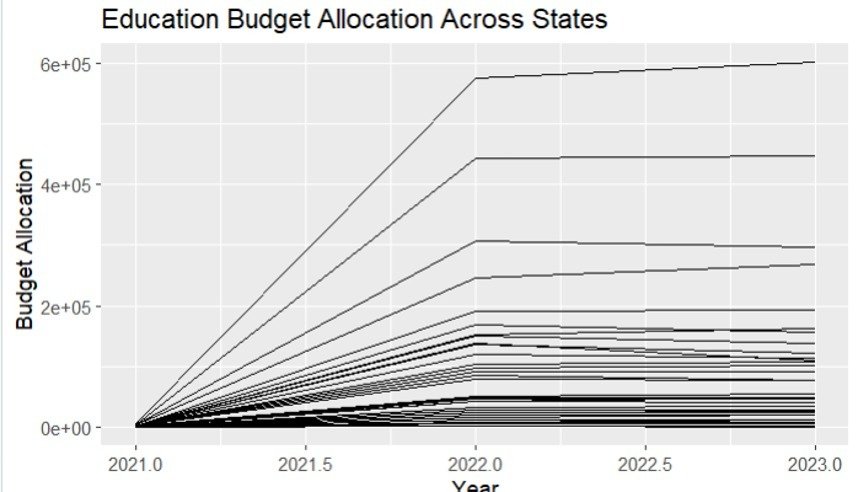
Fig 4.7 (i): Graph of Budget allocation over time
This is a graph shows the pattern of education budget allocation among the States and UTs throughout the study period. There are great variations in the magnitude of education budgeting among various States and UTs. In this figure, one can see a noticeable rise in budget allocation between 2021 and 2022. Post 2022, however, there are relatively no variations in allocations up to 2023. One can see that there is considerable variation among the lines in the figure, and this is due to the variation in the magnitude of education budgeting among the States. While there is variation in the budgeting among the States, this is not about how efficient the funds are being used.
4.8 Education expenditure over time
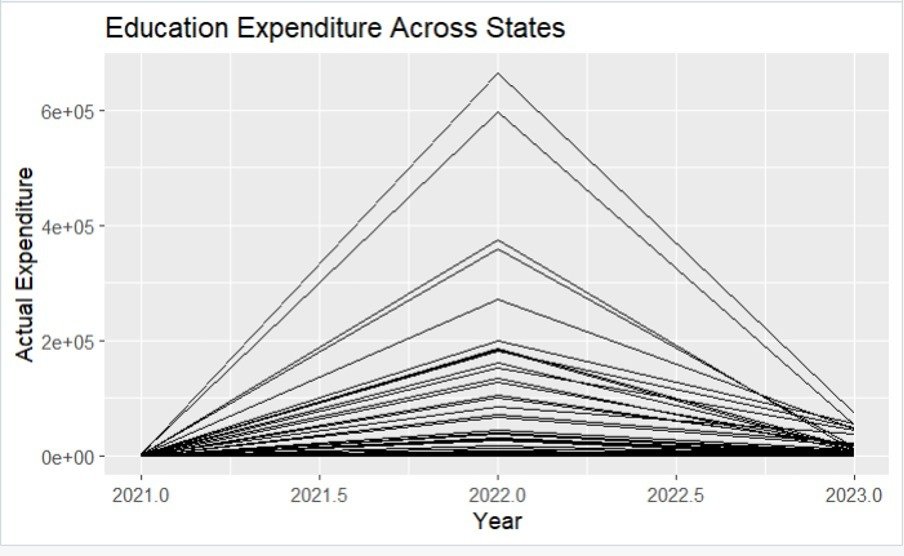
Fig 4.8 (i): Graph Education expenditure over time
From the above graph, there has been an increase in the reported expenditure/release measure in most of the States/UTs in 2022, followed by a decline in 2023. The huge disparity between the States indicates that there have been significant variations in the reported expenditure/release measure across States. The expenditure/release measure should be interpreted separately from budget allocation because the two measures are not equivalent. Nevertheless, caution needs to be taken when interpreting the 2023 figure due to the lack of comparability between the time periods.
4.9 Budget expenditure gap
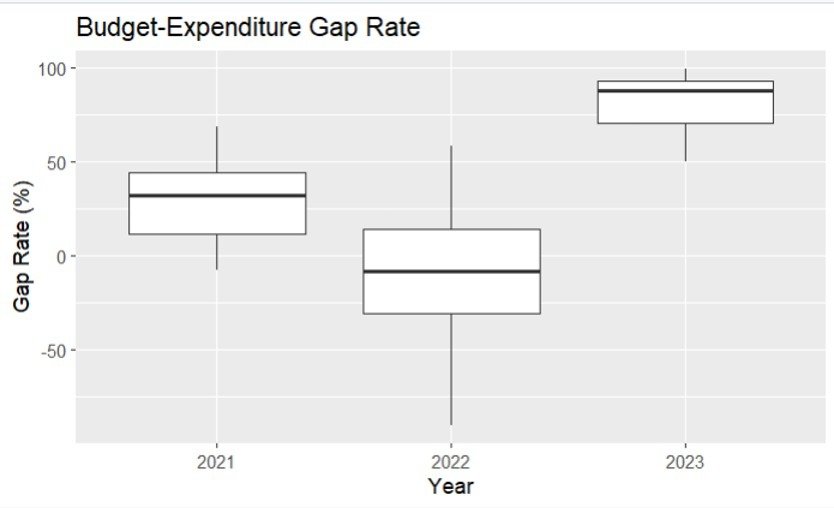
Fig 4.9 (i): Graph of Budget expenditure gap
This figure shows considerable variation in the budget-expenditure gap rate across States and over time. In 2021, the median gap rate is positive, roughly 33%. This means that there is some variance between what is allocated and what has been spent/released. In 2022, the median is negative and there is greater variability in the budget-expenditure gap. In 2023, the median is very high, around 90%, and almost all the States/UTs have high positive gaps. The significant shift in the gap rate in 2023 can be seen with care as there is a lack of comparable data between the reported 2023 and previous periods due to the unavailability of the panel for other than three years. The presence of the 2023 year in the regression is based on the available data, but not time consistency.
4.10 Gap and infrastructure
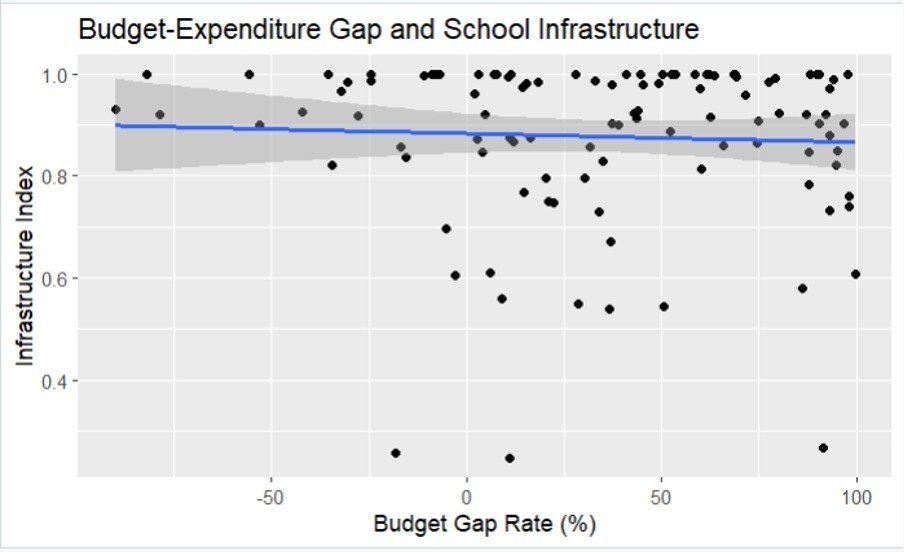
Fig 4.10(i): Graph of Gap and infrastructure
This is the scatter plot between the infrastructure proxy and the budget gap rate. The slope coefficient in the fitted line shows a weak negative relationship but is highly insignificant. This indicates that the variance among the observations is too great to attribute the cross-state variation in the infrastructure proxy to the fiscal gap alone.
4.11 Gap and teacher vacancy
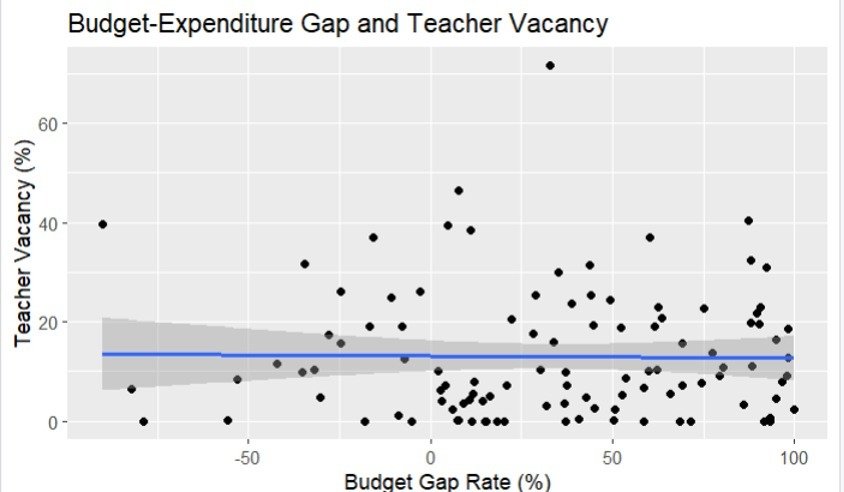
Fig 4.11 (i): Graph of Gap and teacher vacancy
Scatter plot shows the association between budget-gap rate and teacher vacancy.
Visually, the relation is not strong; the observations are spread out over a wide span of teacher vacancy rates. This suggests that staffing outcomes are associated with factors beyond the observed budget gap.
4.12 Gap and pupil-teacher ratio
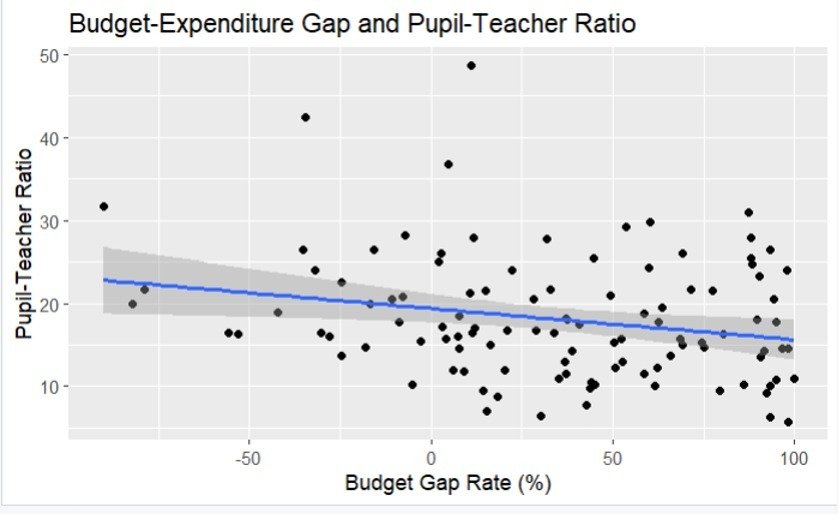
Fig 4.12 (i): Graph of Gap and pupil-teacher ratio
Scatter plot depicts the relationship between the budget gap ratio and teacher-student ratio.
There is a negative and statistically significant relationship between budget expenditure gap rate and pupil teacher ratio based on the pooled regression analysis. However, the relation becomes statistically insignificant after accounting for the fixed effects of State and year.. This indicates that part of the pooled association can be attributed to the differences between States and commonalities within the same year.
Correlation analysis.
|
Budget gap rate pct |
Infrastructure index |
Teacher vacancy pct |
|
|
Budget gap rate pct |
1 |
-0.0571977 |
-0.0147469 |
|
Infrastructure index |
-0.0571977 |
1 |
0.1540058 |
|
Teacher vacancy pct |
-0.0147469 |
0.1540058 |
1 |
|
Pupil teacher ratio |
-0.2365589 |
0.1907746 |
0.3949853 |
Table 4.12 (i): Data of Correlation analysis.
This table presents the correlation between the main fiscal and educational variables.Almost all of the correlations are low. The highest correlation is between the teacher vacancy and the pupil-teacher ratio (r = 0.395), while the other is the weakly negative correlation between the budget-expenditure gap rate and the pupil-teacher ratio (r = -0.237). The negative correlation is in accordance with the direction of the OLS correlation.
5. Key Findings
In general, the results demonstrate considerable heterogeneity in budget execution among States and UTs. The budget-expenditure gap also exhibits considerable variability over time and between jurisdictions, whereas the variance in terms of infrastructure, teacher vacancy, and pupil-teacher ratio is relatively low. The pooled regression results show that there is a negative and significant relationship between the budget gap rate and pupil-teacher ratio; however, this relationship turns to be insignificant when the State-year fixed effects are taken into account. The relationship between the budget gap rate and the proxies for infrastructure and teacher vacancy in pooled regressions is relatively weak. In general, the results suggest that the budget gap rate alone is not sufficient to explain the variation in the selected school-sector indicators, and the observed relationships should be understood as associations rather than impacts.
Conclusion
This study took a look at the money the government set aside for education and how much was actually spent in different states and territories. What they found out was that the amount of money the government said they would spend and the amount they actually spent were not the same. On average, the government said they would spend 65,708.33. The actual amount spent was 45,775.93, which means they only used about 65.85% of the money. This shows that just because the government says they will spend money on education, it does not mean they will actually use it.
There were differences in how much money was spent versus how much was allocated in different states and territories. For example, Dadra and Nagar Haveli and Daman and Diu only used about 32.07% of the money they were given which’s a big difference. On the other hand, Kerala recorded a reported expenditure/release measure corresponding to about 104.31% of the reported allocation. This indicates that the reported expenditure/release measure was higher than the reported allocation in the available data and should not necessarily be interpreted as expenditure beyond the approved budget.
At the time of the study, the analysis did not provide any conclusive proof of the existence of a relationship between the budget gap rate and the chosen indicators of school infrastructure, teacher vacancy, and pupil-teacher ratio. Even though there was a relationship found between the budget gap rate and pupil-teacher ratio in the pooled analysis, it was not statistically significant after controlling for State and year fixed effects. Other variables like administrative issues, staffing conditions, and education programs can also have a relationship with the school sector indicators.
The study says that increasing the education budget is important. It is only part of the solution. There is a difference between how much money is allocated for education and how much is actually used. If the money is not given out on time or not used correctly, the schools may not get better. The study also looked at what other researchers have said. They agree that managing money, governing, using funds on time, hiring teachers, and starting programs at schools are all important for the education budget.
This study has some limitations. It only looked at three years. Did not have all the information needed about things like attendance and test scores. The way they did the study also showed that they did not have a way to measure how well schools use digital tools and that it takes time to see the effects of building new schools on literacy. Future studies can look at years and include more information about how well schools are doing. They can also look at how to make sure money is being used well at schools. Other researchers have said that future studies should look at how the money is being spent and how it affects things like attendance, buildings, and test scores for the education budget.
Overall, the study shows that we should not just look at how much money is allocated for education but also at whether the money is being used well. The difference between the allocated budget and actual spending is one part of understanding how public money is being spent on education. It is not the only thing that affects how well schools do. The release of timely funds, their proper use, and effective management at the school level are also key aspects of enhancing educational performance in all states and union territories.
References
https://journals.sagepub.com/doi/full/10.1177/17577438251331931
https://prsindia.org/files/budget/budget_parliament/2026/DfG_Analysis_2026-27-Education.pdf
https://doi.org/10.54660/.IJMRGE.2026.7.1.382-387
https://ssrn.com/abstract=1414717
https://prsindia.org/budgets/parliament/demand-for-grants-2026-27-analysis-education
https://prsindia.org/budgets/parliament/demand-for-grants-2026-27-analysis-education
https://ssrn.com/abstract=1414717