Authors:
Abhay Goel, Md. Shahanur Hosen, Anisha Tigga, Ashwajit Gaikwad, Dorshita Phukan, Kashvi Bareja, Pushkar Sharma, Shreya Sikdar, Vanshika Jindal
ABSTRACT
Education is a part of the Concurrent List of the Indian Constitution; therefore, it is financed by centre as well as the state governments. However, this budget is not fairly distributed among the states and there are also variations in the amount that states spend. Thus, it is necessary to analyse the allocations by centre to different states and their spending of budget on the school education while paying importance to the issue of north and south divide which prevails within India’s fiscal federalism. The study attempts to assess and generate findings by interconnecting the themes of fiscal federalism in India, structural and institutional capacities of states, educational infrastructure and development, and the impact of Covid 19. The paper presents quantitative, comparative and descriptive-analytical research design using secondary data (2018-2024). Mean, median, minimum, maximum, and standard deviation are used to measure central tendency and variability which are presented through graphical illustrations. It examines allocation and utilization of central government school education budgets across Indian states, state-wise analysis of the ten largest budget states, region wise analysis, comparative analysis of north versus south and the effects of COVID-19 pandemic. The findings reveal that there is a rise of 56.5% in national allocation for school education over six years. Nationally only 92.26% of allocated funds get spent where spending’s of south are 94.71% and north are 91.19%. The northern states like Uttar Pradesh, Bihar have large allocations but a low spending percentage comparatively southern states like Tamil Nadu, Karnataka also have large allocations, but their spending percentages are higher. This indicates that only increase in the school education budget is not sufficient. To improve the educational infrastructure and institutional capacity, efficient utilization of funds should be there while trying to remove the constraint of regional disparity.
Keywords: Fiscal federalism, school education, infrastructure and institutional development, Covid-19 pandemic.
INTRODUCTION
Education is one of those shared responsibilities under India’s federal structure, which falls on the Concurrent List and is financed through a complex interplay of central transfers, state budgets and centrally sponsored schemes. This arrangement reflects that the quality and reach of school education, including classroom to teacher salaries, depends not only on policy design but also on the fiscal architecture used for channelling resources from the union to the states. The graph of budget allocation has increased over time. In 2018-19, the combined allocation across various schemes was about 68,881 crore, which by 2023-24, had climbed to roughly 1,07,822 crore- an increase of more than 56% in six years.
Fiscal Federalism, broadly understood as the division of financial powers and responsibilities across tiers of government, stands as one of the core explanations for why educational outcomes vary so sharply across the Indian states. Structural, institutional, and absorptive capacity are 3 major intersecting concerns that govern the state’s ability to transform fiscal allocation into actual educational outcomes. The formal architecture of the state governance and educational delivery system, the soft architecture of administrative rules and regulatory compliance, and the state’s ability to effectively and efficiently use increments of funding within a given time frame are the criteria that tell us about a state’s overall performance in the field of education (Bhattacharjee et al., 2024).
Various education commissions and policies such as the Kothari Commission (Education Commission, 1966), National Policy on Education (Ministry of Human Resource Development, 1986), and National Education Policy (Ministry of Education, 2020) have recommended the allocation of at least 6 per cent of national income for the provision of public education. The goal of allocating 6 per cent of GDP to education remains unfulfilled to date, in spite of assurances made by various successive governments (Ramanjini and K Gayithri 2023). Over six years, about 4,98,594 crore was allocated for various scheme implementations, and roughly 4,60,005 crore of it was spent. That leaves close to 38,589 crore- about 7.7% of the total amount unused.
The local levels face red tapeism in states that have a highly centralized state house structure for implementing education policies and getting funds cleared. Many states rely heavily on central transfers to fund education, which often come with structural conditionality’s. Poor institutional quality, characterised by corruption, low government effectiveness, or political instability, acts as a direct tax on education spending. Due to weak planning capacity, states often fail to clear technical evaluations, tender bids, or approve school infrastructure projects in the first three quarters of the fiscal year, resulting in an unobservable surplus in the final quarter.
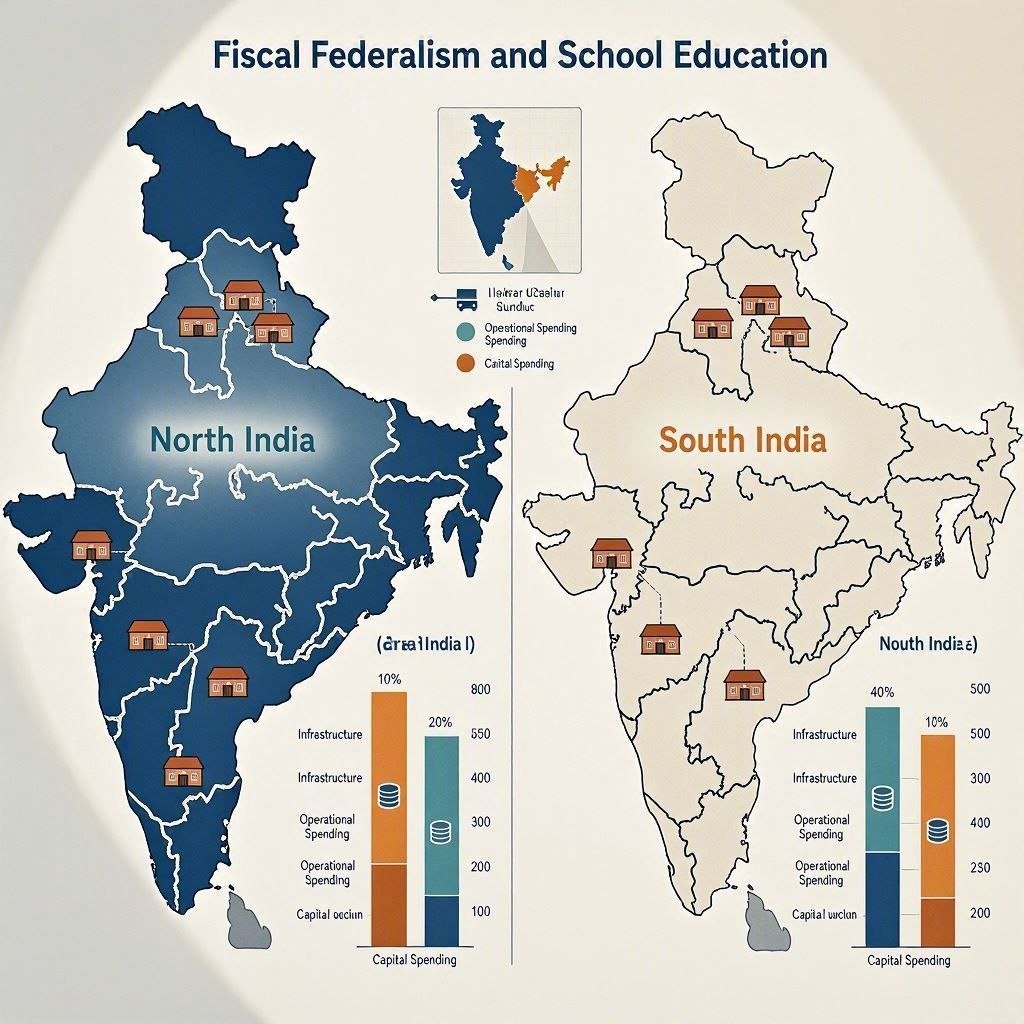
These problems and variations in educational spending are more persistently visible in the divergence between the northern and the southern states. Southern states such as Tamil Nadu and Kerala have historically posted stronger indicators on social infrastructure, teacher-pupil ratios, and learning outcomes, while several northern states continue to lag despite receiving substantial amounts of funds and central transfers (Asadullah & Yalonetzky, 2012). Various reasons, such as differences in state fiscal capacity and administrative efficiency, account for such an existing range.
Existing research highlights that education financing is deeply influenced by fiscal federalism through intergovernmental transfers, centre-sponsored schemes, and tax devolution (Chakraborty, 2019). Prior researchers have examined the impact of state absorptive capacity, education expenditure, administrative efficiency, and both physical and digital infrastructure on improving educational results (Patra et al., 2025; Pritam & Shaikh, 2024; Tripathi & Grigoriadis, 2020) . Moreover, the covid 19 pandemic study revealed that differences in institutional capacity and financial management broadened regional disparities in school education (Bose & Sharma, 2023; Jacob & Chakraborty, 2021).
However, these aspects have been widely studied individually. For instance, literature on fiscal federalism limits itself to defining centre-state fiscal relations and transfer mechanisms, while research on educational infrastructure primarily concentrates on physical facilities, digital access, or learning outcomes. What these studies fail to mention is the correlation between these matters–how the transfer of money directly affects the educational facilities. Similarly, research on absorptive capacity and administrative efficiency elucidates differences in fund utilization without explaining how it impacts the educational infrastructure within this broader framework. Furthermore, despite consistent evidence that northern and southern states vary significantly in their expenditure patterns and educational performance, little comparative analysis combining all these dimensions exists. Therefore, there lies limited understanding.
To address this gap, examining how fiscal federalism influences state spending capacities and how these differences are reflected in educational infrastructure across North and South Indian states becomes crucial. Accordingly, this study seeks to answer how fiscal federalism influences the spending capacities of North and South Indian states, and how differences in spending capacity affect the development of school educational infrastructure.
To support this central question, the study includes research conducted on specific sub-questions, examining how fiscal transfers and spending capacities vary in the northern and southern states of India, and how and to what extent these variations impact the educational infrastructure.
The significance of this study lies in its objective to explore the impact of fiscal federalism on funding for school education, assess the financial capabilities of chosen North and South Indian states, evaluate the condition of educational infrastructure, and analyse how state spending capacity correlates with infrastructural advancement.
LITERATURE REVIEW
The educational expenditure variation and the gap between budget and expenditure is persistently visible in the divergence between the northern and the southern states However, only a few studies have systematically explained how the fiscal federalism framework itself, the scheme design and state’s absorptive capacity contributes to this north south gap. (Chakraborty, 2019; Ramanjini & Gayithri,2023)
This review draws together literature across four interconnected themes to build a comprehensive picture of the problem. It begins with the basic structure of fiscal federalism in India, then turns to the structural and institutional capacities that determine how effectively states convert fiscal transfers into outcomes. It then examines the structural and infrastructural dimensions of educational development. Finally, it provides covid-19 period as a critical test of these fiscal and institutional infrastructure giving meaningful insights into state level resilience and responsiveness
2.1 ARCHITECTURE OF THE FISCAL ECONOMY
The fiscal authority under the Indian Constitution distributes itself across the Union, State and Concurrent List. Particularly since the 80th Constitutional Amendment (2000) has made all central taxes to be shareable, a structural vertical fiscal imbalance has arisen. As of 2021, state governments were responsible for 62.4% of overall government expenditure, while state governments collected 37%(RBI,2024) of all revenues. Therefore, transfers from the Finance Commission, NITI Aayog, and Centrally Sponsored Schemes (CSS) were required to fill this fiscal gap. To varying degrees, the grants, and aid packages, of the 15th Finance Commission, which included revenue deficit grants (2.9 lakh crore), sectoral grants (1.3 lakh crore, education being one of the eight sectors), specific state grants (49,599 crore), and grants to local bodies (4.36 lakh crore), indicates the extent of these transfers. CSS and Central Sector Schemes account for about 30% (Fifteenth Finance Commission,2020) of the total resources transferred to states. As a result of a trade-off designed to achieve horizontal equity with minimal fiscal self-governance, the state of Karnataka, which is one of the industrially developed states, receives 0.15 for every 1 it contributes to the scheme, while the state of Bihar receives 7.06, reflecting the diverge division between the two regions. Reddy (2025) agrees to this pattern, finding that southern states contribute a disproportionately larger share of national tax revenue yet receive comparatively smaller fiscal transfers than several northern states under the Finance Commission’s redistribution criteria.
Chakraborty (2019) argues that though recent reforms like the abolition of the Planning Commission, higher tax devolution and the GST council have strengthened fiscal federalism overall, conditional CSS transfers financed through non-shareable cesses continue to erode state autonomy, even though states fund 85 to 89% of education spending themselves.
Tripathi and Grigoriadis (2020) add that high dependence on Union borrowing, a soft budget constraint, undermines state budget discipline more than transfer dependence alone does, with direct implications for how effectively states implement education budgets.
Reading together, the two studies suggest that transfer design and state-level fiscal discipline are complementary, rather than competing, explanations for uneven education outcomes across states.
2.2 STATE ABSORPTIVE CAPACITY
The way India spends money on education is connected to the overall economy. Ramanjini and Gayithri (2023) find that education expenditure tracks state GSDP cycles closely, with this procyclicality more pronounced in higher education than in school-level funding, suggesting that school education, while somewhat insulated, is not immune to economic downturns. This overall pattern showcases some difference in how well each state can manage its education system.
Singh (2022) in their paper compares Kerala, Maharashtra, and Bihar, finding that Kerala’s strong performance rests on trusted financial commitment, public-private partnership and community trust, as well as a robust State Council of Educational Research and Training (SCERT), while Maharashtra’s gains stem from social schemes and consistent teacher employment. Bihar, by contrast, remains constrained by gender disparities, rural-urban divides, and broader socio-economic underdevelopment.
Khanna (2022) also extends this contrast nationally including southern states like Andhra Pradesh, Karnataka, Kerala, and Tamil Nadu who have consistently spent close to 1% of state GSDP on secondary education, building administrative systems that allow near-complete utilization of allocated funds. On the other hand Northern states such as Uttar Pradesh and Bihar, despite receiving much larger allocations because of being highly populated, show erratic spending and reinvestment often below 0.8% of state wealth, bureaucratic delays account for Uttar Pradesh and Bihar to be responsible for roughly one-third of India’s unspent school funds. Notably, even wealthy state like Gujarat allocates a comparatively small share of its resources to secondary education, underscoring that absorptive capacity reflects administrative effectiveness and political priority as much as fiscal capacity itself.
These distinctions regarding administration and procurement do not exist without any relation to the fiscal transfer system described above, instead they affect how efficiently the same decentralized resources are translated into classrooms, teachers, and schooling, thus connecting institutional capacity directly to the model of fiscal federalism.
2.3 GEOGRAPHICAL AND INFRASTRUCTURAL DEVELOPMENT
In this review, “educational infrastructure” is conceptualized as the sum of three components, physical, human and digital capability which determine the ability of schools to offer education. They include classrooms, electricity, water and sanitation, qualified and adequately staffed teachers, as well as working computers and internet access.
Patra et al. (2025), drawing on data from 670 districts across India, claims that professionally trained faculties, adequate infrastructure, basic school amenities, and student incentives improve enrolment and academic performance. Specifically, classrooms, electricity, drinking water, toilets, functioning school management committees, and school development grants all positively influence outcomes, proving that educational quality other than the funding also depends on physical facilities and institutional support as well.
Digital infrastructure adds a further layer of regional disparity. Pritam and Shaikh (2024), analysing UDISE+ (2021 to 2022) data, find that Kerala, Gujarat, and Punjab report markedly better computer facilities than Bihar, Assam, and Uttar Pradesh, standing proof of the fact that only the provision of computer facilities is insufficient unless they are meaningfully integrated into classroom teaching and are physically functional in ordering to working well.
Notably, Patra et al. (2025) rely on district-level administrative data, whereas Pritam and Shaikh (2024) draw on UDISE+ school-level records, the convergence of findings across these different data sources and units of analysis strengthens confidence that the observed regional gap is not a methodological artefact.
Together, these studies show that infrastructure quality depends on both physical facilities and digital integration, yet regional disparities persist across both dimensions.
2.4 THE COVID-19 PERIOD
The pandemic worked a great deal in highlighting India’s school education gaps. Bose and Sharma (2023) show that when Covid-19 hit the pre-existing shortages in government schools, teacher vacancies, and classroom capacity in Delhi became more evident, and that the share of GSDP that Delhi spends in higher education, is actually less than Kerala and Tamil Nadu. As household incomes fell, families shifted children from private to government schools, sharply raising the demand of public education however the public expenditure did not rise to match the demand, leaving low-income, marginalised and minority children take the hardest hit
N. Singh (2023) notes that as the March 2020 lockdown was imposed with minimal state consultation it led to the disruption of migrant and vulnerable populations severely. With the passage of time, states such as Kerala, Punjab, Odisha, and Rajasthan, along with local governments, took the lead, despite remaining fiscally constrained by delayed Union transfers. This disruption speaks directly to India’s fiscal federalism architecture which accounts for the delayed and reduced transfers from the Union during the pandemic which narrowed the fiscal space available to revenue-dependent states, reinforcing the vertical imbalance identified in the fiscal federalism literature above. Prolonged school closures, among the longest globally, deepened learning losses unevenly across states.
Jacob and Chakraborty (2021) illustrate this strain even in a well-managed state like Karnataka’s public finance for children, in which 15% of total expenditure and 80% directed to education in 2020-21, showed significant gaps between budgeted allocations and actual spending, with the state resorting to expenditure compression despite its otherwise sound fiscal management. Together, these studies suggest Covid-19 functioned as a stress test that sharpened, existing North-South and institutional divergences in Indian school education.
Taken together, the literature reviewed across these four themes converges on one fixed pattern focussing on how southern states outperform their northern counterparts as they combine steadier fiscal commitment with stronger administrative capacity and more resilient infrastructure delivery. Fiscal federalism theory and evidence show that while transfer mechanisms are designed to equalize resources across states, conditional grants and vertical fiscal imbalance still constrains state’s way of expenditure. Institutional capacity and administrative systems determine whether they are effectively utilized. It also explains how physical and digital school facilities influence a state’s performance in education, while the Covid-19 literature shows that this North-South and institutional divergence was sharpened.
Despite the breadth of this literature, a clear gap remains, few studies integrate fiscal capacity, institutional capacity, and infrastructural outcomes within a single comparative framework specific to northern and southern Indian states. Existing work tends to treat these dimensions in isolation and this separation is a conceptual limitation, not just a coverage gap. Fiscal resources without institutional capacity risk underutilization, while strong institutional capacity without adequate resources cannot scale infrastructure, a joint effect that single-dimension studies are structurally unable to capture. This review therefore establishes the theoretical grounding and empirical foundation for the present study, which aims to bridge these gaps by studying how fiscal federalism influences educational infrastructure and spending capacity across northern and southern India.
THEORETICAL FRAMEWORK
The proposed explanation for divergence is based on the theories of fiscal federalism and institutional capacity. First generation fiscal federalism supports decentralization of education to the state level because of allocation function by Musgrave (1959) and Decentralization theorem of Oates (1972). According to these theories, sub-national entities can better coordinate the allocation of expenditure to local needs and preferences that significantly differ among regions in India. Thus, this approach provides a normative basis to compare education outcomes of northern and southern states.
Second generation fiscal federalism (Weingast, 2009; Qian & Weingast, 1997) does not emphasize the efficiency but rather the incentive aspect of education financing scheme. In particular, the theory addresses the ways how the structure of transfer and conditionality’s affect whether states use the allocated funds in a productive way. It helps to explain the reasons behind different outcomes of states with similar allocations like Samagra Shiksha.
Each of these strands alone does not explain how the states that receive similar transfers use them in different ways. The theory of institutional capacity (Evans, 1995; Fukuyama, 2013) can be applied to fill this gap because it suggests that absorptive capacity of the state’s administration serves as a mediator between the fiscal input and infrastructural output.
Integrating these strands, this study proposes the following pathway:
Fiscal Devolution → State Absorptive → Educational Infrastructure Outcomes → Geography and the Covid-19 period act as moderating variables, conditioning how effectively capacity translates into outcomes. This framework moves the analysis beyond descriptive comparison toward explaining divergence through institutional capacity rather than resource volume alone.
METHODOLOGY
1. Research Design
The present study is quantitative, comparative and descriptive-analytical about the research design as it aims at exploring the relationship between the mechanism of fiscal federalism and school education across states in India where the required information on secondary data is compared between Southern India and Northern India mainly in terms of its ability to spend on education as well as its infrastructural ability.
2. Data Sources
The study is based exclusively on secondary data collected from Google Scholar, Shodhganga, ResearchGate, and SSRN. Reports and datasets from NITI Aayog, NIPFP, PRS Legislative Research, Centre for Policy Research (CPR), and Gokhale Institute of Politics and Economics were also taken into consideration. Literature was identified using representative keywords such as “Fiscal Federalism”, “School Education”, “Educational Infrastructure”, “Education Expenditure”, “State Finances”, and “Northern and Southern India”, among others. Studies were selected based on credibility, peer-reviewed status, state-level focus, institutional reliability, and availability of complete data, while duplicate and less relevant studies were excluded.
3. Population and Sample
The population of the study comprises all Indian states with respect to school education and public expenditure. The sample primarily consists of selected Northern and Southern Indian states chosen on the basis of data availability, reliability, and relevance to the objectives of the study.
4. Sampling Technique
A purposive sampling technique was adopted. Since the research relies solely on secondary data, states and datasets were carefully chosen based on the study’s goals, the availability of reliable information, and their suitability for comparing regions.
5. Time Period of Study
The study covers the period from 2018 to 2024. The literature search primarily focused on studies published between 2018 and 2024. However, where recent literature was limited, a few relevant studies published outside this period were included to provide foundational context and ensure a comprehensive analysis.
6. Variables
The study utilised four key variables to assess the spending patterns and implementation of education schemes across northern and southern Indian states. These variables include allocated
- Allocated budget (in crore): In annual financial statement under the scheme forms particular financial year.
- Budget spent (in crore): The actual expenditure incurred by state and union government in particular financial year
- Budget unspent (in crore): The difference between the allocated budget and the budget spent, indicating utilisation.
- Budget utilisation rate (%): Calculated as (Budget Spent ÷ Allocated Budget) × 100, representing the efficiency of fund utilisation.
These variables are used to evaluate the spending capacity of states, budget utilisation efficiency, national spending trends, and regional differences in budget utilisation across northern and southern Indian states.
7. Data analysis technique
The data collected through secondary sources was analysed using Microsoft Excel. For this purpose, mean, median, minimum, maximum, and standard deviation tools were employed to understand central tendency and variability of fund allocation and expenditure across northern and southern states.
Growth rate was analysed to examine changes in allocation and expenditure over the study period.
Coefficient of variation was used to study the variability in National Budget allocation, utilization and expenditure trends during the study period. Higher CV denotes greater variability in the data series observed.
An independent two-sample t-test was conducted to compare the mean budget utilisation rates of northern and southern Indian states.
Pearson’s correlation analysis was carried out to determine the association between budget allocation and budget utilisation rate of the selected states. The strength and direction of relationship were interpreted using the Pearson correlation coefficient [r].
A comparative analysis was conducted between northern and southern Indian states to evaluate differences in budget allocation, expenditure trends, unspent budgets and budget utilisation rates.
These findings were presented through bar graphs and line graphs to illustrate trends, variations, and regional differences in spending and infrastructure.
8. Methodological Limitations
This study is carried out using secondary data and purposive sampling, which may limit the representativeness of the findings. Smaller states and union territories were excluded from certain analyses due to limited data availability. The state specific administrative, political and governance aspects that may influence budget allocation and utilisation, are also not considered. These limitations should be considered while interpreting the findings. A detailed discussion of the limitations is provided in the subsequent section.
DATA ANALYSIS AND INTERPRETATION
This report presents the findings of the study titled “Fiscal Federalism and School Education: A Comparative Study of Educational Infrastructure and Spending Capacities in Northern and Southern India.” The analysis examines the allocation and utilisation of central government school education budgets across Indian states and regions during the period 2018–19 to 2023–24.
During the six years, the Government of India allocated approximately 4,98,594.46 crore towards centrally sponsored school education schemes and programmes. Out of this amount, 4,60,005.34 crore was utilised, hence overall budget utilisation rate was 92.26%, indicating a relatively high level of expenditure despite persistent gaps in fund utilisation.
The findings reveal significant differences in spending efficiency across the regions. The southern states recorded a higher average spending rate of 94.71% than the northern states’ 91.19%, despite receiving comparatively lower budget allocations. These results suggest that the effective use of educational funds depends not only on the amount allocated but also on administrative efficiency and institutional capacity.
1. National Spending Trend, 2018-19 to 2023-24
National allocation for school education schemes grew from 68,881.12 crore in 2018-19 to 1,07,822.36 crore in 2023-24 that is an increase of 56.5% over six years, equivalent to a compound annual growth rate of 9.38%.
Table 1: Education Budget Allocation, Actual Expenditure, Budget Utilization rate (2018-19 to 2023-24)
|
Year |
Allocated ( Cr) |
Spent ( Cr) |
Unspent ( Cr) |
Budget Utilization Rate |
Growth rate of Allocation |
|
2018-19 |
68,881.12 |
63,528.79 |
5,352.33 |
92.23 |
– |
|
2019-20 |
74,679.94 |
69,123.34 |
5,556.60 |
92.56 |
8.42% |
|
2020-21 |
68,772.37 |
61,268.79 |
7,503.58 |
89.09 |
-7.91% |
|
2021-22 |
81,482.23 |
75,662.63 |
5,819.60 |
92.86 |
18.48% |
|
2022-23 |
96,956.44 |
89,872.36 |
7,084.08 |
92.69 |
18.99% |
|
2023-24 |
1,07,822.36 |
1,00,549.43 |
7,272.93 |
93.25 |
11.21% |
Source: Author’ calculation using secondary data published by Government of India
Figure 1: Budget Allocated vs Actual Expenditure (2018-19 to 2023-24)

- Budget allocation rose from 68,881.12 crore in 2018-19 to 1,07,822.36 crore in 2023-24, indicating a steady rise in government investment in school education.
- Actual expenditure closely followed the increase in budget allocation, except during 2020-21, when it declined to 89.09% due to the Covid 19 pandemic.
- The post pandemic period witnessed a gradual recovery in expenditure, with the budget utilisation rate reaching 93.25% in 2023-24, the highest during the study period.
- Even in the most successful year, 7,272.93 crore was unutilised which shows that a structural utilisation gap exists irrespective of external shocks.
Table 2: Descriptive Statistics and Coefficient of Variation of Education Budget Allocation and Expenditure
|
Statistic |
Allocation |
Expenditure |
Unspent |
Spending Rate |
|
Mean |
83,099.08 |
76,667.56 |
6,431.52 |
92.11 |
|
Median |
78,081.09 |
72,392.99 |
6,451.84 |
92.63 |
|
Minimum |
68,772.37 |
61,268.79 |
5,352.33 |
89.09 |
|
Maximum |
1,07,822.36 |
1,00,549.43 |
7,503.58 |
93.25 |
|
Std. Deviation |
16,026.03 |
15,571.67 |
957.88 |
1.52 |
|
Coefficient of Variation (%) |
19.29 |
20.31 |
14.89 |
1.65 |
Source: Author’ calculation using Government data
- The average annual budget allocation and expenditure during the study period were 83,099.08 crore and 76,667.56 crore, respectively, reflecting sustained government spending on school education. Whereas, the coefficient of variation of the same are 19.29% and 20.31% respectively, which reflects changes in annual budgetary priorities and expenditure levels.
- The budget utilisation rate had lowest variation in the given period indicating that despite changes in allocated budget and expenditure; on an average, more than nine-tenths of the allocated funds were utilised in given period.
- Unspent funds recorded a lower coefficient of variation (14.89%), suggesting gap between allocated and utilised funds remained relatively stable across study period.
2. State-wise Analysis: The Ten Largest Budget States
The ten states with the largest school education budgets together account for 70.1% of the entire national allocation. As the largest allocations are concentrated here, spending-efficiency patterns in these ten states substantially determine the national picture.
Table 3: Top 10 States by School Education Budget Allocation
|
State |
Allocated ( Cr) |
Spent ( Cr) |
Unspent ( Cr) |
Spending Rate (%) |
|
Uttar Pradesh |
78,315.43 |
70,519.42 |
7,796.01 |
90.05 |
|
Bihar |
41,995.10 |
37,881.10 |
4,114.00 |
90.2 |
|
Maharashtra |
40,943.99 |
38,927.45 |
2,016.54 |
95.07 |
|
West Bengal |
34,006.77 |
31,180.55 |
2,826.22 |
91.69 |
|
Madhya Pradesh |
31,081.78 |
28,521.07 |
2,560.71 |
91.76 |
|
Rajasthan |
30,900.09 |
28,216.18 |
2,683.91 |
91.31 |
|
Karnataka |
25,826.47 |
24,405.03 |
1,421.44 |
94.5 |
|
Tamil Nadu |
23,592.23 |
22,744.32 |
847.91 |
96.41 |
|
Andhra Pradesh |
22,726.43 |
21,259.33 |
1,467.10 |
93.54 |
|
Gujarat |
20,309.34 |
19,097.79 |
1,211.55 |
94.03 |
Source: Author’ calculation using Government data
Figure 2: Spending rates of Top 10 states over the years 2018- 2024

- Despite of Uttar Pradesh got allocated the largest budget of 78,315.43 crore, the unspent amount was 7,796.01 crore, which is by far the highest for any state and amounting to almost double that of Bihar at 4,114.00 crore; together these two states alone account for a large proportion of the national unspent total.
- Despite receiving comparatively lower budget allocations, Tamil Nadu (96.41%), Maharashtra (95.07%), Karnataka (94.50%), and Gujarat (94.03%) recorded the highest spending rates, indicating more efficient utilisation of allocated funds
- Three of the three southern states i.e. Karnataka, Tamil Nadu and Andhra Pradesh, demonstrate higher spending rates above 93.54%, while northern states in this list come close or below 91-92% further demonstrating the regional static pattern seen in Section 3.
- The findings indicate that budget size alone does not determine expenditure efficiency; effective utilisation depends on the administrative and implementation capacity of individual states.
Figure 3: Relationship Between Budget Allocation and Spending Rate

- The downward sloping trend line indicates a negative relationship between budget allocation and spending rate, indicating states with larger budget allocations tend to have slightly lower spending rates.
- The R² = 0.3581 means that about 35.8% of the variation in spending rate can be explained by differences in budget allocation in this sample.
- Since R² is low, meaning budget size alone does not explain spending efficiency. Other factors such as administrative capacity, governance, and implementation efficiency are also likely to influence fund utilisation.
3. Region-wise Analysis
The Northern, Southern and Eastern regions has the largest school education budgets, followed by Western and Central regions of India. Despite not having a large budget, West still has the highest budget utilisation among all the regions, followed by Southern region.
Table 4: Region wise Budget allocation for Education
|
Region |
Allocated ( Cr) |
Spent ( Cr) |
Unspent ( Cr) |
Spending Rate (%) |
|
West |
62,417.23 |
59,117.69 |
3,299.54 |
94.71 |
|
South |
1,01,987.79 |
96,588.93 |
5,398.86 |
94.71 |
|
Islands |
647.21 |
603.45 |
43.76 |
93.24 |
|
Central |
43,013.68 |
39,427.84 |
3,585.84 |
91.66 |
|
North |
1,54,241.76 |
1,40,657.86 |
13,583.90 |
91.19 |
|
East |
1,06,776.75 |
97,079.53 |
9,697.22 |
90.92 |
|
North-East |
29,510.04 |
26,530.04 |
2,980.00 |
89.9 |
Source: Author’ calculation using Government data
Figure 4: Average spending rate across different regions

- Both West and South are the rare two regions above national average (92.26%) spending rate of 94.71% and 94.71% respectively.
- North East records lowest regional spend rate at 89.90%, while the East also remained below the national average, indicating comparatively lower expenditure efficiency.
- Although the North received the largest budget allocation (1,54,241.76 crore), its spending rate (91.19%) was lower than that of the South, suggesting that higher allocations do not necessarily translate into higher utilisation.
- The sluggish pace of progress isn’t just a single state having one bad year, since this is underperformance across nearly every state in the region rather than an outlier, which suggests more of a structural explanation- smaller management teams; harder logistics in remote or hilly terrain; and slower fund-release paperwork cycles.
4. North vs South: Core Comparative Analysis
The North and South region together has around 50% share of the national education budget, hence it becomes important to study how the budget is being utilised in these particular regions.
Table 5: North vs South- Allocation, spending, and unspent funds
|
Metric |
North |
South |
|
Allocated ( Cr) |
1,54,241.76 |
1,01,987.79 |
|
Spent ( Cr) |
1,40,657.86 |
96,588.93 |
|
Unspent ( Cr) |
13,583.90 |
5,398.86 |
|
Spending Rate |
91.19% |
94.71% |
|
National Allocation Share |
30.94% |
20.46% |
To test the significance of this North-South gap at the individual-state level, the three largest-budget states from each region with individually reported spending rates are compared: Uttar Pradesh, Bihar, and Rajasthan represent the Northern states (n = 3), and Karnataka, Tamil Nadu, and Andhra Pradesh represent the Southern states (n = 3).
Table 6: Descriptive statistics for Northern & Southern states
|
States |
Average Spending Rate |
Average Budget Allocation |
Average Spent Expenditure |
Average Budget Unspent |
|
Northern |
90.52 |
50403.54 |
45538.90 |
4864.64 |
|
Southern |
94.82 |
24048.38 |
22802.89 |
1245.48 |
Source: Author’ calculation using Government data
- The selected southern states recorded a higher average school education budget utilisation rate (94.82%) than the selected northern states (90.52%), despite receiving substantially lower average budget allocations. This indicates that higher budget allocation alone does not guarantee more effective utilisation of educational resources.
- The selected northern states accounted for a larger cumulative school education budget allocation (1,54,241.76 Cr) than the southern states (1,01,987.79 Cr). However, they also recorded considerably higher unspent funds, suggesting relatively lower spending efficiency.
- These findings are consistent with Khanna (2022), who argues that southern states such as Tamil Nadu, Karnataka and Andhra Pradesh have developed stronger administrative systems that enable them to utilise a greater proportion of allocated education funds, whereas northern states often experience implementation delays and lower expenditure efficiency despite receiving larger allocations.
- The results also support the findings of Singh (2022), who attributes Kerala’s stronger educational performance to sustained fiscal commitment, effective institutions and better administrative capacity, while states such as Bihar continue to face socio-economic and institutional constraints that affect education spending.
- From the perspective of fiscal federalism, the findings align with Chakraborty (2019) and Reddy (2025), who argue that although fiscal transfers seek to reduce regional disparities, differences in institutional capacity and state-level implementation continue to influence how effectively education budgets are converted into actual expenditure.
- It also implies that addressing the North-South spending-rate gap, even only in part, would lead to significant reductions in unspent funds overall- simply because of the first fact: a low percentage of a huge number is still quite a lot of money, and North alone accounts for nearly one third of all allocated funds.
- Overall, the North-South comparison suggests that administrative effectiveness, institutional capacity and fiscal governance are as important as the amount of budget allocated in determining school education spending efficiency.
Table 7: Two Sample t-Test comparing the mean school education Budget Utilisation Rates of Selected Northern and Southern States

Source: Author’ calculation using Government data
- The independent two-sample t-test was conducted to examine whether the difference in the average school education budget utilisation rates between the selected northern and southern states is statistically significant.
- The selected southern states recorded a higher mean spending rate (94.82%) than the selected northern states (90.52%), indicating comparatively better utilisation of allocated school education budgets.
- The two-tailed p-value (0.0192) is less than the 5% significance level (p < 0.05), suggesting that the observed difference in the mean spending rates is statistically significant. Therefore, the null hypothesis of no difference between the two regional means is rejected.
- From the perspective of fiscal federalism, the findings align with Chakraborty (2019) and Reddy (2025), who argue that although fiscal transfers aim to reduce regional disparities, differences in state-level administrative capacity and governance continue to influence the effective utilisation of education funds.
5. Top and Bottom Performing States by Spending Rate
In this section the states are ranked purely on the basis of spending rate, independent of their budget sizes. This offers complimentary view to regional analysis.
Figure 5: The five states with the highest and lowest spending rates over the years 2018-19 to 2023-24

- Tamil Nadu, Kerala and Delhi have the top expenditure rates in India, while the lowest performing five regions are Nagaland, Meghalaya, Manipur, Arunachal Pradesh; which are mostly concentrated in the North-East India, as also seen in the regional analysis.
- The gap between the highest-performing state (Delhi, 97.2%) and the lowest-performing state (Nagaland, 87.3%) is approximately 9.9 percentage points, suggesting there is substantial difference in the efficiency with which allocated school education budgets are being used.
- The concentration of lower spending rates among the North-Eastern states is consistent with the regional analysis presented earlier and suggests that geographical location, administrative capacity (high altitude place in remote terrain), and implementation challenges may influence budget utilisation.
6. Effect of COVID-19 Disruption
The trend data for the country is for the FY 2020–21, which marked the first and most severe wave of the COVID-19 pandemic in India (see Figure 1, Section 1). This year’s national spending rate came in at 89.09%, the lowest in the six years of the study, following school closures, a lack of construction activity under these schemes and late delivery of routine paperwork needed for the release of funds.
The recovery was rapid at the national level: By 2021-22 (92.86%) the spending rate had already surpassed the level of 2019-20, and by 2023-24 (93.25%) it reached a six-year high.
- The national recovery was fairly rapid with regional resilience showing significant variation. The low spending rate of the NE region (89.90%) is at the lower end compared to all other regions and very similar to the national spending rate for the COVID year (89.09%), which aligns with literature identifying COVID-19 as a “stress test” that increased existing North-South and institutional capacity gaps instead of causing universally weak one-off performance (Bose and Sharma, 2023; N. Singh, 2023).
- The source data was not available for a detailed, year-by-year regional comparison of the impacts of COVID-19; instead, the source data offers only six-year regional totals. As mentioned in Section 8, this is highlighted as a limitation of the study.
- The national recovery (returning to pre-COVID levels within a year) was relatively quick, suggesting that the downturn in 2020-21 was mainly an operational challenge, rather than a structural reduction in capacity, although it is also evident from Sections 4 and 5 that there is a more persistent structural gap between the regions.
7. Does Budget Size Predict Spending Efficiency?
It is natural to ask whether size of the allocation is also linked to a lower (or higher) spending rate, whether utilisation problems are scale dependent. The correlation coefficient between spending rate and allocation size for the top 10 spending states is r = –0.60 (or R2 = 0.36, with about 36% of the spending rate variation across these top 10 spending states being statistically associated with differences in allocation size).
Figure 6: Allocation Size vs. Spending Rate, Ten Largest-Budget States, with Linear Trend Line (2018-19 to 2023-24)

- A correlation of r = −0.60 means that there is a moderately strong negative correlation: in the states with the highest budgets, there is a tendency for larger allocations to be associated with lower spending rates. This fits an “absorptive capacity” explanation — it implies that some big states have trouble efficiently making use of large education budgets, possibly because their administration isn’t created to spend the whole allocated sum within the spending plan.
- The level of R² (0.36) shows that budget size is not dominant in explaining the variation in spending efficiency widely, other factors like administrative capacity, governance quality, implementation systems also have a role in fund utilization.
- The eastern region and the northern region are represented by the states which have the highest allocations but low spending rates (Bihar and Uttar Pradesh). On the other hand, the states with big allocations and high spending rates are western Maharashtra, and southern Tamil Nadu. This indicates that the size of budgets is not a major factor in influencing utilisation outcomes; rather, it seems to be administrative capacity and institutional systems that play a more significant role, in line with the “state absorptive capacity” concept used in this study (Ramanjini and Gayithri, 2023).
Note: This correlation is presented as indicative only, not statistically definitive, because the number of states represented (n = 10) is small, and only three of the states are from the South and two are from the North, in this particular cut. The state-wise comparison in Section 4, which is based on the entire state population of each region, is the more solid evidence basis in this study for the North-South conclusions.
8. Limitations
- Granularity of data: The analysis was conducted at an aggregated level of the source report with the exception that a disaggregated state-by-state, year-by-year data set for all 28 states and 8 Union Territories individually was not available, so some comparisons were restricted to the ten highest-spending states.
- Regional classification: “North” and “South” is based on the source report’s six-year regional aggregates. A finer zonal classification at the state-level would permit finer distinctions (e.g. using Bihar as a separate case in the eastern region), which utilized herein is a simplification and not meant to replace a fully disaggregated regional taxonomy.
- In Cross-source integration, while several indicators of fiscal federalism discussed in the Literature Review are available from multiple sources, these were not available in a single raw dataset for this analysis (CPR Budget Brief; PRS Legislative Research). Where relevant these indicators are described qualitatively but have not been statistically compared with this study’s budget data.
- The source data only offers regional numbers as a six-year total and therefore does not allow for year-by-year comparisons of the region. The year-by-year comparisons for the region COVID impacts discussed in Section 7 are therefore based on the comparison with the national year-by-year trend, not on a direct year-by-year comparison.
- Provisional 2023-24 figures: The figures for 2023-24 are provisional, and subject to revision in future editions of the source report after the CAG audit.
- Inter-state comparability: There are also a number of states that report on combined central-plus-state spending, and others that report only on the amount of money received from the Centre, as stated in the source report; it is not strictly comparable to compare the education spending rates across all states.
- Delhi: Delhi’s spending rate does not include the amount spent on its state education budgets, which are also large and reported separately; therefore its spending rate is not directly comparable to the combined spending rates of states reporting combined spending.
- Availability of data for Ladakh: There is no separate data available for Ladakh for an earlier period as it was reported along with Jammu & Kashmir till the upgrade of the Union Territory in the end of 2019.
- The sample size for both the state-level North-South correlation (Section 7, n = 10) and the North-South t-test (n = 3 Northern states: Uttar Pradesh, Bihar, Rajasthan; n = 3 Southern states: Karnataka, Tamil Nadu, Andhra Pradesh) is small, and these should not be regarded as statistically significant. The North-South conclusions of this study are drawn primarily from the region-wise comparison, which relies on the full population of states per region.
10. Main Findings
- The school-education scheme budgets have increased significantly over six years, with spending increasing 56.5% over the six years, with the exception of the COVID year (2020-21), when spending was broadly similar.
- The utilisation of the funds for the study period of 6 years during the period of study was 92.26% at national level.
- The North-South divide is evident and, on the available evidence, statistically significant: spending is 94.71% of the total in South, but 91.19% in North, thus producing a share of 35.20% of the national total which is significantly more than would be predicted by that share of national allocation (30.94%).
- The rate of spending in North-East is the lowest of all regions, while all five lowest-performing individual states are in or near this region, suggesting that administrative/logistical capacity is the more probable constraint, not funding.
- Such high spending rates are possible even in high budget states like Tamil Nadu, Kerala and are examples of good administrative performers as mentioned in literature, and may be useful for under-performing states to learn from their utilisation processes (Khanna, 2022).
- There is a moderate negative correlation between budget size and spending rate (r = −0.60) among the largest-budget states, but this seems to be influenced more by region than by budget size. This means institutional and administrative capacity — not fiscal size — is the more clear-cut explanation of spending efficiency variation.
DISCUSSION
The empirical findings clearly answer the core research question, demonstrating that the mechanics of fiscal federalism and variations in state absorptive capacity create a persistent North-South divide in school education financing. Over the six-year period analysed, the Government of India allocated 4,98,594.46 crore toward centrally sponsored school education schemes, yet a substantial structural utilization gap left 38,589.12 crore completely unspent. The data validates the “state absorptive capacity” framework, showing that larger fiscal allocations do not automatically translate into educational spending or improved infrastructure.
This regional disparity is explicitly illustrated by the core comparative analysis between Northern and Southern states:
The Spending Efficiency Gap: Southern states achieved a higher average spending rate of 94.71%, whereas Northern states lagged behind at 91.19%.
The Volume of Unspent Funds: The North received the lion’s share of the national budget (30.94% vs. the South’s 20.46%) but was responsible for a staggering 35.20% of all unspent school funds in India. In stark contrast, the South accounted for just 13.99% of the unspent total.
The Scale of Wastage: For every 100-crore allocated, the North left 8.81 crore unused compared to only 5.29 crore in the South, making the North’s unspent budget per rupee roughly 1.7 times higher than that of the South
These metrics align with the literature review, particularly Khanna (2022), who observed that while Northern states like Uttar Pradesh and Bihar receive massive allocations due to population size, bureaucratic delays and centralized house structures trigger erratic spending. Meanwhile, Southern states like Tamil Nadu (96.41%) and Kerala (96.7%) systematically maximize their funds through streamlined administrative systems and public-private trust. Furthermore, the moderately strong negative correlation (r -0.60) between allocation size and spending rates among the top ten states confirms that expanding financial size without boosting local administrative, technical planning, and tender-bidding capacities only widens the structural implementation bottleneck.
CONCLUSION
This comparative study provides an in-depth, empirical evaluation of how India’s fiscal federalism architecture influences the spending capacities and educational infrastructure development across Northern and Southern states from 2018-19 to 2023-24. By synthesizing fiscal transfer trends with institutional absorptive capacities, the paper bridges a historical gap in literature that previously examined centre-state relations, local physical facilities, and administrative efficiency in isolation.
The findings conclusively demonstrate that while the national allocation for school education grew by a substantial 56.5% over six years-rising from 68,881.12 crore to 1,07,822.36 crore-the actual translation of these resources into institutional outcomes remains deeply constrained by regional disparities. The national average budget utilization rate of 92.26% masks a structural divide where the Northem and North-Eastern states consistently underperform relative to their Southern and Western counterparts. Despite receiving a higher share of the national allocation due to equity-based redistribution criteria, the North’s lower spending rate (91.19%) and its outsized contribution to the nation’s total unspent budget (35.20%) indicate that funding volume alone cannot compensate for deficient governance and weak administrative absorption.
The stress test of the COVID-19 pandemic in 2020-21 further exposed these structural vulnerabilities. The national spending rate dipped to a six-year low of 89.09% due to operational disruptions, prolonged school closures, and delayed paperwork cycles. While the national recovery was rapid-surpassing pre-pandemic levels by 2021-22 and reaching a peak utilization rate of 93.25% in 2023-24-the North-East region and remote Northern territories faced a lagging trajectory, maintaining a six-year Average of just 89.90%. This confirms that external shocks systematically exacerbate pre-existing institutional capacity gaps rather than acting as isolated financial deficits.
Ultimately, this study proves that effective educational delivery relies less on the quantum of central funds transferred and more on a state’s soft architecture of regulatory compliance, technical planning capacity, and localized financial management. Southern states like Tamil Nadu and Kerala succeed because they combine stable fiscal commitment with efficient execution, minimizing unspent surpluses in the final quarter of the fiscal year. To rectify this persistent North-South divergence and upgrade physical and digital school infrastructure nationwide, policy interventions must shift focus from mere financial devolution to aggressive institutional capacity building within underperforming states. Future reforms must streamline the bureaucratic paperwork cycles of Centrally Sponsored Schemes, reduce centralization, and encourage Northern state houses to emulate the highly optimized. localized fund-utilization workflows pioneered in the South.
ACKNOWLEDGEMENT
The authors would like to acknowledge Kanika Agarwal for her valuable contributions to analysing the research data and assisting with the writing and preparation of this research paper.
REFERENCES
[1] Bose, S., & Sharma, H. (2023). Public spending on school education in Delhi: The gaps that Covid-19 highlights (Research Report). National Coalition for Education.
[2] https://nceindia.org.in/wp-content/uploads/2023/03/Executive-Delhi.pdf
[3] Chakraborty, P. (2019, April 2). Fiscal federalism in India: Who should do what? The India Forum. https://www.theindiaforum.in/article/fiscal-federalism-India
[4] Evans, P. (1995). Embedded autonomy: States and industrial transformation. Princeton University Press.
[5] Fukuyama, F. (2013). What is governance? Governance, 26(3), 347–368. https://doi.org/10.1111/gove.12035
[6] Jacob, J. F., & Chakraborty, L. (2021). Public finance for children: The case of Indian State of Karnataka (NIPFP Working Paper No. 355). National Institute of Public Finance and Policy. https://mpra.ub.uni-muenchen.de/109520/
[7] Khanna, P. (2022). Public finance trends and educational implementation across Indian states .https://www.purja.puchd.ac.in/journals/purja-xlix-1-jan-jun22.pdf
[8] Musgrave, R. A. (1959). The theory of public finance: A study in public economy. McGraw Hill.
[9] Oates, W. E. (1972). Fiscal federalism. Harcourt Brace Jovanovich.
[10] Patra, S., et al. (2025). School infrastructure and academic performance: Evidence from 670 districts in India. https://doi.org/10.1177/09737030251346751
[11] Pritam, & Shaikh, R. (2024). Digital infrastructure and regional disparities in Indian schools: An analysis of UDISE+ (2021–2022) data. https://doi.org/10.1007/s44282-024-00087-z
[12] Patra, D., Bharti, N., & Dutta, M. (2025). Are better equipped schools delivering better student outcomes? Evidence from India. Decision, 52(1). https://doi.org/10.1177/09737030251346751
[13] Pritam, B. P., & Shaikh, Z. (2024). Functional integration and utilization of technologies in school education with reference to regional disparity in India. Discover Global Society, 2, 62. https://doi.org/10.1007/s44282-024-00087-z
[14] Reddy, Y. V., Reddy, G. R., & Chakraborty, P. (2025). Indian fiscal federalism (2nd ed.). Oxford University Press. https://doi.org/10.1093/9780198971658.001.0001,.
[15] Qian, Y., & Weingast, B. R. (1997). Federalism as a commitment to preserving market incentives. Journal of Economic Perspectives, 11(4), 83–92. https://doi.org/10.1257/jep.11.4.83
[16] Ramanjini, & Gayithri, K. (2023). Is public education expenditure pro-cyclical in India? (ISEC Working Paper No. 506). Institute for Social and Economic Change. https://www.isec.ac.in/wp-content/uploads/2023/07/WP-506-Ramanjini-and-K-Gayithri Final.pdf
[17] Reddy, K. (2025). Union-State fiscal relations and regional financial disparities in India. https://doi.org/10.1093/9780198971658.001.0001
[18] Singh, B. G. (2022). A comparative study of educational performance in Kerala, Maharashtra, and Bihar.
[19] Singh, N. (2023). Federal dimensions of India’s response to the Covid pandemic: Challenging the idea of the “flailing state.” Indian Public Policy Review. https://ippr.in/index.php/ippr/article/view/164
[20] Tiebout, C. M. (1956). A pure theory of local expenditures. Journal of Political Economy, 64(5), 416–424. https://doi.org/10.1086/257839
[21] Tripathi, P., & Grigoriadis, T. (2020). State capacity and the soft budget constraint: Fiscal federalism, Indian style (SSRN Working Paper No. 3603422). https://doi.org/10.2139/ssrn.3603422
[22] Weingast, B. R. (2009). Second generation fiscal federalism: The implications of fiscal incentives. Journal of Urban Economics, 65(3), 279–293. https://doi.org/10.1016/j.jue.2008.12.005
[23] Asadullah, M. N., & Yalonetzky, G. (2012). Inequality of educational opportunity in India: Changes over time and across states. World Development, 40(6), 1151–1163. https://doi.org/10.1016/j.worlddev.2011.11.008
[24] Sinha, J. K. (2025). Efficiency of public education expenditure in India: A stochastic frontier analysis of state-level secondary school completion. Journal of Behavioral Economics and Policy, 1(2), 45–67. https://doi.org/10.55121/jbep.v1i2.1205
[25] Dahiya, S., James, K., Patel, K., Pathak, A., & Singh, A. (2021). India’s human capital: The regulatory context for leveraging federalism. Indian Public Policy Review, 2(5), 1–33. https://doi.org/10.55763/ippr.2021.02.05.001
[26] Singh, R., Bhattacharjee, S., & Nandy, A. (2024). Fiscal decentralization for the delivery of health and education in Indian states: An ongoing process is more desirable than a policy shift. Journal of Policy Modeling, 46(2), 254–271. https://doi.org/10.1016/j.jpolmod.2024.01.006
[27] Reddy, B. S. (2025). Fiscal federalism of India: Unveiling patterns in North-South financial dynamics. International Journal of Research in Social Sciences and Humanities, 15(2), 5–14. https://doi.org/10.37648/ijrssh.v15i02.002
[28] Kundu, P., & Sonawane, S. (2020). Impact of COVID-19 on school education in India: What are the budgetary implications? Centre for Budget and Governance Accountability (CBGA) & Child Rights and You (CRY). https://www.cbgaindia.org/policy-brief/impact-covid-19-school-education-india-budgetary-implications/
[29] Education Commission. (1966). Education and National Development: Report of the Education Commission (1964–1966) (Kothari Commission Report).
[30] Government of India, Ministry of Education.
[31] Government of India. (1968). National Policy on Education, 1968. Ministry of Education.
[32] Government of India. (1986). National Policy on Education, 1986. Ministry of Human Resource Development.
[33] Government of India. (1992). Programme of Action, 1992. Ministry of Human Resource Development.
[34] Government of India. (2020). National Education Policy 2020. Ministry of Education.