Authors:
Pranav Tolani, Paradhi Wasan, Sahil Vishwasrao Patil, Nimish Gupta, Santosh Maurya, Disha Sarade
INTRODUCTION
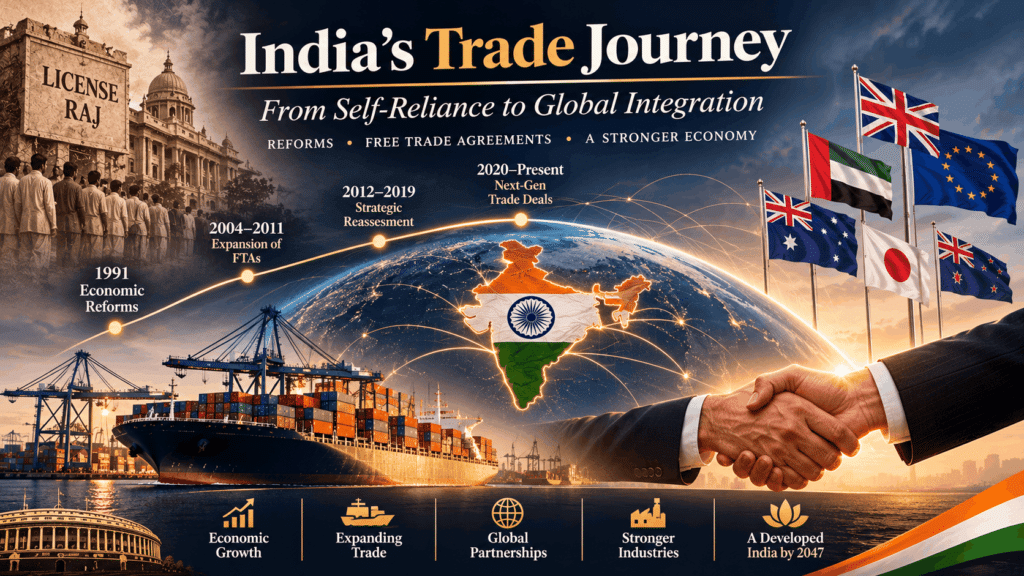
From the beginning of its independence, India kept its economic doors closed. From 1947 until the early 1990s, the country followed a strict policy of self-reliance based on the Nehruvian ideology of “Atmanirbhar Bharat”. Instead of buying goods from other countries, the goal was to produce everything domestically. To enforce this, the government created a system known as the “License Raj,” where businesses needed official permission for almost every decision (Panagariya, 2008). Extremely high taxes on foreign goods, often over 200 per cent and strict rules on foreign money heavily shielded local factories from international competition. Even during this closed era, India was active in global trade platforms.
As a founding member of the General Agreement on Tariffs and Trade (GATT) in 1947, India gained automatic access to Western markets for traditional exports like tea, jute, and textiles (World Trade Organisation [WTO], n.d.). The GATT rules allowed India to protect its “infant” domestic industries while still selling globally. While this approach helped India build its own industrial base, it also meant Indian businesses didn’t have to compete globally, causing them to fall behind in quality and innovation (Bhagwati, 1993).
By the late 1980s, the government was spending far more than it earned, and exports were stagnant. In 1990, the Gulf War caused global oil prices to spike, sharply inflating India’s import bills (Cerra & Saxena, 2002). By June 1991, a severe crisis hit when the country’s foreign exchange reserves dropped to just $1.2 billion, barely enough to buy two weeks’ worth of essential supplies. In a desperate move to secure emergency loans, the government was forced to airlift its gold reserves to European banks (Reserve Bank of India [RBI], 1991). This dramatic crisis forced India to change course entirely.
In 1991, the country launched historic economic reforms, removing trade barriers, welcoming foreign investment, and exposing its local industries to global market forces (Ahluwalia, 2002). Today, the gamble of opening up has paid off on a massive scale. India is now the world’s sixth-largest economy, driving a significant portion of global growth (World Bank, 2023). However, the country is currently performing a delicate balancing act. On one hand, it wants to deeply integrate with the world through free trade agreements. On the other hand, it is pushing for strategic self-reliance through the “Atmanirbhar Bharat” initiative to strengthen local manufacturing (Ministry of Finance, 2020). This balance is being tested by the results of India’s past trade agreements with partners like ASEAN, South Korea, and Japan (NITI Aayog, 2022).
While these deals boosted overall trade volumes, they also led to growing trade deficits, meaning India buys much more from these countries than it sells to them (Saraswat et al., 2022). Yet, there is a silver lining, as many of the goods India imports are parts and raw materials that local factories use to build finished products, which actually helps domestic manufacturing grow.
Learning from these past experiences, India has shifted its strategy. Since 2020, the country has been signing modern trade deals with nations like the UAE and Australia, and European countries (EFTA) (Ministry of Commerce and Industry, 2024). These new agreements serve as a roadmap to navigate global challenges and help India reach its goal of becoming a fully developed nation by 2047.
However, despite becoming a global economic powerhouse, the benefits of opening up the economy have not been shared equally. Trade agreements have affected different sectors in different ways, creating a significant divide between the success of services and manufacturing. While India has expanded its global footprint and attracted massive foreign investment, the country still struggles to use its resources efficiently. These critical bottlenecks widen trade deficits and hold back the creation of domestic jobs, resulting in an uneven impact on employment, investment, and the environment (Goldar & Mitra, 2021).
To assess the utility and impact of these Trade agreements, this research aims to explore India’s trade journey by focusing on the following goals:
- To trace the history and evolution of India’s trade agreements, highlighting how policies and economic phases have changed over time.
- To understand how these agreements have impacted the Indian economy, specifically looking at jobs, industry sectors, foreign investment, and import-export trends. 3. To compare India’s early trade deals with its recent agreements to identify shifts in the country’s strategic focus.
- To highlight the specific opportunities and challenges that these trade agreements create for different parts of the economy.
- To provide practical recommendations on how India can make its future trade agreements more successful.
To achieve these goals, this paper will seek to answer the following questions:
- How have changes in India’s trade policies since 1947 shaped its economic stability, its distribution of resources across industries, and its overall economic growth? 2. How has India’s strategy for negotiating trade deals evolved since the 1991 economic liberalisation, and what are its current priorities?
- What are the main roadblocks currently preventing India from getting the most out of its trade agreements, and what policy changes could solve these issues?
LITERATURE REVIEW
Policy Interventions & The LPG Framework
In India, Jagdish Bhagwati and T. N. Srinivasan highlighted the severe efficiency costs of the “License Raj,” with Bhagwati’s “Directly Unproductive Profit-Seeking” (DUP) framework showing how strict quotas and licensing prioritised bureaucratic rent-seeking over industrial innovation (Bhagwati, 1982; Bhagwati & Srinivasan, 1975). They advocated replacing quantitative restrictions with transparent tariffs and market-driven exchange rates to eliminate distortions, boost labour-intensive export employment, and emulate East Asia’s export-led growth (Bhagwati & Srinivasan, 1993).
In July 1991, the government introduced the “New Economic Policy (NEP)”, dismantling the structural components of the inward-looking trade model through three main pillars: Liberalisation, Privatisation, and Globalisation. These reforms aimed at removing state-directed barriers to production, pricing, and trade by abolishing industrial licensing for all but 18 strategic, social, or environmental sectors, removing asset limits for large companies under the Monopolies and Restrictive Trade Practices (MRTP) Act, compressing tariffs by 150%, and abolishing quantitative restrictions by incentivising retention of30 out of the earnings from exports (Joshi & Little, 1996; Panagariya, 2004). The government also initiated a phased disinvestment program for public sector undertakings (PSUs) to encourage financial discipline and private sector participation (Mohan, 2005). The Reserve Bank of India (RBI) adjusted the external value of the Indian Rupee downward by a cumulative18 % to 20% against major currencies (US Dollar, Pound Sterling, Deutsche Mark, Japanese Yen) to correct the overvalued rupee and the government established an automatic approval route for foreign equity investments up to $51 per %of dollar in 34 high-priority manufacturing and infrastructure industries (Ahluwalia, 2002; Reserve Bank of India [RBI], 1991).
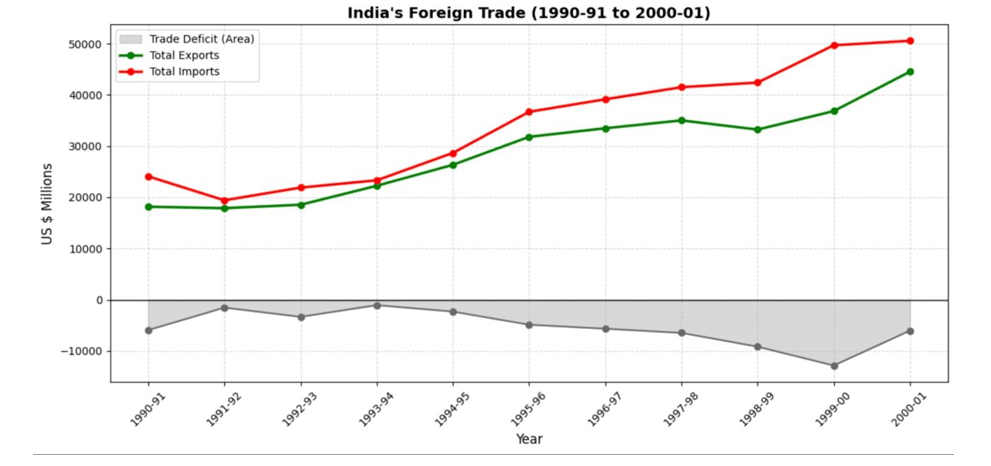
Fig.1: Trends in India’s Exports, Imports, and Trade Deficits (1990-91 to 2000-01)
In the decade following the 1991 reforms, the nation’s export trajectory experienced an extraordinary surge as per Fig. 1; total export value rose from US$ 18.4 billion in 1990-91 to US$ 44.6 billion by 2000-01, representing a phenomenal 142% expansion (Reserve Bank of India, 2001). Simultaneously, the macroeconomic recovery was underscored by the real GDP growth rate, which rebounded from a precarious 1.1% in 1991-92 to a robust 7.3% by 1995-96 (Ministry of Statistics and Programme Implementation & World Bank, 1996).
India’s FTA Architecture
Today, India participates in 28 active trade agreements, consisting of 22 active FTAs and 6 PTAs deals to connect with the global economy. Historically, India approached these agreements with caution, prioritising partners in Southeast and East Asia. However, the results have been mixed:
while these deals provided market access, they often led to India importing more than it exported, causing persistent trade deficits. This suggests that past strategies focused too heavily on connectivity rather than competitiveness; future success likely depends on shifting from simply signing agreements to strengthening local manufacturing so that India can better compete on the global stage.
Phase-1 (2004-2011) The Birth of Indian FTA’s
During 2004–2011, India rapidly expanded bilateral trade agreements and Foreign Trade policies to boost market access and global economic integration. Recognising the need for trade partners to secure preferential treatment for its goods, India utilised trade agreements to foster these strategic friendships and enhance global integration.
1.1 India-Singapore CECA (2005)
The India-Singapore Comprehensive Economic Cooperation Agreement (CECA) was signed on June 29, 2005, by Prime Minister Manmohan Singh and Singapore’s Prime Minister Lee Hsien Loong, coming into effect on August 1, 2005, making it India’s first-ever comprehensive trade deal (Ministry of External Affairs [MEA], 2005; Press Information Bureau [PIB], 2005). The agreement was designed to strengthen economic ties between the two countries by covering a wide range of areas, reducing import duties on over 5,100 products, opening doors for professionals in IT and finance to work across borders, protecting investments, simplifying customs procedures, and building cooperation in healthcare, education, and science (Indian Trade Portal, 2005; Nishith Desai Associates, 2005; JMC Trade Initiatives, 2005). The economic impact was significant: bilateral trade grew more than five times, from USD 6.7 billion in 2004-05 to USD 35.5 billion by 2024-25, and Singapore rose from outside India’s top ten trading partners to become its sixth largest (Directorate General of Commercial Intelligence and Statistics [DGCI&S], 2025). More importantly, Singapore became India’s single biggest source of foreign investment, pouring in USD 171.9 billion between 2000 and 2024, nearly 24% of all foreign investment India received, flowing primarily into services, software, infrastructure, and telecom (Department for Promotion of Industry and Internal Trade [DPIIT], 2024).
1.2 South Asian Free Trade Area (SAFTA) (2006)
The South Asian Free Trade Area (SAFTA) was signed on January 6, 2004, at the 12th SAARC Summit in Islamabad by eight South Asian nations: India, Pakistan, Bangladesh, Sri Lanka, Nepal, Bhutan, the Maldives, and later Afghanistan, which came into effect on January 1, 2006 (Wikipedia, 2006; CHEMEXCIL, 2006; MEA, 2006). The agreement aimed to boost trade among neighbouring countries by gradually reducing import duties on goods to between 0% and 5%, while allowing each nation to protect sensitive domestic industries through exclusion lists. However, it covered only goods trade, leaving out the fast-growing services sector entirely (United Nations, 2006; CHEMEXCIL, 2006; Political Science Institute, 2006). The economic impact has been largely disappointing as intra-SAARC trade remains stuck at roughly 5% of the region’s total trade, far behind ASEAN’s 25% or the EU’s 60%, with total regional trade at only about USD 40 billion against an estimated potential of USD 67 billion (World Bank, 2018). Deep-rooted barriers have held the agreement back: India-Pakistan political tensions effectively froze bilateral trade, which collapsed from USD 2.5 billion to near zero after 2019, while lengthy sensitive lists, slow border procedures, and poor transport infrastructure continue to prevent the
region from realising its vast trade potential (DGCI&S, 2019; Indian Institute of Import Export Management [IIIEM], 2019; Carnegie Endowment, 2019; Observer Research Foundation [ORF], 2019; World Bank, 2019).
1.3 India–ASEAN FTA (2009)
The ASEAN-India Trade in Goods Agreement (AITIGA) was signed on August 13, 2009, in Bangkok between India and the ten ASEAN member nations, entering into force on January 1, 2010, as part of India’s broader effort to deepen ties with Southeast Asia under its Look East Policy (Association of Southeast Asian Nations [ASEAN], 2010). The agreement sought to boost trade by removing or reducing import duties on over 90% of product lines, fully eliminating tariffs on about 80% and lowering them to 5% on another 10%, while a separate services and investment agreement signed in 2014 completed the partnership’s three pillars (Ministry of Trade and Industry [MTI], 2014; IMPRI, 2014; ASEAN, 2014). The economic results were mixed: total bilateral trade nearly tripled from USD 45.3 billion before the agreement to USD 123.1 billion by 2024-25, but India’s trade deficit with ASEAN grew nine times, from USD 5 billion to a staggering USD 45.2 billion, driven by a surge in palm oil, electronics, and chemical imports, alongside structural problems like inverted duties that made Indian manufacturing uncompetitive, and concerns over Chinese goods entering India through ASEAN at preferential rates (DGCI&S, 2025; Department of Commerce, 2025; Hindustan Times, 2025; Global Trade Research Initiative [GTRI], 2026; Delhi Policy Group, 2025).
1.4 India–South Korea CEPA (2010)
The India-South Korea Comprehensive Economic Partnership Agreement (CEPA) was signed on August 7, 2009, by Prime Minister Manmohan Singh and South Korean President Lee Myung-bak, becoming effective on January 1, 2010 (PIB, 2010). The agreement aimed to deepen bilateral ties beyond goods by encompassing services, investment, telecommunications, and professional mobility. India agreed to reduce or eliminate tariffs on about 85% of Korean goods over ten years, while South Korea committed to liberalising 90% of Indian goods (Indian Trade Portal, 2010). Economically, the results are double-edged: bilateral trade surged from roughly USD 12 billion to USD 26.9 billion by FY2025, but India’s trade deficit exploded to USD 15.3 billion due to structural imbalances and low FTA utilisation by Indian exporters (Directorate General of Foreign Trade [DGFT], 2025). However, the agreement successfully catalysed massive foreign direct investment, with South Korea pouring nearly USD 5.9 billion into India, driving the creation of sprawling manufacturing hubs and thousands of jobs by corporate giants like Samsung, Hyundai, and Kia.
1.5 India–Japan CEPA (2011)
The India-Japan Comprehensive Economic Partnership Agreement (CEPA) was signed on February 16, 2011, by Prime Minister Manmohan Singh and Japanese Prime Minister Naoto Kan, and took effect on August 1, 2011 (PIB, 2011). Driven by a desire to balance regional influence and cement a strategic partnership, the agreement aimed to abolish tariffs on over 94% of traded items over a decade. Japan offered immediate zero-duty access to 87% of Indian goods, while India provided similar access to 17.4% of Japanese goods, shielding sensitive domestic sectors like agriculture (PIB, 2011). Economically, the trade outcomes were underwhelming: bilateral trade reached USD 27.47 billion by FY2026, but strict Japanese non-tariff barriers and low exporter awareness led to a widening USD 15.39 billion trade deficit against India (DGCI&S, 2026; IIM Bangalore, 2026). However, the agreement catalysed transformative investment, with Japan pouring USD 43.36 billion into India. Over 1,400 Japanese companies established operations, while Japanese capital financed monumental infrastructure projects like the Delhi Metro and High-Speed Rail (DPIIT, 2026; Japan International Cooperation Agency [JICA], 2026).
Phase-2 (2011–2019): The Great Pause and Reassessment
2.1 The Great Pause
After partnering aggressively with Singapore, ASEAN, South Korea, and Japan, India came to a halt. For the next decade, the country did not sign a single major comprehensive trade agreement. This period is referred to by many economists as India’s era of “FTA Fatigue.” Policymakers realised that the trade deals signed were benefiting the global countries unilaterally instead of benefiting India bilaterally. The agreements made it easier for foreign countries to sell their goods in India, rather than helping Indian businesses sell abroad, resulting in India’s trade deficits beginning to widen at an alarming rate. The government faced a manufacturing dilemma, identifying two major roadblocks that were hurting the domestic economy. First was an “inverted duty structure”, where India was charging higher import taxes on raw materials than on finished foreign products. This made it cheaper for companies to just import finished goods rather than manufacturing them domestically, directly impacting local factories. Second, the Rules of Origin, rules for proving where a product was actually made, were complex and expensive for indian manufactures, especially for MSME’s. This resulted in indian manufactures not utilising trade deal benefits to their advantage. Learning from these setbacks, India became incredibly cautious with negotiations. This was evident when six years of negotiations for a trade deal with the European Union collapsed with India refusing to lower taxes on European cars to protect its own industries. Instead, the government launched the “Make in India” initiative in 2014, deciding that India must build a competitive manufacturing base before signing new open-border agreements.
2.2 The Reassessment
As the “FTA fatigue” settled in, India focused on streamlining trade logistics. In 2017, it implemented the WTO’s Trade Facilitation Agreement, which modernised customs procedures and cut border delays, perfectly aligning with the “Digital India” campaign. This reassessment phase further proceeded with India entangled in a 3-year-long negotiating period for what was supposed to be the largest free trade agreement of the Regional Comprehensive Economic Partnership (RECP) involving ten ASEAN nations along with China, Japan, South Korea, Australia, and New Zealand. After negotiating from 2017 to 2019, India finally withdrew from the deal after its demand for an auto-trigger mechanism to impose high tariffs on countries like China to avoid maximum imports was challenged by the corresponding nations. With this withdrawal, India strategically shifted its official focus from global inclusion to a guaranteed balance of trade, protecting the interests of its domestic industries.
Phase-3 (2020–Present): The Post-Pandemic Pivot
In 2020, the global economy faced a disruption in global supply chains due to the COVID-19 pandemic, exposing the dangers of relying on a few trading partners. In response, India redesigned its trade policy, shifting focus to securing high-quality, strategic partnerships. This new approach sought to build resilient supply chains and attract foreign investment while simultaneously strengthening domestic manufacturing.
In 2021, India launched its wave of modern agreements, beginning with Mauritius by signing a Comprehensive Economic Cooperation and Partnership Agreement (CECPA), followed rapidly by comprehensive deals with the UAE and Australia in 2022. Unlike older treaties that narrowly focused on tariff reductions, these new-generation agreements prioritised services, digital trade,
professional mobility, and sustainable development. This framework was reinforced by the 2023 Foreign Trade Policy, which championed export digitalisation. With emphasis on investment protection and technology cooperation, these modern agreements have laid the stage for deeper global integration.
3.1 The India–UK CETA: Full Implementation, July 2026
The India–UK Comprehensive Economic and Trade Agreement officially entered into force on July 15, 2026, after being signed on July 24, 2025. This agreement was a game-changer for India as the UK agreed to eliminate tariffs on 99% of its tariff lines, covering nearly 100% of India’s
current export value, excluding the 1% of tariff lines involving sensitive agricultural products such as beef, sugar, and certain dairy products.
This agreement proved to be transformative for three sectors:
- Textile and Apparel: Before the CETA, Indian garments faced UK duties of 8–16%. However, with this agreement, competition from Bangladesh, Vietnam, or Cambodia was undercut by 10–15%.
- Leather Goods and Footwear: Indian leather footwear with strong quality and design reputation had tariff-free access.
- Marine Products: With tariffs at zero, marine products became more competitive in UK supermarkets and restaurants.
The agreement includes provisions where India’s dairy sector and certain agricultural products were protected, with the government taking a deliberate non-negotiable stance to protect farmer interests. UK dairy companies would have liked access to the Indian market, but the Indian government was against it, as letting UK’s cheap milk powder penetrate Indian markets would have harshly impacted 300 million dairy farmers who operate at minimum margins.
3.2 The India–Oman CEPA: Energy, Regional Influence, and Real Data
On June 1, 2026, the India–Oman Comprehensive Economic Partnership Agreement entered into force. The agreement was a compelling case because Oman is India’s gateway to the Gulf and directly influences the nation’s energy and regional supply chains, prompting a change in Indian trade policy. In the fiscal year 2025–26 (which ended March 31, 2026), bilateral trade between India and Oman hit $11.18 billion, up from $10.61 billion the previous year. That’s roughly $2 billion a month flowing between the two countries. Conversely, India exported roughly $ 4 billion in goods, including textiles, pharmaceuticals, machinery, and food products, while importing $7.16 billion in crude oil, natural gas, and fertilisers. With this agreement, India secured 100% duty-free market access covering 98.08% of Oman’s tariff lines, which accounts for 99.38% of India’s export value. This removed 5–8% tariffs on India’s pharmaceutical exports and higher duties on Indian textile products. India safeguarded domestic manufacturing and farmer interests as the Ministry of Commerce placed 2,789 tariff lines on an exclusion list, protecting agricultural products, dates exported from Oman, certain vegetables, and processed foods, also protecting some chemicals and building materials to defend domestic industries.
3.3 The India–European Union FTA: The “Mother of All Deals”
The announcement of the India–EU FTA on January 27, 2026, marked the resolution of nearly 15 years of deadlocked negotiations due to structural disagreements. The deadlock originated from conflicting core priorities, with the EU pushing for strict regulatory alignment alongside
agricultural protections for its farmers, while India sought rapid and extensive European market access. Consequently, domestic pressure groups within both regions actively campaigned to protect their respective local interests.
Official PIB records value India-EU goods trade for 2024–25 at $136.54 billion, with services adding another $83.10 billion, totalling roughly $220 billion. This is the largest bilateral trade relationship India has with any single partner. With this, India secured preferential entry for over 99% of its exports by value.
This agreement proved to be transformative for the following sectors:
- Automobiles: The EU exports finished cars to India with the aim of expansion, but Indian auto tariffs currently sit at 100% for imported vehicles. Under the FTA, India–EU autos see tariff reductions of 110% to 10% over 5 years, granting Indian car manufacturers like Maruti, Hyundai-India, and TATA five years to improve their products and prepare for the new competition.
- Pharmaceuticals: Before the FTA, Indian generics faced tariffs of 0–11% depending on the drug class. With this agreement, India’s generic drug makers get nearly tariff-free access to Europe’s 450 million people, making them much more price-competitive in
European markets, expanding the scope for significant export opportunity. ● Machinery and Electrical Equipment: Indian manufacturers using EU machinery as inputs benefit from cheaper production costs as the FTA removes typical 7-22% tariffs on EU machinery.
The India-EU FTA framework offers commitments in IT services, financial services, professional services, and education, presenting a major opportunity for India given its sector strength.
3.4 The India–New Zealand FTA
On March 16, 2025, India and New Zealand announced negotiations and concluded in December 2025, making this the fastest FTA India has ever negotiated. The agreement was formally signed on April 27, 2026. The deal originated with New Zealand’s interest in indian markets as world dominated dairy exporter. However, India refused, as opening the market to New Zealand’s large-scale, subsidised dairy operations would be devastating for 50+ million farmers. Thus, India excluded 29.97% of tariff lines from concessions, mainly dairy, sugar,
onions, spices, edible oils, pulses, copper, aluminium, and rubber. In exchange for this massive protection, India secured an incredible victory by receiving elimination of import taxes on 100% of Indian exports, with zero exclusions. However, the true highlight of this agreement focuses on people and culture. New Zealand agreed to issue 5,000 temporary work visas for skilled Indian professionals, alongside 1,000 working-holiday visas for young adults. For the first time, India negotiated dedicated visas for Ayurveda practitioners, yoga instructors, and Indian chefs featuring a unique “soft power” initiative. By formally recognising traditional wellness as a tradeable service, India is successfully projecting its cultural heritage onto the global economic stage while securing long-term foreign investment.
In summary, while nearly two decades of trade negotiations have integrated India into the global economy, the benefits have not been equally distributed, and the utilisation of these agreements has often failed to meet projections. To address these gaps, the following sections of this paper will conduct a detailed analysis of key economic indicators and trade utilisation factors. By providing a deeper examination of the specific sectoral challenges hindering performance, this study aims to clarify the obstacles facing India’s trade strategy and highlight necessary policy improvements.
RESEARCH METHODOLOGY
Introduction
This study examines the evolution of India’s economic landscape through international trade agreements under the framework of international law. The research focuses on evaluating how Free Trade Agreements (FTAs) have influenced India’s economic performance by analysing key economic indicators such as exports, imports, foreign direct investment (FDI), gross domestic product (GDP), trade balance, foreign exchange reserves, and sectoral development. Rather than examining trade agreements solely from a legal perspective, the study assesses their practical utility in promoting economic growth, improving market access, enhancing industrial competitiveness, and strengthening India’s integration into the global economy. The study further examines how these agreements have contributed to India’s trade competitiveness, economic integration, and long-term development.
Research Design
The study adopts a mixed qualitative and quantitative research design.
- Descriptive Research explains the evolution of India’s trade policy and major Free Trade Agreements.
- Analytical Research evaluates the relationship between FTAs and key economic indicators. ● Comparative Research compares the economic performance of India before and after major trade agreements.
- Doctrinal Legal Research examines the agreements within the framework of international trade law, including WTO Agreements, GATT 1994, GATS, and TRIPS.
Research Approach
The research follows a comparative and indicator-based analytical approach. Instead of analysing individual agreements in isolation, the study evaluates the collective contribution of India’s major Free Trade Agreements to economic development. This enables an assessment of how successive trade agreements influenced economic indicators over time rather than evaluating each agreement in isolation.
The analysis is divided into three chronological phases:
| Phase | Period | Focus |
| Phase I | 1991–2003 | LPG reforms and establishment of India’s international trade framework |
| Phase II | 2004–2011 | Expansion of regional and bilateral Free Trade Agreements |
| Phase III | 2012–2026 | Consolidation of FTAs, comprehensive economic partnerships, and next-generation trade agreements |
Each phase is analysed using selected economic indicators to understand changes in India’s economic landscape.
Data Collection Method
The study is based entirely on secondary data collected from reliable national and international sources.
: Ministry of Commerce and Industry, Directorate General of Foreign Trade (DGFT), Reserve Bank of India (RBI), Ministry of Finance, Economic Survey of India.
International Sources: World Trade Organisation (WTO), World Bank, International Monetary Fund (IMF), UNCTAD, OECD.
Academic Sources: Peer-reviewed journals, research papers, official trade agreement texts, and policy documents.
Economic Indicators Used in the Analysis
| Economic Indicator | Purpose |
| Export/Import Growth | Evaluate expansion of performance and market integration |
| Trade Balance | Assess changes in trade surplus or deficit |
| Gross Domestic Product (GDP) | Measure contribution to overarching economic growth |
| Foreign Direct Investment (FDI) | Evaluate investment attractiveness |
| Foreign Exchange Reserves | Analyse external sector stability |
| Sectoral Performance | Compare manufacturing output, services exports, and agriculture |
Analytical Techniques
The study employs the following techniques:
- Economic Indicator Analysis: Evaluation of trends in macroeconomic data before and after major FTAs.
- Descriptive Statistical Analysis: Use of Compound Annual Growth Rate (CAGR), moving averages, and percentage share analysis (processed via MS Excel) to quantify long-term economic shifts.
- Utility Analysis of FTAs: Evaluation of trade agreements based on export expansion, investment attraction, market diversification, and technology transfer.
- Legal Analysis: Examination of the consistency of India’s trade agreements with WTO rules and international trade law.
Scope of the Study
The study evaluates the impact of India’s major bilateral, regional, and multilateral trade agreements on the country’s economic development from 1991 to 2026. It focuses on economic indicators, the effectiveness of FTAs, sectoral performance, and India’s integration into the global economy.
Limitations of the Study
- The study relies exclusively on secondary data.
- Confounding Variables: Macroeconomic indicators are influenced by multiple domestic policies (e.g., GST implementation, ‘Make in India’) and global shocks (e.g., COVID-19), making it challenging to isolate the exact causal impact of FTAs from other economic variables.
- Some recent agreements are still under negotiation or awaiting implementation, limiting post-implementation data.
- Variations in reporting standards across national and international databases may affect direct comparisons.
- The study measures macroeconomic outcomes and therefore cannot attribute economic changes exclusively to trade agreements, as domestic policy reforms and global economic conditions also influence these indicators.
Ethical Considerations
The research is conducted using authentic and publicly available sources. All information is properly cited, and findings are presented objectively without bias.
The study distinguishes clearly between factual evidence, statistical analysis, and the author’s interpretation to maintain academic integrity.
ANALYSIS AND INTERPRETATION
Future economic outcomes stemming from the 2025–2026 free trade agreements (FTAs) are uncertain as these treaties are either in the early stages of implementation or awaiting ratification. Through the medium of this analysis, the research paper aims to analyse the impact of the trade agreements on various economic variables like employment, GDP and growth rate, and also how each agreement has significantly impacted the sectoral index of India, specifying the development in each sector and key reforms.
Economic Impact Assessment And Sector Assessment
With India’s integration into the global economy and implementation of FTA’s, its trade landscape has dramatically transformed, with a direct impact on India’s economy and its landforms. Economic openness boosted trade volumes, supporting GDP growth. However, alongside this growth in volumes, the nation faced severe issues with rising trade deficits.
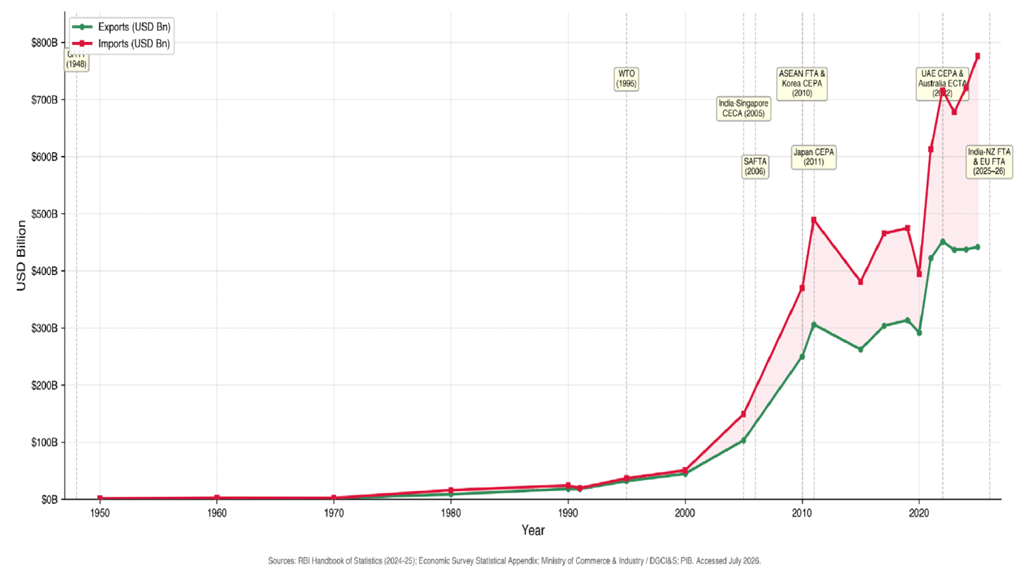
Fig. 2 India’s Merchandise Trade in relation to FTA’s
India’s Foreign Trade – US Dollar
(US $ Millions)
| Year | Exports | Imports |
| 2025-26 | 4,41,730 | 7,74,978 |
| 2020-21 | 2,91,808 | 3,94,436 |
| 2010-11 | 2,49,816 | 3,69,769 |
| 2000-01 | 44,511 | 50,554 |
| 1990-91 | 18,145 | 24,073 |
| 1980-81 | 8,485 | 15,867 |
| 1970-71 | 2,031 | 2,162 |
In the mid-1990s, India’s total merchandise trade stood at a modest USD 68.5 billion. By the 2025–26 fiscal year, that figure skyrocketed to a surprising USD 1,217.8 billion (Directorate General of Commercial Intelligence and Statistics, 2026). During this period, India’s share of global merchandise exports nearly doubled, growing from about 1% in 2005 to 1.8% in 2024
(World Trade Organisation, 2024). The recent wave of modern trade agreements has only accelerated this momentum. For example, bilateral trade with the UAE and Australia combined exceeded USD 124 billion in FY2024-25 (Press Information Bureau, 2024). However, since its independence, India has consistently imported more physical goods than its exports.
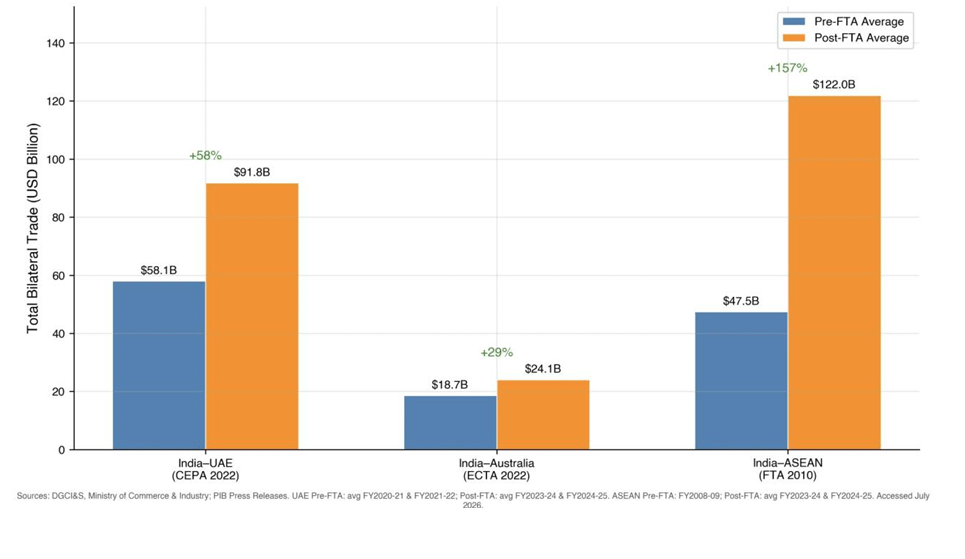
Fig. 3 India’s Economic Performance in relation to FTA’s
India–UAE Bilateral Trade (CEPA)
| Financial Year | Phase | Exports | Imports | Total Trade |
| 2019-20 | Pre-CEPA | 28.85 | 30.27 | 59.12 |
| 2020-21 | Pre-CEPA | 16.68 | 26.62 | 43.30 |
| 2021-22 | Pre-CEPA | 28.04 | 44.83 | 72.88 |
| 2022-23 | Post-CEPA | 31.61 | 53.23 | 84.84 |
| 2023-24 | Post-CEPA | 35.63 | 48.02 | 83.64 |
| 2024-25 | Post-CEPA | 36.63 | 63.42 | ~100.05 |
India–Australia Bilateral Trade (ECTA)
| Financial Year | Phase | Exports | Imports | Total Trade |
| 2019-20 | Pre-ECTA | 2.85 | 9.78 | 12.63 |
| 2020-21 | Pre-ECTA | 4.04 | 8.25 | 12.29 |
| 2021-22 | Pre-ECTA | 8.28 | 16.76 | 25.04 |
| 2022-23 | Post-ECTA | 6.95 | 19.01 | 25.96 |
| 2023-24 | Post-ECTA | 7.94 | 16.16 | 24.10 |
2024-25 Post-ECTA 8.50 15.50 24.10
India–ASEAN Bilateral Trade (ECTA)
| Financial Year | Phase | Exports | Imports | Total Trade |
| 2008-09 | Pre-FTA | ~17.4 | ~30.1 | ~47.5 |
| 2010-11 | Post-FTA | 25.63 | 30.61 | 56.24 |
| 2017-18 | Post-FTA | 34.20 | 47.13 | 81.33 |
| 2022-23 | Post-FTA | 43.51 | 87.59 | 131.10 |
| 2023-24 | Post-FTA | 41.20 | 79.67 | 120.87 |
| 2024-25 | Post-FTA | 38.96 | 84.14 | 123.10 |
An evaluation of comparative bilateral trade volumes before and after the implementation of India’s three most critical recent FTAs indicates that India-UAE trade grew by 58% following the CEPA, averaging USD 91.8 billion compared to USD 58.1 billion in the pre-CEPA phase. Meanwhile, India-ASEAN trade grew by approximately 157%, rising from a pre-FTA baseline of USD 47.5 billion to a post-FTA average of USD 122 billion in FY 2023-24/2024-25, although this expansion occurred alongside a notable widening of the trade deficit. (Sources: DGCI&S, Ministry of Commerce & Industry (commerce.gov.in); PIB Press Releases (pib.gov.in); ASEAN-India Centre (aseanindiacentre.org.in))
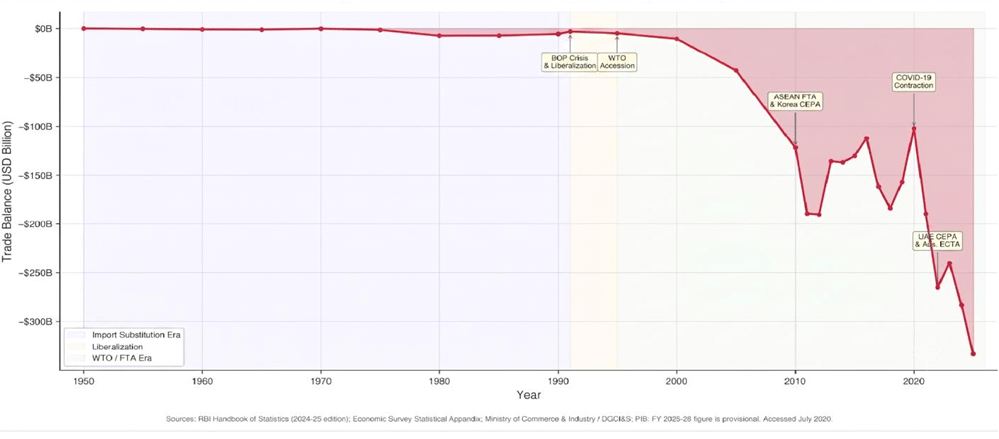
Fig. 4 India’s Trade Balance in relation to FTA
(US $ Millions)
| Year | Trade Balance |
| 2025-26 | -3,33,248 |
| 2020-21 | -1,02,627 |
| 2010-11 | -1,19,954 |
| 2000-01 | -6,043 |
| 1990-91 | -5,927 |
| 1980-81 | -7,382 |
| 1970-71 | -131 |
This deficit has experienced exponential escalation from USD 0.004 billion in 1950-51 to a provisional USD 333.2 billion by FY2025-26. India’s merchandise trade deficit spanning 1950 to 2025 grew from USD 4.9 billion when India joined the WTO (1995-96) to an unprecedented USD 282.8 billion in FY 2024-25, prompting vital inquiries into whether India’s FTAs have tilted unfairly to encourage imports rather than exports. (Sources: RBI Handbook of Statistics on the Indian Economy (2024-25 edition, via dbie.rbi.org.in); Economic Survey Statistical Appendix (indiabudget.gov.in))
Despite these widening deficits, trade agreements have strongly correlated with national economic growth.
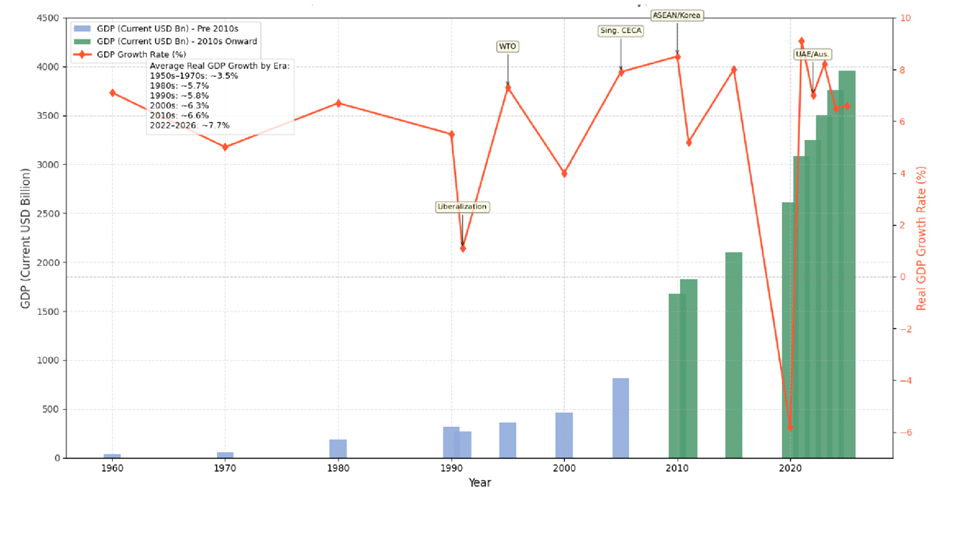
Fig. 5 India’s GDP and Real GDP growth in relation to FTA’s
| Year | GDP (Current USD Bn) | Real GDP Growth (%) |
| 2025-26 | 3,956.0 | 6.6% |
| 2020-21 | 2,611.9 | -5.8% |
| 2010-11 | 1,675.6 | 8.5% |
| 2000-01 | 468.4 | 4% |
| 1990-91 | 316.7 | 5.5% |
| 1980-81 | 186.3 | 6.7% |
| 1970-71 | 62.4 | 5% |
| 1960-61 | 37.0 | 7.1% |
India’s overall Gross Domestic Product (GDP) has grown immensely, from USD 37 billion in 1960 to nearly USD 3.96 trillion by 2025 (World Bank, 2025; International Monetary Fund [IMF], 2025). Economic growth rates have also steadily climbed alongside trade openness, from a sluggish 3.5% before the 1990s reforms, to 6.6% during the early FTA era of the 2010s, and peaking at roughly 7.7% during the latest post-2022 FTA wave (World Bank, 2025; MoSPI, 2025).
The Trade agreements have also created clear winners and losers at the individual industrial level.
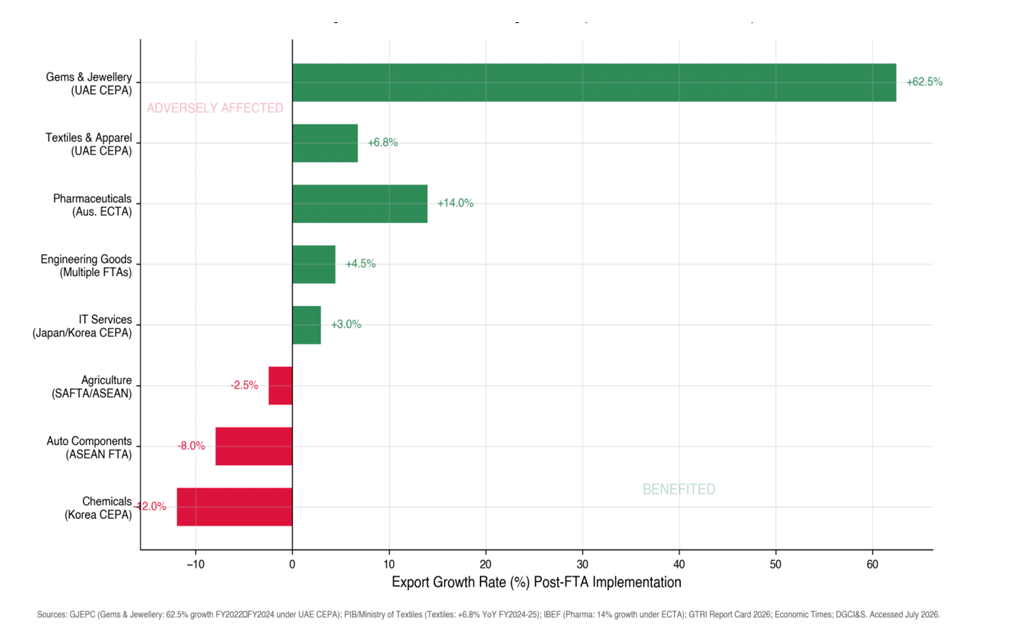
Fig. 6 India’s sector-wise performance
| Sector | FTA | Post-FTA Growth (%) | Direction |
| Gems & Jewellery | UAE CEPA | +62.5% Benefited | |
| Textiles & Apparel | UAE CEPA | +6.8% Benefited | |
| Pharmaceuticals | Australia ECTA | +14.0% Benefited | |
| Engineering Goods | Multiple FTAs | +4.5% Modest Benefit | |
| IT Services | Japan/Korea CEPA | +3.0% Modest Benefit | |
| Agriculture
Auto Components |
SAFTA/ASEAN
ASEAN FTA |
−2.5% Adversely Affected −8.0% Adversely Affected |
Chemicals Korea CEPA −12.0% Adversely Affected
On the winning side, the recent UAE agreement resulted in a massive 62.5% export surge for the Gems and Jewellery sector, pushing exports to USD 8.04 billion, while the Textiles and Apparel sector also saw healthy growth. Similarly, the Australian trade deal boosted pharmaceutical exports by 14% thanks to duty-free access (GJEPC, 2024; PIB, 2024; India Brand Equity Foundation [IBEF], 2024). The auto component and chemical sectors, on the other hand, have struggled as a flood of cheaper imports from ASEAN and South Korea squeezed domestic producers who struggle to compete with preferential duty rates. Meanwhile, the agricultural sector remains constrained by strict technical and health regulations in foreign markets.
| Sector | Export Value (USD Bn) | Share of Total Exports (%) |
| Engineering Goods | ~109.3 | 24.5% |
| Petroleum Products | ~70.0 | 16.0% |
| Agriculture & Allied Products | ~51.8 | 11.9% |
| Chemicals | ~43.7 | 10.0% |
| Textiles & Apparel | ~35.8 | 8.2% |
| Gems & Jewellery | ~32.3 | 7.4% |
| Pharmaceuticals | ~24.5 | 5.6% |
| Others (Leather, Carpets, etc.) | ~71.6 | 16.4% |
| Total | ~437.1 | 100% |
Today, India’s export engine is primarily driven by engineering goods, which make up nearly a quarter of all exports (USD 109.3 billion), followed by petroleum products (16%) and agriculture (11.9%) (Engineering Export Promotion Council [EEPC], 2024; Agricultural and Processed Food Products Export Development Authority [APEDA], 2024). This data reveals a complex reality that while global integration has fueled India’s economic rise, the benefits have been unevenly distributed, requiring strategic policymaking to protect vulnerable domestic industries while continuing to expand on the global stage.
Future Projections
These current statistics demonstrate exponential numeric growth across India’s key economic metrics. Nevertheless, recent trade treaties have substantially enhanced the projection potential for the upcoming decade. Below are economic impact projections for India’s future, calculated using compounded annual growth rate estimates and future value models.
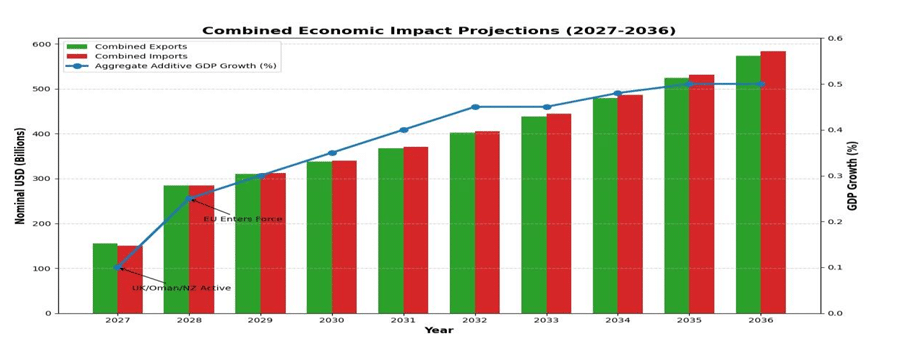
Fig. 7 India’s Economic Impact Projections for 2027-2036
| Year | GDP Growth
Projections |
Exports
Projections |
Imports
Projections |
Trade Balance
Projections |
| 2027 | +0.10% | ~$155 Billion
(UK/Oman/NZ active) |
~$150 Billion | Neutral / Slight
Surplus |
| 2028 | +0.25% | ~$285 Billion (EU enters force) | ~$285 Billion | Neutral |
| 2029 | +0.30% | ~$310 Billion | ~$312 Billion | Slight Deficit |
| 2030 | +0.35% | ~$338 Billion | ~$340 Billion | Slight Deficit |
| 2031 | +0.40% | ~$368 Billion | ~$371 Billion | Slight Deficit |
| 2032 | +0.45% | ~$402 Billion | ~$406 Billion | Slight Deficit |
| 2033 | +0.45% | ~$438 Billion | ~$444 Billion | Moderate Deficit |
| 2034 | +0.48% | ~$479 Billion | ~$486 Billion | Moderate Deficit |
| 2035 | +0.50% | ~$524 Billion | ~$532 Billion | Moderate Deficit |
| 2036 | +0.50% | ~$574 Billion | ~$584 Billion | Moderate Deficit |
The recent agreements act as a steady growth engine, eventually adding a compounding +0.5% to India’s total annual GDP growth. While exports will nearly quadruple over the decade, imports will match or slightly exceed this pace, primarily driven by Oman’s energy exports and EU industrial machinery. The trade balance remains manageable, heavily subsidised by services.
These recent developments in foreign trade agreements have also expanded development horizons for several key industries. By serving as central pillars within these treaties, the following sectors directly impact macroeconomic forecasts and experience the most substantial economic impacts.
10-Year Total Global Export Projections by Sector (in Nominal USD Billions)
| Sector | Official
2026 Baseline |
Est. CAGR | Year 5 Projection (2031) | 10-Year Outlook (2036) |
| IT &
Telecommunications |
206.5B | 15% | $415.3 B | $835.4 B |
| Engineering Goods | $109.3 B | 6% | $146.2 B | $195.7 B |
| Agriculture & Allied | $52.5 B | 2% | $57.9 B | $64.0 B |
| Textiles & Apparel | $35.8 B | 10% | $57.6 B | $92.4 B |
Pharmaceuticals $31.1 B 12% $54.8 B $96.7 B
An analysis of the numbers clearly indicates that India’s trade future will be carried entirely on human capital and digital services. Although sectors such as textiles and generic pharmaceuticals will experience a tangible boost from these new trade agreements, their absolute financial gains are completely overshadowed by the massive growth projected in IT and telecom. Meanwhile, the agricultural sector is flatlining by design as the government prioritises protecting domestic farmers over pushing aggressive exports, and heavy engineering encounters an uphill battle against Europe’s new carbon taxes. Ultimately, these agreements solidify India’s position in the global economy.
FTA Utilisation and Implementation Gaps
India faces a massive “utilisation gap” when it comes to its trade deals. Recent reports reveal that while partner countries successfully utilise preferential tariffs for 60% to 70% of their exports to India, Indian exporters utilise these benefits for only 20% to 30% of their eligible exports, with some academic estimates placing it as low as 5% to 25% for specific agreements (Confederation of Indian Industry; Economic Times; Global Trade Research Initiative, 2026; Indian Council for Research on International Economic Relations). When compared internationally, India lags significantly behind developing peers like Vietnam and Mexico (40–50%), and heavily falls behind developed economies like the EU and Japan (70–80%) (Global Trade Research Initiative, 2026).
Research points to several critical implementation barriers is causing this severe under-utilisation. Beyond the complexities of “Rules of Origin” and “inverted duty structures,” Indian exporters also face Non-Tariff Barriers (NTBs), such as overly strict sanitary standards or complex certification requirements that block goods regardless of tariff cuts (Drishti IAS; Indian Council for Research on International Economic Relations). Even when tariffs are cut, the tax savings are often too small to justify the necessary paperwork (Economic Research Institute for ASEAN and East Asia; Indian Institute of Foreign Trade). Also, there is a widespread lack of basic awareness among MSMEs regarding how to even apply for these benefits.
Furthermore, India has struggled with third-country routing, where goods from non-FTA nations like China are routed through ASEAN countries to illegally claim tax discounts (Hindustan Times; The Hindu). In response, the government introduced the CAROTAR 2020 rules. While successful in curbing illegal routing, it placed a heavy legal burden on legitimate Indian importers to verify product origins, increasing compliance fatigue (Directorate General of Foreign Trade).
However, there is a promising sign that India is fixing these gaps. The recent India-Australia Economic Cooperation and Trade Agreement (ECTA) stands out as a remarkable exception, boasting an 84% utilisation rate. Trade analysts attribute this success to modernised implementation efforts and extensive industry outreach, proving that strategic execution can help India successfully leverage its trade networks.
To address these ongoing challenges, the Indian government has recently implemented several targeted solutions. Introduced in 2024, the Trade Connect ePlatform serves as a single-window portal that links exporters directly with Export Promotion Councils and Indian Missions abroad. It features an integrated Tariff Explorer, enabling businesses to efficiently determine applicable FTA benefits for their products. Additionally, the Certificate of Origin framework has been modernised via the e-CoO 2.0 system, replacing slow, manual documentation with QR-code verification and Aadhaar-based electronic signatures to substantially reduce processing times. For small-scale exporters facing resource constraints in understanding trade regulations, the Niryat Bandhu Scheme provides personalised mentorship through DGFT-appointed advisors. Concurrently, the Districts as Export Hubs initiative operates at the local level to uncover high-potential export goods in each district, resolving local bottlenecks to integrate MSMEs into the formal trade framework. Alongside the successful India-Australia ECTA model, these initiatives indicate a strategic transition from a passive approach toward active post-signing implementation management, though the scalability of these programs in bridging the gap with nations like Vietnam and South Korea remains to be seen.
CONCLUSION
This paper traces India’s trade trajectory from an isolated, license-regulated economy into a proactive negotiator of comprehensive pacts with global markets. The data reveals an intricate,
candid reality: India has absorbed costly lessons, modified its strategies, and is striving to establish a more sophisticated framework for global trade, even as deep-seated structural challenges persist.
A prominent insight across all structural phases is the enduring disconnect between theoretical promises of trade pacts and actual implementation outcomes. Early agreements under Phase 1 with ASEAN, South Korea, and Japan boosted overall trade volumes but triggered widening deficits—the exact outcome India sought to prevent. This was driven by a flood of finished imports that local manufacturers could not rival in pricing or scale. Specifically, India’s trade deficit with ASEAN escalated dramatically from around USD 5 billion prior to the FTA to over USD 45 billion by 2024-25. This massive gap highlights a fundamental imbalance where tariff reductions disproportionately favoured foreign producers, since partner economies already had low MFN rates while India reduced tariffs from a substantially higher baseline.
The ensuing period of “FTA fatigue” served as a crucial course correction rather than a policy failure. Exiting the RCEP negotiations in 2019 and the breakdown of automobile tariff talks with the EU demonstrated that Indian negotiators recognised a vital principle: signing trade pacts for diplomatic appearances without strengthening domestic industrial capability results in unequal trade. The introduction of the Make in India campaign and strategic efforts toward industrial self-reliance during this era directly responded to the realisation that opening trade without industrial readiness turns the domestic market into a repository for foreign goods.
The post-2020 era marks a qualitative evolution in the composition of trade pacts rather than just a rhetorical shift. Agreements like the UAE CEPA, Australia ECTA, and recent deals with the UK, EU, Oman, and New Zealand transcend standard tariff reductions by integrating dedicated chapters on services, digital commerce, professional mobility, and investment safeguards. Notable examples include the India-UK CETA’s Double Contribution Convention, which eliminates overlapping social security contributions for Indian professionals, and the India-New Zealand FTA’s recognition of yoga teachers and Ayurveda practitioners as tradeable service categories. These mechanisms leverage India’s genuine competitive edge—its young, English-speaking, skilled human capital—instead of forcing domestic factories into direct asymmetry with better-capitalised global manufacturing giants.
Sectoral performance clarifies this economic path. Driven by IT and professional services, which baseline at USD 206.5 billion and comprise nearly half of total service exports, this segment is poised for a 15% compound annual growth rate over the upcoming decade. While textiles and pharmaceuticals stand to gain from tariff eliminations in European and British markets, engineering goods confront structural resistance from the EU’s Carbon Border Adjustment Mechanism, operating effectively as a climate-based tariff on carbon-heavy Indian manufacturing. Concurrently, agriculture is deliberately insulated from liberalisation across all signed frameworks, a political imperative to safeguard more than 50 million dairy farmers reliant
on domestic protection. Consequently, India’s global trade potential remains anchored in intellectual services rather than industrial factories for the foreseeable future.
The most critical challenge identified is the persistent utilisation gap. The efficacy of any trade deal relies on commercial adoption, yet Indian exporters utilise preferential benefits on barely a quarter of eligible shipments, whereas foreign counterparts achieve utilisation rates between 60
and 70 per cent. This deficit stems from intricate rules of origin, prohibitive compliance overheads for smaller enterprises, low awareness, and narrow tariff margins that make paperwork uneconomical. However, the Australia ECTA’s 84% utilisation rate demonstrates that this systemic gap is entirely resolvable through targeted state outreach, modernised digital infrastructure, and streamlined documentation.
Moving forward, the study indicates that India’s trade success will depend less on executing new agreements and more on maximising the implementation of active ones. The government’s export target of USD 2 trillion by 2030 remains highly ambitious, especially given the contrast between the past decade’s 3.5% average annual export growth and the roughly 22% annual acceleration required to meet the goal. Trade agreements alone are insufficient to bridge this variance. Addressing inverted duty structures, optimising logistics costs, enhancing labour productivity, and deploying an accessible digital compliance architecture for MSMEs constitute the vital domestic reforms that will decide whether these legal frameworks become genuine growth catalysts or remain underutilised documents in administrative archives. The threshold is open, but India’s advancement depends entirely on domestic execution.
References
Ahluwalia, M. S. (2002). Economic reforms in India since 1991: Has gradualism worked? *Journal of Economic Perspectives*, *16*(3), 67–88.
https://doi.org/10.1257/089533002760278721
Bhagwati, J. N. (1982). Directly unproductive, profit-seeking (DUP) activities. *Journal of Political Economy*, *90*(5), 988–1002. https://doi.org/10.1086/261104
Bhagwati, J. N. (1993). India in transition: Freeing the economy. Oxford University Press. https://doi.org/10.1093/acprof:oso/9780198288473.001.0001
Bhagwati, J. N., & Srinivasan, T. N. (1975). Foreign trade regimes and economic development: India. Columbia University Press; National Bureau of Economic Research. http://www.nber.org/books/bhag75-1
Bhagwati, J. N., & Srinivasan, T. N. (1993). India’s economic reforms. Ministry of Finance, Government of India. https://the1991project.com/public-repository/report-indias-economic-reforms-1993-jagdish-bhagwati-and-t-n-srinivasan
Cerra, V., & Saxena, S. C. (2002). What caused the 1991 currency crisis in India? *IMF Staff Papers*, *49*(3), 395–425. https://doi.org/10.2307/3872503
Goldar, B., & Mitra, A. (2021). Trade liberalisation and manufacturing employment in India. *Indian Economic Review*, *56*(1), 27–50. https://doi.org/10.1007/s41775-021-00108-z
Joshi, V., & Little, I. M. D. (1996). India’s economic reforms, 1991–2001. Oxford University Press. https://doi.org/10.1093/acprof:oso/9780198290781.001.0001
Mohan, R. (2005). *Fiscal challenges of population aging: The Asian experience*. Reserve Bank of India.https://rbi.org.in
Panagariya, A. (2004). India in the 1980s and 1990s: A triumph of reforms. *IMF Working Paper*, *WP/04/43*. https://www.imf.org/external/pubs/ft/wp/2004/wp0443.pdf
Panagariya, A. (2008). India: The emerging giant. Oxford University Press. https://doi.org/10.1093/acprof:oso/9780195315035.001.0001
Saraswat, V. K., Priya, P., & Ghosh, A. (2018). A note on free trade agreements and their costs. *NITI Aayog Policy Paper*. https://niti.gov.in
Agricultural and Processed Food Products Export Development Authority. (2024). *Export statistics*. Ministry of Commerce and Industry. https://apeda.gov.in
Department for Promotion of Industry and Internal Trade. (2024). *FDI statistics: Fact sheet on foreign direct investment*. Ministry of Commerce and Industry. https://dpiit.gov.in/publications/fdi-statistics
Department of Commerce. (2025). *India’s trade agreements*. Ministry of Commerce and Industry. https://commerce.gov.in/international-trade/trade-agreements/
Directorate General of Commercial Intelligence and Statistics. (2026). *Foreign trade statistics of India*. Ministry of Commerce and Industry.https://dgciskol.gov.in
Directorate General of Foreign Trade. (2025). *Foreign trade policy 2023 and related notifications*. Ministry of Commerce and Industry. https://dgft.gov.in
Engineering Export Promotion Council of India. (2024). *Annual report on engineering exports*. https://www.eepcindia.org
Gem and Jewellery Export Promotion Council. (2024). *Annual report 2023–24*. https://gjepc.org
Indian Trade Portal. (2005). *India-Singapore CECA: Agreement text and tariff schedules*. Department of Commerce. https://indiantradeportal.in
Indian Trade Portal. (2010). *India-Korea CEPA: Agreement text*. Department of Commerce. https://indiantradeportal.in
Ministry of Commerce and Industry. (2024). *Press releases on India’s recent trade agreements*. Press Information Bureau.https://pib.gov.in
Ministry of External Affairs. (2005). *India-Singapore Comprehensive Economic Cooperation Agreement*. Government of India. https://mea.gov.in
Ministry of Finance. (2020). *Atmanirbhar Bharat Abhiyan: Economic stimulus package*. Government of India. https://www.indiabudget.gov.in
Ministry of Statistics and Programme Implementation. (2025). *National accounts statistics and GDP estimates*. Government of India. https://mospi.gov.in
NITI Aayog. (2022). *India’s trade policy: A review of free trade agreements*. Government of India. https://niti.gov.in
Press Information Bureau. (2005). *India-Singapore CECA signed*. Government of India. https://pib.gov.in
Press Information Bureau. (2010). *India-Korea CEPA comes into effect*. Government of India. https://pib.gov.in
Press Information Bureau. (2011). *India-Japan CEPA signed*. Government of India. https://pib.gov.in
Press Information Bureau. (2024). *India’s bilateral trade with UAE and Australia*. Government of India. https://pib.gov.in
Reserve Bank of India. (1991). *Annual report 1990–91*.
https://rbi.org.in/Scripts/AnnualReportPublications.aspx
Reserve Bank of India. (2001). *Handbook of statistics on the Indian economy*. https://dbie.rbi.org.in
Reserve Bank of India. (2025). *Handbook of statistics on the Indian economy, 2024–25 edition*. https://dbie.rbi.org.in
Association of Southeast Asian Nations. (2010). *ASEAN-India Trade in Goods Agreement*. ASEAN Secretariat. https://asean.org/asean-india-trade-in-goods-agreement/
International Monetary Fund. (2025). *World economic outlook database, April 2025*. https://www.imf.org/en/Publications/WEO
World Bank. (2018). *A glass half full: The promise of regional trade in South Asia*.https://www.worldbank.org/en/region/sar/publication/a-glass-half-full-the-promise-of-regional-trade-in-south-asia
World Bank. (2023). *India development update*. https://www.worldbank.org/en/country/india
World Bank. (2025). *World development indicators*. https://data.worldbank.org/country/india
World Trade Organisation. (n.d.). *India and the WTO*.
https://www.wto.org/english/thewto_e/countries_e/india_e.htm
World Trade Organisation. (2024). *Trade profiles: India*.
https://www.wto.org/english/res_e/statis_e/daily_update_e/trade_profiles/IN_e.pdf