
Authors:
AFREEN, AMIT CHAUDHARY, HARMAN HUNJAN, JOTY RUBAYATH, PRANAV RANJAN, PRIYA PRASAD, SABAHAT SHAIKH
Abstract
Regional disparities across districts in India remain a major challenge for equitable public health planning. This study examines whether the availability and functional capacity of healthcare infrastructure align across Odisha’s 30 districts, while analysing the underlying pattern that may help to explain observed discrepancies. This research relied on quantitative, empirical, and comparative case-study methodology, drawing upon secondary data from the National Family Health Survey-6 (NFHS-6), Rural Health Statistics (RHS), Odisha government health records, and legislative disclosures. Districts were evaluated across infrastructure metrics spanning PHC inpatient utilisation, hospital bed capacity, and doctor and specialist availability, alongside critical maternal and child outcomes like institutional deliveries, skilled birth attendance, immunisation, and postnatal care. This investigation highlights substantial imbalances in both structural and functional healthcare resources. Although Cuttack provides roughly 750 district hospital beds, Nabarangpur offers only around 70; while the share of PHCs recording zero inpatient admissions ranges from 18.5% in Malkangiri to 94.5% in Cuttack. The scarcity of expert worker resources persists as a primary bottleneck, with only 386 of the 1,500 approved specialist roles occupied across the state as of December 2024. The result also highlights contradictions; for example, Khordha recorded only 66.5% full immunisation despite strong delivery-related indicators. This evidence reveals that facility availability alone provides an inadequate measure of healthcare capacity, emphasising the importance of functional service delivery, staffing, consistent monitoring, and context-specific resource allocation in advancing district-level health equity.
Introduction
Healthcare is not experienced in the same way across every district of Odisha. Some districts may have better access to doctors, hospital beds and specialist services, while others continue to face shortages despite having health facilities. At the same time, differences can be seen in outcomes such as institutional deliveries, child immunisation and postnatal care. This raises an important question: does better healthcare infrastructure always translate into better outcomes?
The problem, is not simply a lack of facilities, but the unequal distribution of resources and the possibility that infrastructure and outcomes do not always move together. Significant regional inequalities in public health outcomes prevail across India, highlighting disparities within the country’s healthcare system. Although most literature highlights state-level disparities, variation also exists within states, particularly among districts. The research shows that variation between districts explains a large share of the gap in maternal healthcare, highlighting how state-level data can mask critical local gaps. As a result, a district may appear well equipped on paper while still experiencing gaps in actual service delivery and health outcomes.
Much of the existing discussion around healthcare performance focuses on individual indicators or broad state-level trends. While useful, these approaches can hide the differences within a state as diverse as Odisha. A district may have a strong healthcare system but still show weaker outcomes, while another may achieve better outcomes despite having fewer resources. These differences are difficult to understand when infrastructure and outcomes are studied separately. There is therefore a need for a district-level approach that brings both sides together and identifies where the significant gaps lie.
This research analyses the disparity between infrastructure and outcomes through a comparative, quantitative study across all 30 districts of Odisha. By analysing existing data from major health registries such as the National Family Health Survey (NFHS) and Rural Health Statistics (RHS), this study investigates how healthcare infrastructure imbalances are associated with health outcomes and identifies the factors potentially contributing to these disparities. It compares all 30 districts using an Infrastructure Index and an Outcome Index, bringing together several indicators rather than relying on one measure, and examines the gap between what districts have and what they are able to achieve. By ranking and classifying districts according to their performance and priority level, the analysis aims to highlight where investment could make the greatest difference. Investigating district-level delivery is essential for promoting health equity and improving the distribution of public resources. Simply building more clinics in low-resource areas does not effectively improve population health. By examining whether districts with greater physical infrastructure also achieve better health outcomes, the research can help identify potential gaps between facility supply and service capability. In addition, investigating workforce shortages, financial deployment, budget execution, and regular service tracking can reveal the systemic causes of these gaps. These findings can support strategic and localised policy interventions, enabling policymakers to differentiate between districts that primarily require additional resources and those where stronger administrative capacity, workforce deployment, or service monitoring may be more critical.
Ultimately, this study provides evidence for developing fair and effective district-level health policies by directly aligning district-level investments with local needs, turning district-level data into a picture of where healthcare resources are reaching people effectively, and where greater attention is still needed.
Literature review
Health outcomes in India differ significantly across districts, demonstrating differences not only in availability of healthcare infrastructure but also in socioeconomic conditions. Existing literature has recorded inequalities in access to the facilities, human resources, maternal and child health services across states and districts. Although evidence suggested that the presence of health services alone does not effectively address these differences, factors such as geographic access, availability of health workers, socioeconomic conditions, and local administrative capacity can govern weather allocated resources truly advance public health outcomes.
Research has therefore moved beyond structural totals to study how resources are distributed and used. Studies have identified healthcare financing indicating that greater financial resources do not automatically result in enhanced health outcomes. At the same time governance and implementation have emerged as important factors influencing recruitment, supervision, fund utilisation, and service delivery on capacity. This literature review therefore examines four interconnected themes: health services and district inequalities, financing allocation, governance and implementation capacity, and together, they point toward a common gap the absence of any study that examines them jointly at the district level which is the gap this study directly investigates.
Theme 1 — Infrastructure Availability & the Within-District Problem
Existing literature suggests that socioeconomic differences and uneven infrastructure availability at the district level influence health outcomes in India (Rammohan & Awofeso, 2015). The study indicates large disparities in childhood immunisation at the state and district levels, with immunisation coverage declining as distance from primary healthcare facilities increases.
However, physical accessibility alone may not adequately capture infrastructure quality, health worker availability, or vaccine availability, highlighting the need for local-level assessment.
The importance of the district context is further supported by (Desai & Wu, 2010), who found that 47% of the variation in vaccine delivery occurs between districts. Their findings suggest that district-level healthcare availability and governance can shape service delivery, indicating that infrastructure must be supported by an enabling environment for effective implementation.
Similarly, (Panda et al. 2020) reported significant gaps in maternal and child health coverage in Uttar Pradesh, Bihar, Rajasthan, and the North-Eastern states. Together, these studies suggest that infrastructure disparities interact with socioeconomic conditions and local health-system capacity, contributing to spatial inequalities in health outcomes. This is consistent with (Hati & Majumder, 2013), who identified district-level disparities in the provision of promotive, preventive, and curative services, including ASHAs, sanitation, Sub-Health Centres, and road connectivity.
They found that poorer health outcomes were more likely in areas with less-developed infrastructure, further highlighting the relationship between infrastructure deficits and geographic health inequalities. Finally, (Kumar & Reshmi, 2022) extend this evidence across all 640 districts, demonstrating significant within-state differences in facility and human-resource availability.
Theme 2 — Financing Doesn’t track need
Health financing is expected to promote equity by directing greater resources towards regions with greater healthcare needs. In India, however substantial differences in healthcare need do not consistently corresponds to difference in public health spending. This disconnect is important because the equity implications of financing depend not only on volume of resources available, but also on their allocation across regions, their conversion into effective services.
Chaterjee and Smith (2021) provide evidence of a disconnect between financing and need. Their district level analysis of Odisha found a weak relationship between public health spending and indicators of needs (including poverty and infant mortality). At state level, Mohanty and Behera’s analysis shows that public health spending is generally associated with improved health outcomes.
However, these effects were weaker in high focused states despite their greater health needs. The question shifts from whether more resources are required to how effectively existing resources are covered. This distinction in giving public expenditure is reinforced at the household level by Dwivedi and Pradhan (2017) who finds substantial socioeconomic and regional differences in healthcare expenditure. Purohit similarly identifies poorer health resources and greater financial burden in low-income states.
Taken together, the literature agrees that financing is necessary but not sufficient for achieving health equity. Yet it leaves an important problem unresolved: whether poor outcomes primarily reflect inadequate funding,or that allocation that does not sufficiently follow needs.
Theme 3 — Governance as deciding factor
Scott et al. (2014) in their district health framework argued that decentralisation fails without effective decision-making space. They established governance capacity as fundamental for health system performance. Their study demonstrated that even when infrastructure norms were met, outcomes remained poor if governance capacity was weak. George et al. (2015) developed a governance framework for health, defining governance as accountability and effective management. They showed that districts with strong District Health Society (DHS) functionality,, transparent decision-making and monitoring had 40-60% better outcome indicators such as IMR, MMR and full immunisation. Prinja et al. (2016) studied Punjab and Haryana and found that outcome gaps were due to governance failures rather than resource scarcity. NITI Aayog Health Index (2021) and Aspirational Districts Programme (2018) provided that fund allocation is broadly similar across districts, but utilisation varies from 45% to 92% Together, these studies conclusively establish governance as the deciding factor.
Theme 4 — Diagnosis Outpacing Explanation
A final group of studies looks at the bigger picture of health equity research itself. Balarajan et al. (2011), in an influential review, described India’s healthcare inequality as a situation that could be fixed with better planning and monitoring. But seven years later, Ravindran and Seshadri (2018) reviewed the field and found that most of the research was descriptive as it focused on documenting problems, not explaining why it kept happening or testing solutions.Some newer research has started testing real solutions, though the results are mixed. Selvaraj et al. (2021) found that a specific, well-targeted maternal health program closed the gap between rich and poor over time. But Das (2024), studying general infrastructure spending across Indian states, found almost no link between how wealthy a state was and how well-resourced its healthcare system was; meaning that richer states like Haryana and Maharashtra did not necessarily have better infrastructure than smaller, poorer states.
This suggests that different types of investment may not relate to outcomes in the same way, although Selvaraj et al. (2021) and Das (2024) study different services using different methods, so this comparison should be read as suggestive. Targeted spending on a specific service seems to work better than broad, general infrastructure spending. Yet what remains unresolved is that neither Selvaraj et al. (2021) nor Das (2024) explain why the targeted spending conveys to outcomes while general infrastructure spending doesn’t, which is investigated in the study.
Synthesis
Looking at the four themes side by side, a pattern is visible. Infrastructure matters, but Desai and Wu’s finding that only 47% of the gap sits between districts means infrastructure alone is explaining less; the rest is happening where infrastructure numbers don’t reach. Financing research by Chatterjee and Smith show spending barely tracks need in Odisha, while Mohanty and Behera find that even when money does flow toward high-need states, the effect is weaker exactly where it’s needed most. That’s where the governance steps in; Scott et al. and George et al. both point to decision-making capacity as the reason identical funding and infrastructure produce different results, and NITI Aayog’s data backs this up, showing utilisation swinging from 45% to 92% under what’s supposed to be similar allocation. Theme 4 shows this same tension playing out at the investment itself: targeted spending worked for Selvaraj et al., general spending didn’t for Das, and neither paper says why. So, each theme is answering a piece of the same unanswered question, and none of them have been tested together.
Research gap
Previous studies show that healthcare infrastructure, funding, and governance all have an effect on health outcomes. However, most studies have looked at these factors separately rather than together. Research also shows that having more healthcare facilities does not always lead to better outcomes, as many differences exist between people living within the same district. Similarly, healthcare funding does not always reach the areas or groups that need it the most. Some studies also show that better planning and decision-making at the district level can improve how funds and infrastructure are used. However, there is still limited research that brings all these factors together at the district level. There is also a lack of studies that compare how infrastructure, funding, governance, and socioeconomic conditions work together across different Indian districts.
Therefore, the main research gap is to understand which of these factors, or combination of factors, best explains differences in healthcare outcomes across districts. Our study aims to address this gap by studying these factors together and identifying where improvements in healthcare investment, funding, and governance are most needed.
That’s the gap this study is built to close. Instead of picking one lens, infrastructure, or financing, or governance and studying it on its own like most of this literature does, the study looks at all three together, in the same districts, against the same outcome data. If a district has decent infrastructure and decent funding but its outcomes are still poor, that mismatch is the actual signal worth chasing, and governance is the most likely explanation the existing research points to. This isn’t about proving gaps exist, since that’s already well established. It’s about figuring out, by district, which factor is actually holding outcomes back where money and infrastructure alone clearly haven’t fixed it.
Research Methodology
1. Research Design
This study takes upon a correlational, comparative case-study design. It is correlational because the objective is to examine whether healthcare infrastructure availability and health outcomes work together across districts, or whether they don’t. It is comparative because it compares all districts of a state using the same standard indicators, which allow ranking and gap identification. It is a case-study design because Odisha is used as a unit of study. This methodology fits the research question and asks whether infrastructure gaps and outcome gaps align in districts, and, what that mismatch might reveal about financing and governance factors.
2. Nature of Research
The research is is quantitative and empirical, which is based on secondary numerical data. The data is drawn from published government and survey sources. It is quantitative because the analysis is based on numerical indicators such as facility counts, percentage coverage rates, that are used for comparison across districts. A qualitative layer is used to explain all the findings from the data.
3. Sample & Sampling Technique
The unit of analysis is the district. The target population is all districts within a single Indian state, and Odisha was purposively selected as that state. The justification for this choice rests on factors: Odisha has a manageable number of districts (30, per the 2011 Census administrative boundaries used by NFHS-5); Odisha already has a published district-level financing equity study (Chatterjee & Smith, 2021, reviewed in this paper’s literature review), which allows this study’s financing layer to build on verified prior work.
4. Data Collection Tool
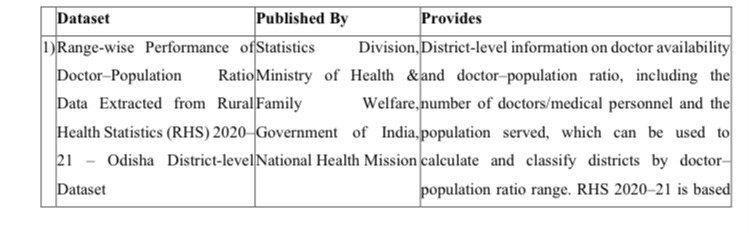
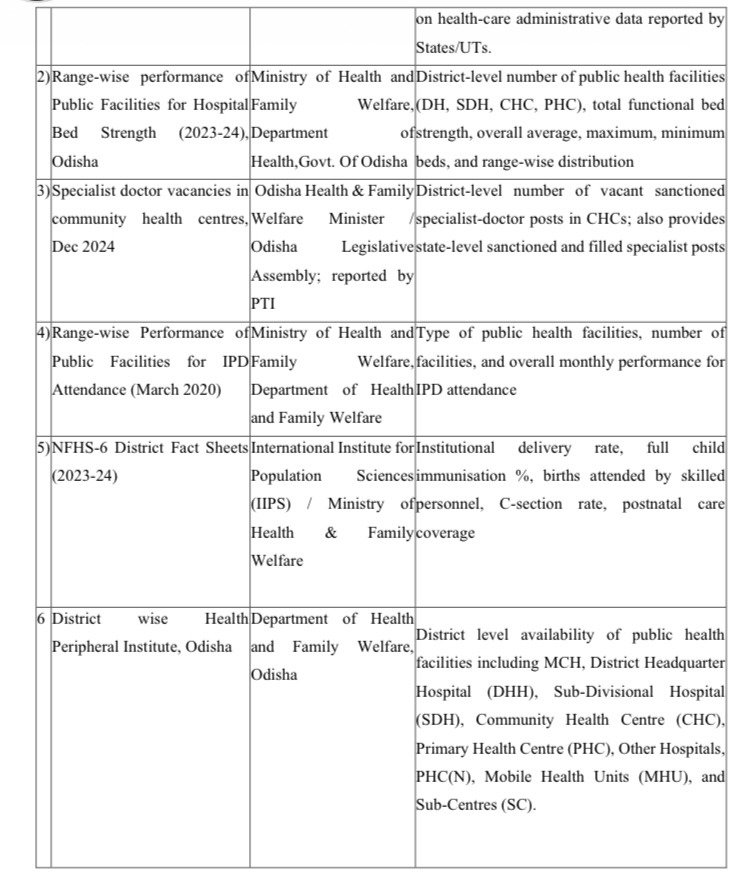
No primary data collection tool is used. All data is secondary, drawn from the following publicly available sources:
5. Variables Used
This study does not use a strict independent/dependent variable model. Instead, it compares two composite indices — an infrastructure index and an outcome index — across Odisha’s 30 districts , interpreted using contextual, non-scored variables.The infrastructure index draws on four variables: doctor–population ratio (RHS 2020–21), public hospital bed strength across DH/SDH/CHC/PHC (2023–24, odisha.data.gov.in, cross- verified with RHS 2022–23 and the CAG Audit Report), specialist doctor vacancies at CHCs (2024, Odisha Assembly response via ETHealthworld/PTI), and facility-wise IPD attendance performance (March 2020, odisha.data.gov.in/MoHFW; nil performance includes non-reporting or zero reports, and facility counts may shift with HMIS updates).
The outcome index draws on a single dataset, NFHS-6 District Fact Sheets (2023–24, IIPS/MoHFW), covering institutional delivery rate, full child immunisation %, births attended by skilled personnel, C-section rate, and postnatal care coverage. Contextual variables, financing equity evidence from Chatterjee & Smith (2021) and Aspirational Districts Programme coverage are not scored or indexed; they’re used only to help explain divergence between the two indices.
6. Index Construction
Each indicator in the infrastructure and outcome indices was normalised onto a common 1-to-5 grading scale before combination, so that indicators measured in different units (percentages, ratios) could be compared and averaged consistently. For percentage-based outcome indicators as institutional births, full immunisation, skilled birth attendance, postnatal care, districts were graded as follows: 95% and above = 5 (Excellent), 90–94.9% = 4 (Good), 80–89.9% = 3 (Moderate), 70–79.9% = 2 (Poor), below 70% = 1 (Very Poor). The Overall Outcome Grade for each district was calculated as the rounded average of its four indicator grades (ROUND(AVERAGE(grade1:grade4), 0)), producing a single whole-number grade per district with no decimals. Infrastructure indicators as PHC nil-performance rate, District Hospital bed capacity were normalised using the same banding logic, adjusted to reflect each indicator’s own realistic range across districts, and combined into an Overall Infrastructure Grade. All indicators were weighted equally within their respective index; this is stated explicitly as a simplifying assumption in the Limitations section, since specialist availability or postnatal care could arguably be weighted more heavily depending on policy priority.
7. Ethical Considerations
All the data used in this study is secondary, drawn entirely from publicly released government statistics and a published academic source. No primary data was collected, so no consent procedures apply. The relevant ethical obligations here are, responsible and accurate use of public data: every figure is cited to its original source, data is not altered or selectively presented to support a biased conclusion, and district-level findings are presented strictly as indicators of infrastructure and outcome gaps and not as criticism of any named local administration or individual official.
8. Limitations
Each dataset has its own gaps. The doctor–population ratio (RHS 2020–21) is now over four years old and may understate current shortages given 2024’s documented vacancy increases; it also reflects not real-time turnover, and covers general doctor availability only, not specialists. Bed strength (2023–24) is self-reported “functional” capacity, which may not reflect real staffing or equipment; cross-verification with RHS 2022–23 and the CAG Audit revealed prior lags, so figures aren’t fully reconciled, and this is a capacity measure best read alongside IPD attendance, not alone. Specialist vacancy data (Dec 2024) covers only districts with verifiable figures and comes from a legislative disclosure, so it’s less standardised than RHS/HMIS data. IPD attendance data (2020) covers only HMIS-reporting districts, excludes medical colleges, and is outdated. Facility counts indicate availability but do not capture-functionality, quality staffing, or utilisation.Therefore, raw facility counts should be interpreted cautiously and standardised by district population.
More broadly, the divergence between infrastructure and outcomes is explained through prior literature, not proven statistically. The study uses secondary data collected from different years between 2020 and 2024, depending on the data availability. Therefore, the findings should be interpreted as an indicative comparison rather than a strictly time-consistent assessment of district-level healthcare disparities. Financing and governance data are contextual across districts. Findings are limited to Odisha and shouldn’t be generalised to other states without separate validation.
Data Analysis
This chapter presents the data analysis for the infrastructure and outcome indicators across Odisha’s 30 districts. Infrastructure is examined through three lenses: PHC functional performance (IPD admission data, Rural Health Statistics 2020-21), District Hospital bed capacity (RHS 2020-21), and specialist staffing at Community Health Centres (Odisha Assembly disclosure, December 2024). Doctor-population ratio data is presented though partial district coverage. Outcome indicators are drawn from the NFHS-6 (2023-24) District Compendium, covering institutional births, skilled birth attendance, full immunisation, and postnatal care. All analysis is descriptive as the study covers full set of districts. 24×7 PHC functionality indicator, could not be scored at due to a lack of district-wise reporting in any available source; and is discussed further below.
Table 1. PHCs Reporting Nil Inpatient (IPD) Admissions, by District (March 2020)
Source: Rural Health Statistics (RHS) 2020-21, Ministry of Health & Family Welfare — Range-wise Performance of Public Facilities for IPD Attendance, Odisha.
For every Primary Health Centre (PHC) in each of Odisha’s districts, this indicator shows what share of PHCs recorded zero inpatient admissions in March 2020, against the total number of PHCs in that district. Across Odisha, a large majority of PHC’s record no inpatient admissions at all in a given month, the state average is 69.8%, meaning about seven in every ten PHCs functioned as outpatient-only facilities during the reporting period year on the comparison, districts differ sharply. Cuttack (94.5%) and Baleshwar and Khordha (93.2% each) — three of Odisha’s more urbanised districts have the highest share of non-functioning-for-IPD PHCs. Malkangiri (18.5%), Gajapati (40.9%), and Nabarangapur (43.9%) — three tribal-majority, more remote districts have the lowest.The gap between the highest and lowest districts is substantial of a 76-percentage-point difference between Cuttack and Malkangiri. This pattern runs counter to the assumption that urban, well-resourced districts should show stronger facility functionality. A reasonable explanation is that in urbanised districts, patients bypass PHCs in favour of District Hospitals or private facilities for inpatient care, leaving PHCs to function only as outpatient/referral points, while in remote districts with fewer alternative options, PHCs are used more fully for the services they are capable of providing.
This finding shows that a facility’s mere existence (a PHC count) does not indicate how functionally used that facility is. This supports the core argument of the study: infrastructurecounts alone are an incomplete measure of a district’s healthcare capacity, and functional performance data should be read alongside facility counts, not instead of an outcome measure, to correctly interpret infrastructure-outcome gaps.
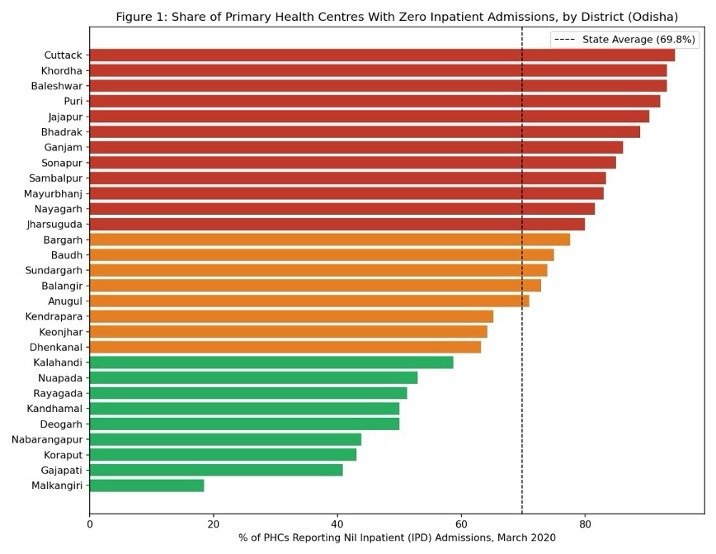
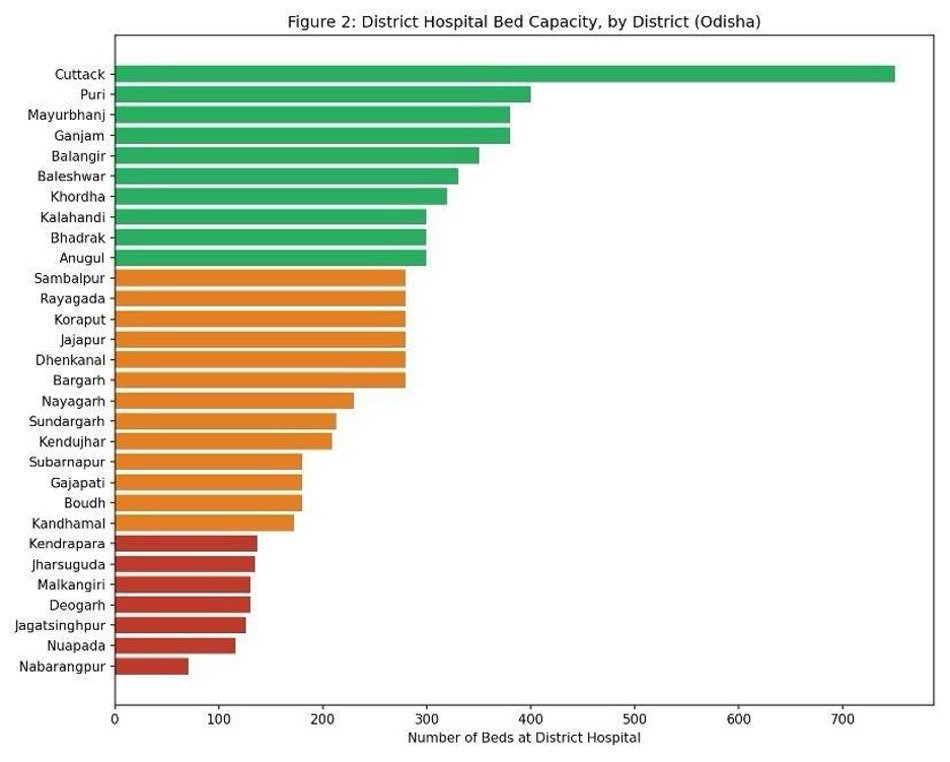
Figure 2: District Hospital Bed Capacity, by District (Odisha)
Source- Ministry of Health and Family Welfare, Department of Health ,Govt. Of Odisha
This data examines the district hospital bed capacity. Figure 2 presents a comparative analysis of bed strength, depicting which districts are well-equipped and which regions face critical deficits, especially in the context of tribal and remote areas.
The analysis of hospital bed capacity across districts reveals regional disparity. Cuttack district emerges as a clear outlier with approximately 750 beds, which is double the capacity of the next highest district, Puri with around 400 beds. Districts such as Mayurbhanj, Ganjam, Balangir and Baleshwar follow with a capacity ranging between 320 to 380 beds, indicating a relatively stronger infrastructure in these regions.
The data highlights a critical gap in several interior and tribal-dominated districts. The bottom seven districts, including Kendrapara, Malkangiri, Deogarh, Nuapada and Nabarangpur, have a bed capacity of less than 140. Nabarangpur records the lowest with only about 70 beds, which is less than ten percent of Cuttack’s capacity. Similarly, districts like Kandhamal, Gajapati, Boudh and Subarnapur fall in the lower-middle range with 165 to 230 beds. This pattern indicates that while coastal and economically advanced districts are well-equipped, the remote and tribal areas remain underserved, pointing towards the need for more equitable distribution of health resource.
Range-wise Performance of Doctor–Population Ratio
Source: Ministry of Health and Family Welfare, Government of India, Rural Health Statistics 2020–21.
The available district-level data from Rural Health Statistics 2020–21 show variation in doctor–population ratios across Odisha’s public health facilities. The reported ratios vary by facility type, with District Hospitals (DHs) serving smaller population-to-doctor ratios than Community Health Centres (CHCs) and PHCs. Across the surveyed districts, the ratios ranged from 397 population per doctor in Anugul to 44,567 in Balangir, while CHC ratios ranged from 185 in Ganjam to 215,191 in Bhadrak. PHC ratios also showed considerable variation, ranging from 30,411 in Gajapati to 103,795 in Ganjam.Overall, the results show gap in the availability of doctors across public healthcare tiers and districts. Consequently, the available data lacks full coverage for all l districts, these findings should be interpreted as indicative rather.
Table 3: Specialist Doctor Vacancies at Community Health Centres, by District
Source: Odisha Health and Family Welfare Minister’s Assembly response, December 2024, reported by PTI/ETHealthworld and The Week.
Description: Number of vacant sanctioned specialist doctor posts at CHCs, for the districts named in the Assembly disclosure, against the state level total of 375 CHCs and 1,500 sanctioned specialist posts.
Statewide, only 386 of 1,500 sanctioned specialist posts were filled as of December 2024, a vacancy rate of over 74%. This is a state average, but the districts named in the Assembly disclosure show the shortfall is not spread evenly. Deogarh has only 1 specialist in position against 16 sanctioned posts, a vacancy rate of 94%. Rayagada, a tribal majority district, has only 3 specialists against 44 sanctioned posts, 93% vacancy rate. Mayurbhanj has 88 vacant specialist posts, Ganjam has 87, and Bargarh has 53.
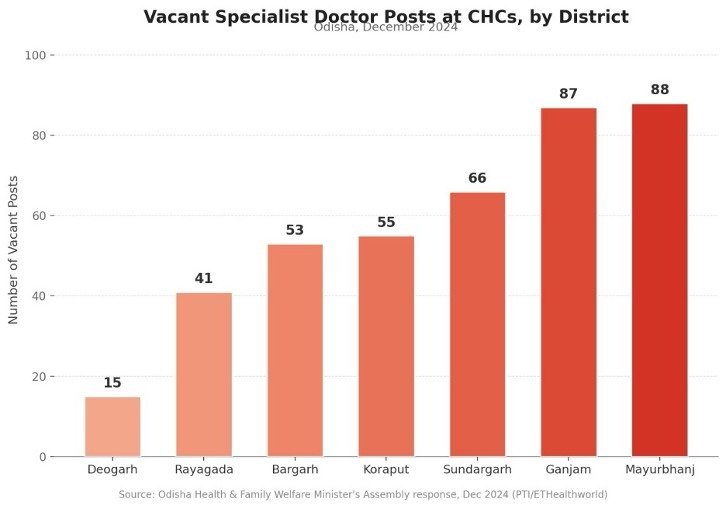
Read against existing data, Physical capacity, meaning PHCs, CHCs, and hospital beds, and functional capacity, meaning staffed positions and actual usage, don’t align well. This is visible for Mayurbhanj and Ganjam, since both appear as districts with stronger bed capacity. If those same districts are also carrying significant specialist vacancies, then bed capacity alone overstates what a district can actually deliver.
In Prinja and colleagues, it was found that doctor vacancies in Punjab and Haryana traced back to recruitment delays than a lack of sanctioned posts, and that describes almost exactly for this study. 1,500 posts were sanctioned, but three in four of those posts sit empty. That is a staffing and administrative capacity gap paired with infrastructure.
Note on data coverage: the districts shown are only the ones specifically named in the Assembly response, not all 30 districts of Odisha. Deogarh and Rayagada are the only two districts with a full sanctioned, filled, and vacant breakdown reported.
24×7 PHC Functionality
Data Availability Note
Unlike the indicators above, 24×7 PHC functionality could not be scored at district level for this study. The only figure available is a statewide count, 1,234 PHCs and 376 CHCs as of July 2026 per the NHM Odisha live dashboard, with no breakdown of facilities. If most PHCs already function as outpatient only facilities in practice, then 24×7 functionality, which is a formal operational label, may not line up cleanly with actual service delivery even where the data does exist. Without district level figures, this indicator is treated as a limitation of the current dataset and the specialist vacancy data in Table 3 is used as the main evidence for staffing related capacity gaps.
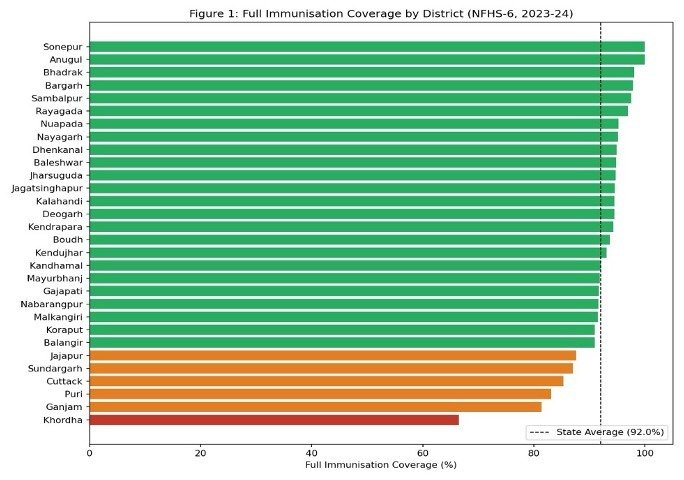
Table 4. Full Immunisation Coverage, by District
Source: National Family Health Survey-6 (NFHS-6), Odisha State & District Compendium, IIPS, 2026.
Description: Percentage of children aged 12-23 months fully immunised, based on vaccination card or mother’s recall, for each of Odisha’s 30 districts.
Full immunisation coverage across Odisha forms the average of 92.0%, with most districts clustered between 85% and 98% on grading. One district breaks from this pattern. Khordha, the district containing Bhubaneswar, Odisha’s state capital, and the strongest-performing district on other indicator in this dataset, records only 66.5% full immunisation coverage, which is the lowest of all. Khordha’s immunisation rate is 25.5 percentage points below the next-lowest district, Ganjam and 33.7 points below the state average, forming a significant gapKhordha’s strength on delivery-related indicators (institutional births, skilled birth attendance) suggests the district’s facility infrastructure and delivery-stage care are functioning well. Its lacking on immunisation coverage, points to a problem isolated to routine immunisation follow-up, plausibly linked to urban population mobility, migrant populations who are harder to track for schedules, or gaps in outreach programmes.
This finding can be interpreted in two ways. First, it presents that a district can appear to perform well overall while concealing a severe, indicator-specific failure. Second, it shows outcome gaps are not simply a rural-versus-urban story: Odisha’s most urbanised district has the state’s worst immunisation coverage.
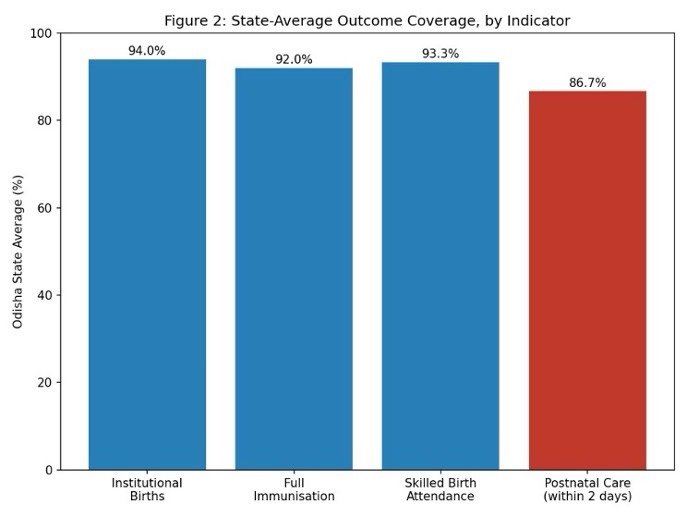
The vertical bar graph represents the three indicators – institutional births (94.0%), skilled birth attendance (93.3%), and full immunisation (92.0%) across the districts. The data suggests a consistent “drop-off after delivery” pattern across health system: care is comparatively strong up to and during childbirth, but follow-up care in the immediate days is weaker. This points toward a statewide structural or service-delivery gap than a completely district-level infrastructure gap,. It suggests that closing Odisha’s outcome gaps will require attention to post- delivery follow-up systems specifically, not just delivery-point infrastructure.
Discussion
Placed side by side, the three infrastructure layers examined in this study, facility functionality, bed capacity, and specialist staffing do not show consistent findings, and that inconsistency is the central here. Cuttack has the state’s worst PHC functionality (94.5% nil IPD performance) but also its largest hospital bed capacity, suggesting patients bypass smaller facilities for its central hospital rather than the district being in true crisis. Malkangiri shows the opposite: strong PHC functionality but weak bed capacity, yet lands on a similar outcome grade. Nabarangpur is the one case where infrastructure and outcomes move together as expected, lowest bed capacity, one of only three districts in the “Medium Priority” outcome band — which provide credibility to the more surprising mismatches seen elsewhere. Specialist staffing adds a further layer: Mayurbhanj and Ganjam both have comparatively strong bed capacity but the highest specialist vacancy counts in the state, supporting Prinja et al.’s finding, that doctor shortages often arise from recruitment delays rather than missing posts. Khordha’s case is a useful caution: its immunisation rate (66.5%, the state’s worst) gets masked entirely by its strong scores elsewhere once averaged into one overall grade, showing that a composite score can hide a serious, isolated problems.
Together, these findings support this study’s core argument: infrastructure counts, functionality, and staffing each capture a different part of district healthcare capacity, and no single one of them, read alone, would have accurately predicted outcomes in districts like Cuttack, Malkangiri, or Mayurbhanj.
Conclusion
Overall, the findings show that healthcare infrastructure and the outcomes in Odisha do not always move together. Facility functionality, bed capacity, and specialist staffing reveal different aspects of district-level healthcare, making it difficult to judge performance through any single indicator. This highlights the need for a more balanced and targeted approach to public health investment. This study finds district-level variation in infrastructure, utilisation, human-resource capacity, and outcomes across Odisha. The evidence shows that structural availability does not necessarily translate into comparable service utilisation.
Human-resource capacity reinforces the distinction. Doctor-population ratios vary substantially across districts, while only 386 of 1,500 sanctioned specialist posts were filled statewide in December 2024, with particularly high vacancies in few districts. Thus, physical or sanctioned capacity does not represent operational capacity, as observed with data. Health outcomes reveal further internal disparities. The postnatal care being low at 86.7% of Khordha illustrates this mismatch particularly clearly: despite strong delivery-related performance, its full immunisation coverage is only 66.5%, the lowest among the districts examined. This demonstrates that weaknesses may occur at specific stages of the healthcare and cannot be adequately captured through aggregate performance alone, with the observed pattern also indicating a potential drop in care after delivery.
Overall, the findings are consistent with the literature suggesting that infrastructure, financing, human resources, and governance interact in shaping health-system performance. By comparing district-level capacity and outcomes while treating financing and governance as contextual factors, the study identifies important mismatches between capacity and outcomes. The findings suggest that districts may face different constraints involving physical capacity, staffing, utilisation, governance and monitoring, or service-specific gaps.
These findings support a more targeted approach to equitable public health investment. Resource allocation should consider whether constraints arise from structural shortages, workforce gaps, underutilisation, governance and monitoring gaps, or specific service failures, than depending solely on facility counts or aggregate outcomes.
The conclusions remain subject to important limitations: infrastructure indicators span 2020-2024, specialist vacancy data are available only for districts named in the Assembly disclosure, district-level 24×7 PHC functionality could not be assessed, and bed capacity does not capture staffing, equipment, quality, or utilisation. The descriptive, Odisha-specific design also limits causal inference and wider generalisation.Ultimately, equitable public health investment cannot be assessed simply by how much infrastructure a district possesses. It requires examining whether that infrastructure is functional, adequately staffed, utilised, and translated into sustained and equitable health outcomes. This shift from measuring the presence of healthcare capacity to examining its effective conversion into health outcomes is the central contribution of the study and provides a stronger basis for identifying where district-level public health investment is most needed.
References
Balarajan, Y., Selvaraj, S., & Subramanian, S. V. (2011). Health care and equity in India. The Lancet, 377(9764), 505–515.
Chatterjee, U., & Smith, O. (2021). Going granular: Equity of health financing at the district and facility level in India. Health Systems & Reform.
Das, T. (2024). Role of public health expenditure on health infrastructure and manpower in India: A state-level analysis of the nexus between indicators. Indian Journal of Human Development, 18(2), 242–266.
Desai, S., & Wu, L. (2010). Structured inequalities—Factors associated with spatial disparities in maternity care in India. Margin: The Journal of Applied Economic Research, 4(3), 293–319.
Dwivedi, R., & Pradhan, J. (2017). Does equity in healthcare spending exist among Indian states? Explaining regional variations from national sample survey data. International Journal for Equity in Health, 16(1), 15.
George, A., Scott, K., Garimella, S., et al. (2021). Decentralized decision-making and accountability in district health systems. BMJ Global Health.
Government of Odisha. (2021). Bed capacity report, Department of Health & Family Welfare [Data set]. Ministry of Health & Family Welfare, Government of Odisha.
Government of Odisha. (2024, December). Specialist doctor vacancies at Community Health Centres: Assembly response [Legislative disclosure]. Department of Health & Family Welfare.
Hati, K. K., & Majumder, R. (2013). Health infrastructure, health outcome and economic wellbeing: A district level study in India.
International Institute for Population Sciences. (2026). National Family Health Survey-6 (NFHS-6), 2023–24: Odisha state & district compendium. Ministry of Health & Family Welfare, Government of India.
Kumar, S., & Reshmi, P. R. (2022). Availability of public health facilities and utilization of maternal and child health services at district level.
Ministry of Health & Family Welfare. (2021). Rural Health Statistics 2020–21. Government of India, Health Management Information System (HMIS), National Health Mission. https://nrhm-mis.nic.in/hmisreports/frmstandard_reports.aspx
Mohanty, R. K., & Behera, D. K. Heterogeneity in health funding and disparities in health outcome: A comparison between high focus and non-high focus states in India.
Mor, N., & Shukla, S. K. Estimating funds required for UHC within Indian States.
National Health Mission, Odisha. (2026, July). NHM Odisha live dashboard [Data set]. Government of Odisha, Department of Health & Family Welfare.
NITI Aayog. (2018). Aspirational Districts Programme. Government of India.
NITI Aayog & WHO India. (2021). Decentralization and health service delivery in India: District governance matters.
Panda, B., & Thakur, H. P. (2016). Decentralization and health system performance—A focused review of dimensions, difficulties, and derivatives in India. BMC Health Services Research, 16(561).
Panda, B. K., Kumar, G., & Awasthi, A. (2020). District level inequality in reproductive, maternal, neonatal and child health coverage in India. BMC Public Health, 20(58), 1–14.
Prinja, S., Gupta, A., Bahuguna, P., et al. (2016). Governance failures vs. resource scarcity in Punjab and Haryana.
Public Health Foundation of India. (2022). Output gaps in public health: Role of district governance in resource allocation.
Purohit, B. C. Inter-state disparities in health care and financial burden on the poor in India.
Rammohan, A., & Awofeso, N. (2015). District-level variations in childhood immunizations in India: The role of socio-economic factors and health infrastructure. Social Science & Medicine, 145, 163–172.
Ravindran, T. K. S., & Seshadri, T. (2018). A health equity research agenda for India. Health Research Policy and Systems, 16(Suppl 1).
Scott, K., George, A. S., Ved, R., et al. (2020). The role of district health governance in health system performance. Health Policy and Planning.
Selvaraj, S., Karan, A. K., Mao, W., et al. (2021). Did the poor gain from India’s health policy interventions? Evidence from benefit incidence analysis, 2004–2018. International Journal for Equity in Health.
Yadav, J., Devi, S., Singh, M. N., Manchanda, N., & Moradhawaj. Health care utilization and expenditure inequities in India: Benefit incidence analysis.