IISPPR

Category: FINANCE

FINANCE
Shaana Faizal

INDIA’S RISING IMPORT TARIFFS SINCE 2014 UNDER THE MAKE IN INDIA POLICY: AN EMPIRICAL ASSESSMENT OF THEIR IMPACT ON IMPORT VOLUMES AND DEPENDENCE ON CHINESE GOODS

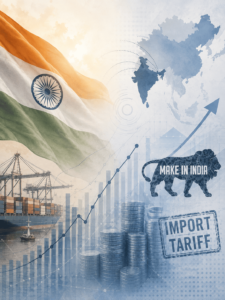
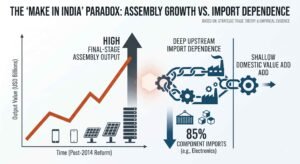
Authors: SK Sanjana Chithambaram, KR Valliammai, Soumya Mittal, Shaana Faizal, Samanvi Mandapati, Manya Hegade S ABSTRACT This study examines whether India’s import tariff increases under the Make in India policy, launched in September 2014, achieved the stated objective of reducing dependence on foreign goods, particularly from China. Using product-level tariff and trade data from the World Bank’s WITS database for 2010–2023, we have analyzed and applied tariff rates, import volumes, and China’s share of India’s imports. Findings here indicate that tariffs rose sharply in the year 2018–2019, with the China-specific weighted average peaking at approximately 8.16% and the simple average reaching 12.2%, yet this had no discernible effect on aggregate import volumes, which continued to grow. China’s share of India’s imports similarly rose from 11.1% to 16.1%, directly contradicting the policy’s geopolitical rationale. A Pearson correlation test was made betweenChina-specific tariff rates and import volumes from China, yielding r = –0.12 (p ≈ 0.72), confirming no statistically significant relationship. The paper portrays a contrast between two sectors through comparative case analysis. The mobile phone/electronics sector, supported by the Production-Linked Incentive (PLI) and the Phased Manufacturing Programme (PMP), saw measurable success. In contrast, the solar panel industry still relies on Chinese imports for over 80% of cell and module requirements despite the tariffs. These outcomes hence illustrate that tariff policy alone is insufficient without complementary industrial capacity-building through supply chain development, technology transfer, and firm-level capabilities. Keywords: Make in India, import tariffs, trade policy, import dependence, China, mobile phones, solar panels, Production-Linked Incentive, protectionism, WITS database 1. INTRODUCTION India’s trade policy has shifted markedly since the year 2014. The Make in India initiative, launched in September 2014, departed from the post-1991 liberalization agenda toward a more interventionist, protectionist approach aimed at boosting domestic manufacturing and reducing import dependency, particularly on China (Athukorala, 2020; Panagariya, 2024). The primaryinstrument used was the import tariff. Between the year of 2014 and 2023, India raised customs duties across multiple sectors, with the steepest hikes occurring in the year 2018–2019 Union Budget; this added 5–15% duties on items ranging from mobile phones and automobile components to textiles and agricultural products (Athukorala, 2020). The simple average tariff peaked at 12.2% during this period, while the aggregate weighted average reached 7.32% in 2015 and the China-specific weighted average peaked at approximately 8.16% in 2020, marking a substantial reversal of the post-1991 liberalization trajectory. This paper hence addresses the question of whether this protectionist strategy achieved its intended objectives. Existing research has documented the shift toward protectionism but largely stopped short of evaluating its outcomes. Panagariya (2024) notes the rise in average import tariffs since 2014, with peaks reaching 12.5% for automobiles, and warns that this trend could jeopardise long-term manufacturing competitiveness. Athukorala (2020) here similarly argues that post-2014 trade policy deviates from the 1991 liberalisation approach, contending that the tariff increases risk jeopardising India’s competitiveness and its integration into the global value chains. Chaudhury (2022) finds that structural obstacles prevented Make in India from attracting substantial foreign direct investment, suggesting that tariff increases alone are insufficient without a parallel improvement in manufacturing capability. Rawat et al. (2021) compare India and China through sectoral case studies and find that while mobile phone manufacturing benefited from tariff protection and the Phased Manufacturing Programme, India’s broader manufacturing performance remains weak, constrained by gaps in infrastructure, productivity, and industrial capacity. Chaudhary (2025) and Chaudhry, Sharma, and Chaudhery (2025) further highlight the persistent imbalances in India–China bilateral trade, noting that it continued its reliance on Chinese imports across several sectors despite policy interventions. None of these studies, however, empirically tested whether tariff hikes actually reduced India’s aggregate import dependence or China’s share of India’s imports; they only described the policy and its structural context without assessing the outcomes against stated goals. This paper, drawn from data of fourteen years at a product-level (2010–2023) from the World Bank’s WITS database, addresses the four research questions: Did India’s average import tariffs rise after 2014? Did higher tariffs reduce total import volumes? Did dependence on Chinese imports decline following tariff increases? Is there a statistically significant relationship between the tariff levels and import dependence? To ground the aggregate analysis in this sectoral reality, the study hence examines two contrasting sectors: mobile phones/electronics and solar panels. The mobile phone sector, supported by the Phased Manufacturing Programme (2017) and the Production-Linked Incentive scheme (2020), is widely known as the Make in India success. Domestic electronics production rose from ₹1.90 lakh crore in FY2015 to ₹9.52 lakh crore in FY2024, with nearly 99% of smartphones sold in India being produced domestically by FY2024. Exports grew from a negligible base in FY2016 to ₹88,726 crore by FY2023, and manufacturing facilities expanded from 3 in 2014 to 268 units by 2018. The solar panel sector illustrates the limits of the tariff-driven policy: despite the 25% basic customs duty on cells and 40% on modules (April 2022), the Approved List of Models and Manufacturers, and an expanded PLI allocation (₹4,500 crore to ₹24,000 crore), India yet remains heavily dependent on Chinese imports which are constrained due to technology dependence, limited manufacturing capacity, high capital costs, and low R&D investment. This underscores that tariffs alone are insufficient, absent complementary factors such as supply chain ecosystems, technology transfer, and firm-level capabilities. Research objective This study pursues two central objectives. First, it empirically assesses India’s aggregate and sector-specific tariff trajectory from 2010 to 2023 to determine whether the tariff increases introduced under the Make in India policy translated into measurable reductions in India’s import dependence on China at the product and sectoral levels. Second, through a comparative case study of the mobile phone/electronics and solar panel sectors, it examines why tariff protection succeeded in reducing Chinese import dependence in one sector but failed in the other, identifying supply chain ecosystem development, technology transfer, and firm-level capabilities as complementary factors that mediate the effectiveness of tariff policy as a tool of import substitution. 2. LITERATURE REVIEW This section discusses key perspectives and prior research on

Read More »
FINANCE
Abida Bilal

Did Make in India Protect Domestic Manufacturers? Evidence from Effective Rates of Protection (2005-2023), with a focus on the Mobile phone, Television, Automobile, and Air Conditioner Industries.

The paper examines whether India’s post-2014 Make in India tariff hikes actually protected domestic manufacturers or created an inverted duty structure instead. Using Corden’s ERP formula across four electronics/auto sectors from 2005–2023 (tariff data from WITS, cost shares from the 2015–16 Input-Output Table), it finds mobile phones as the standout case of policy failure: ERP was negative for over a decade because finished phones faced near-zero duty while their components were taxed higher, only flipping positive in 2019 when output tariffs rose to 7.5%. Televisions and ACs stayed positively protected throughout, and automobiles’ high ERP predates 2014 entirely. An import-value cross-check shows declines in phones and ACs coinciding with the 2019 tariff change, though PLI incentives and COVID complicate attributing causation. Bottom line: Make in India’s flagship electronics sector spent years effectively penalizing the domestic assembly it was designed to support.

Read More »
FINANCE
Naina Bath

India’s rising import taxes since 2014 under the Make in India policy to reduce dependence on foreign goods.

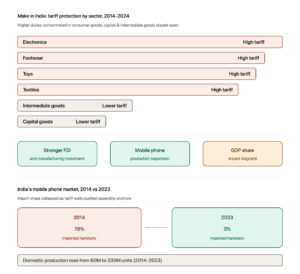
A decade of rising import tariffs under Make in India built real capacity — mobile phone imports fell from 78% to 3% of the market, FDI into manufacturing crossed $148 billion, and consumer sectors like electronics and textiles saw the strongest protection. Yet manufacturing’s GDP share stayed flat at 14–17%, and inverted duty structures kept raising costs for import-dependent industries, curbing export competitiveness. The study concludes tariffs alone can’t drive sustained manufacturing growth without complementary infrastructure, technology, and PLI-based support.

Read More »
FINANCE
Harshita Gupta

A POLICY REVIEW OF MAKE IN INDIA INITIATIVE FOR YEARS 2014-2024 – HOW IT FELL SHORT TO ACHIEVE ITS TARGET OF BROAD-BASED MANUFACTURING COMPETITIVENESS 

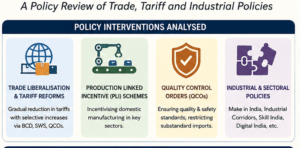
This policy review evaluates the effectiveness of the Make in India initiative (2014–2024) in strengthening India’s manufacturing sector. It examines the differential impact of industrial policies on MSMEs and large firms, while assessing how tariff and non-tariff measures have influenced export competitiveness, manufacturing diversification, and integration into global value chains.

Read More »
FINANCE
Kasturi Bordoloi

Artificial Intelligence in Financial Services: Impact on Employment, Economic Transformation, and Workforce Adaptation

1. Labor Market Dynamics & Task Displacement
Acemoglu, D., & Restrepo, P. (2020). Robots and jobs: Evidence from US labor markets.
“We estimate robust negative effects of robots on employment and wages across commuting zones… dynamically, the displacement effect dominates the reinstatement effect in industries undergoing rapid automation. While new tasks are created, they do not immediately absorb the specific demographic groups displaced from routine manual and clerical tasks, leading to localized labor market distress and a drop in the labor share of income.”

Application for your paper: Perfect for Section 4 (Impact on Employment). It provides empirical proof that the “displacement effect” frequently outpaces the “reinstatement effect” for entry-level and clerical roles, validating your point about the removal of the lower rungs of the occupational ladder.

Frey, C. B., & Osborne, M. A. (2017). The future of employment: How susceptible are jobs to computerisation?
“Our findings suggest that a substantial share of employment in acute financial services—particularly telemarketing, data entry, and credit brokerage—falls into the high-risk category (over 70% probability of automation). As algorithms become more capable of handling unstructured data and complex pattern recognition, occupations that rely heavily on codifiable, routine data processing will experience rapid contraction.”

Application for your paper: Directly anchors Section 2.2 and Section 4. This gives you concrete risk probabilities to contrast against the more optimistic “augmentation” theories.

2. The Augmentation & Efficiency Paradigm
Brynjolfsson, E., & McAfee, A. (2017). The business of artificial intelligence.
“The most important misconception about AI is that it will simply replace humans. Over the next decade, AI will blend into workflows as a powerful complement. Machine learning excels at supervised learning tasks (mapping inputs to outputs), but lacks capabilities in emotional intelligence, high-level strategic planning, and creative problem-solving. The greatest performance gains occur when human judgment is augmented by algorithmic scale.”

Application for your paper: Supports your analysis of retained roles in Section 4 and Section 8 (Discussion), justifying why senior client-facing and strategic roles remain resilient.

Arner, D. W., Barberis, J., & Buckley, R. P. (2016). The evolution of fintech: A new post-crisis paradigm?
“FinTech 3.0 is characterized not by the tools themselves, but by the systemic shift from human-mediated financial infrastructure to automated, data-driven architecture. This post-crisis paradigm forces traditional banking institutions to transition from labor-intensive risk management to real-time, algorithmic compliance and disintermediated consumer platforms to maintain market viability.”

Application for your paper: Strengthens Section 2.1 and Section 3, linking your industry examples (like JPMorgan’s contract analysis and Bank of America’s Erica) to a broader structural evolution in global banking.

3. Macroeconomics, Inequality, and Skills
World Economic Forum. (2023). The Future of Jobs Report 2023.
“Analytical thinking and creative thinking remain the most important skills for workers in 2023… Within financial services, the fastest-growing roles are driven by technology and data, specifically Data Analysts, AI and Machine Learning Specialists, and FinTech Engineers. Conversely, the largest absolute job declines are expected in clerical and administrative roles, including Bank Tellers, Data Entry Clerks, and Postal Service Clerks.”

Application for your paper: Provides the exact statistical and occupational alignment needed for Section 5 (Economic Implications) and Section 6 (Emerging Occupational Areas).

International Monetary Fund. (2022). World Economic Outlook.
“AI adoption acts as a double-edged sword for aggregate productivity. While it significantly boosts Total Factor Productivity (TFP) by optimizing capital allocation and reducing frictional transaction costs in core sectors like finance, it simultaneously risks exacerbating labor income polarization. Economies lacking agile retraining frameworks will experience a widening wealth gap between capital owners and low-skill labor forces.”

Application for your paper: Ideal backing for Section 5 (Economic Implications) to balance the discussion on GDP growth with structural risks like wealth concentration.

World Bank. (2021). World Development Report 2021: Data for better lives.
“Data creates value by improving policies, driving economic efficiencies, and empowering individuals. However, the realization of this value is highly unequal. Poor infrastructure, data fragmentation, and a lack of baseline digital literacy threaten to leave marginalized populations further behind, transforming the digital dividend into a digital divide unless public policy actively fosters inclusive data systems.”

Application for your paper: Strongly supports your arguments on financial inclusion and public digital infrastructure in Section 5 and Section 7.3 (Policy-Level Adaptation).

Read More »
FINANCE
aditya phad

Revolutionising Fintech with AI: Addressing Fraud, Privacy, and Sustainability in a Digitised Financial World

AI is transforming fintech by tackling fraud, enhancing data security, and driving financial sustainability. Machine learning enables real-time fraud detection, while encryption and regulations like GDPR safeguard consumer privacy. AI-powered solutions also expand financial access in underserved markets, fostering greater inclusion. However, challenges like algorithmic bias and regulatory complexities remain. The future of fintech will be shaped by hybrid AI-human models, explainable AI (XAI), and evolving regulatory frameworks, ensuring a balance between innovation, security, and ethical responsibility.

Read More »