Authors:
Lusha Katkam, Deepika Boora, Sameeksha Mahajan, Gayatri Ramesh, Tanvi Darji, Shivangi Agrawal, Sathipriya Kumar,Abhishek Joseph, Mudavath Prakash
Abstract
This study assesses the impact of the ASEAN-India Trade in Goods Agreement (AITIGA) on India-ASEAN trade volumes and examines what the observed trade pattern implies for India’s economic growth. It combines descriptive trade analysis, country-level and sectoral analysis, an assessment of external shocks and a gravity-model framework to examine how India-ASEAN trade has evolved, how exports and imports have diverged, how concentrated trade is across partner countries, and which factors are associated with bilateral trade flows. Trade rose substantially in the post-AITIGA period, which points to deeper commercial integration, but the growth was uneven: imports grew faster than exports and the trade deficit widened. Trade is concentrated in a handful of partner countries and is shaped by sectoral differences, export competitiveness, infrastructure constraints and external shocks.
In the gravity model, partner-country GDP is the factor most strongly associated with bilateral trade. The AITIGA indicator has no usable variation in the final estimation sample, so the model does not yield an estimate of the policy effect and the study makes no causal claim about AITIGA. Higher trade volumes also do not translate automatically into proportionate economic growth. Trade facilitation, rules of origin, value addition and export competitiveness determine how much of the gain reaches the domestic economy. The study concludes that AITIGA is associated with greater India-ASEAN commercial integration, but that wider economic benefits depend on domestic policies that strengthen India’s export and productivity capacity.
1. Introduction
1.1 Background of the Study
India’s economic relationship with the Association of Southeast Asian Nations (ASEAN) has grown over three decades from a foreign-policy initiative into one of the country’s most important regional trade partnerships. It began with the Look East Policy of 1991, launched alongside India’s domestic economic liberalisation and later broadened into the Act East Policy to cover security and connectivity as well (Baru, 2001). Trade grew well before any binding agreement existed. ASEAN’s share of India’s total trade rose from roughly 4% in the 1970s to over 8% by the 1990s, and bilateral trade expanded at 11.2% a year between 1993 and 2003 (Baru, 2001; Varma, 2015). Formal institutions came later: the 2003 Framework Agreement, the 2009 comprehensive agreement, and the entry into force of AITIGA on 1 January 2010 (Varma, 2015).
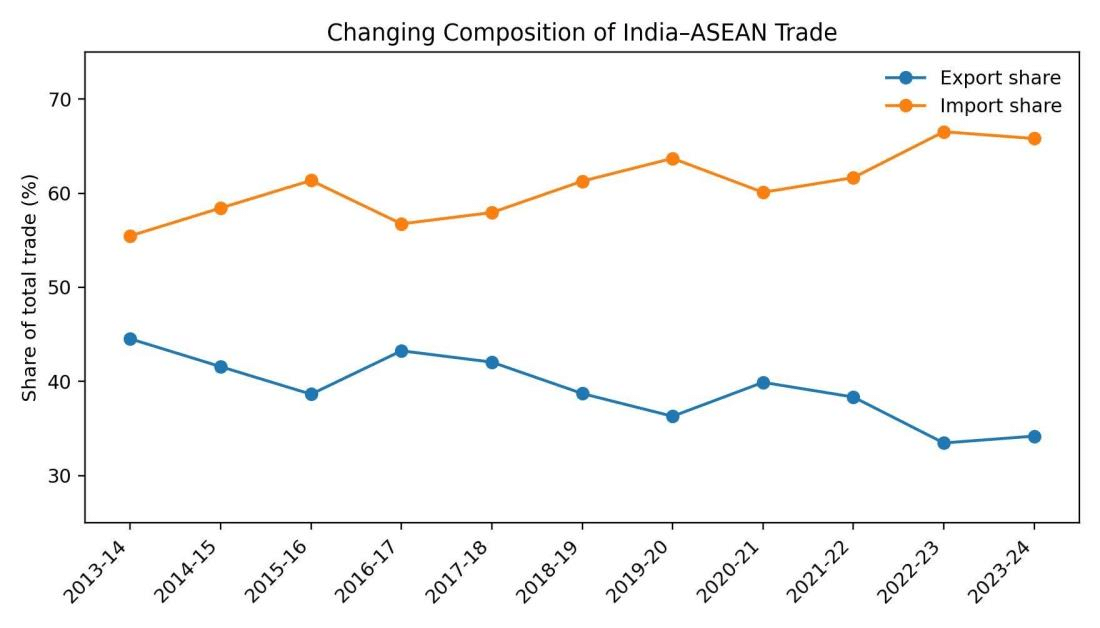
AITIGA aimed to deepen bilateral trade by cutting tariffs and improving market access. Merchandise trade has since risen from US$74.41 billion in FY2013-14 to US$120.54 billion in FY2023-24 (DGCI&S data, as reported in Seshadri, 2022; Vietnam News Agency, 2024). The growth has been lopsided. Over the same period India’s imports from ASEAN rose by 92.2% (a compound annual growth rate, CAGR, of 6.8%), while exports rose by only 24.4% (CAGR of 2.2%). The bilateral merchandise deficit widened from US$8.15 billion to US$38.12 billion, the import share of total trade climbed from 55.5% to 65.8%, and the export share fell from 44.5% to 34.2%. The central question is whether AITIGA has driven balanced trade expansion, or has mainly reinforced an existing asymmetry in which ASEAN suppliers gained ground in India’s import basket while Indian exports lagged.
1.2 Statement of the Problem
Existing studies are mixed and mostly cautious about AITIGA’s performance. Gravity-model work using a Heckscher-Ohlin and Linder framework finds that India’s trade growth was in some respects higher before AITIGA than after, and that trade liberalisation and foreign direct investment did not robustly support India’s external-sector growth (Singh, Kumar, Kumari, & Singh, 2022). Tham and Kam (2014) find that tariff liberalisation favoured ASEAN’s exports to India, with high trade costs holding back Indian export competitiveness. More recent assessments report a continuing widening of India’s deficit with ASEAN and attribute it to weak rules of origin and divergent tariff liberalisation schedules (Krishnamurthy, 2025; Seshadri, 2022). Hye and Lau (2015) find a negative long-run but positive short-run relationship between trade openness and economic growth in India, so greater openness cannot be assumed to bring lasting benefits.
Infrastructure and trade facilitation also matter. India relies on Singapore, Malaysia and Sri Lanka for maritime transshipment, and its main container port performs relatively weakly, which limits its ability to use AITIGA’s tariff preferences (Research and Information System for Developing Countries, 2014). India has made real progress on facilitation: average import dwell time fell from 32.4 days in 2015 to 2.6 days in 2022 after a supply-chain visibility platform was adopted (Arvis et al., 2023), and regional evidence suggests that a 1% improvement in trade facilitation is associated with more than 1.5% growth in trade (Asian Development Bank & UNESCAP, 2024). Trade has also been buffeted by shocks unrelated to the agreement, including COVID-19, the Russia-Ukraine war and the disruption of Suez Canal shipping after 2023 (Nicita & Saygili, 2021; World Bank, 2022; International Monetary Fund, 2024).
Three gaps remain. First, no study examines how domestic infrastructure and trade-facilitation deficits interact with the tariff-related constraints already identified. Second, national aggregates hide regional differences within India, notably in Northeast India, which is closest to ASEAN yet is widely thought not to have gained in proportion. Third, assessments of AITIGA rarely account explicitly for the external shocks above, so the agreement’s effect may have been overstated or understated.
1.3 Research Objectives
The study pursues five objectives. The first is to examine trends in India-ASEAN bilateral trade, exports, imports and the trade balance before and after AITIGA. The second is to disaggregate these trends by product group to see whether particular sectors explain the asymmetry. The third is to compare ASEAN’s position in India’s imports with that of non-ASEAN suppliers, as an indicative test of trade creation versus trade diversion. The fourth is to estimate an augmented gravity model relating bilateral trade to conventional determinants such as GDP, population and exchange rates, and to discuss trade-facilitation and infrastructure constraints alongside the results. The fifth is to place these findings in the broader literature on trade openness and economic growth, since a causal AITIGA-growth relationship cannot be estimated from the available data.
1.4 Significance of the Study
This study looks beyond a purely tariff-based evaluation of AITIGA. It considers the roles of infrastructure, trade facilitation and external shocks in shaping bilateral trade, examines patterns by partner country and product group, and states openly the limits of a before-and-after comparison around 2010. The aim is a more balanced and methodologically transparent account of the agreement’s performance than earlier assessments have offered.
1.5 Structure of the Study
Section 2 reviews the literature on India-ASEAN economic relations, AITIGA’s empirical record, infrastructure and trade facilitation, and external shocks. Section 3 sets out the research design, data and gravity-model methodology. Section 4 presents the descriptive and econometric findings. Section 5 discusses the findings and Section 6 concludes.
2. Literature Overview
India’s engagement with ASEAN dates from the 1991 Look East Policy, recast in 2014 as the Act East Policy, and is now a pillar of the country’s regional strategy. It matters for trade and for wider strategic ties with Southeast Asia. This section reviews the literature under four themes: the evolution of the relationship and its policy framework, empirical evidence on AITIGA’s trade outcomes, infrastructure and trade facilitation, and external shocks. The studies document the strategic and trade record well, but none links it to an empirical assessment that accounts for infrastructure, trade facilitation and external shocks at the same time.
Theme 1: Evolution of India-ASEAN Economic Relations and Trade Policy Dynamics
India’s engagement with ASEAN began as a foreign-policy shift, not a trade negotiation. Baru (2001) shows that ASEAN’s share of India’s total trade rose from about 4% in the 1970s to over 8% by the 1990s, faster than India’s trade with the rest of the world. Strategic and security considerations ran alongside trade from the outset, and engagement varied widely across ASEAN members, with Singapore, Malaysia and Thailand well ahead as India’s main economic partners in the region.
The legal framework came together more slowly. A Framework Agreement on Comprehensive Economic Cooperation was signed at Bali in 2003, the full agreement followed in 2009, and the Trade in Goods component entered into force in January 2010 (Varma, 2015), almost two decades after the Look East Policy. Trade had already grown by 11.2% a year between 1993 and 2003, so the agreement appears to have formalised an established trajectory rather than started one. The treaty is better read as a codification of momentum than as its origin.
Aggregate figures also hide a competitiveness problem. Using comparative-advantage and market-comparative-advantage measures, Banik and Kim (2024) find that a large share of India’s major exports to ASEAN remain uncompetitive, and that the binding constraint is domestic, in the form of non-tariff distortions, rather than the agreement itself. A favourable treaty cannot substitute for reform at home, and narratives built only around treaty milestones risk overstating what liberalisation can deliver.
Around 2014 the Look East Policy was recast as the Act East Policy, widening the focus from trade promotion to connectivity, security cooperation and strategic partnership. Ghosh (2024) finds that merchandise trade and FDI both rose substantially after the Look East Policy, but that Northeast India, which sits next to ASEAN, saw none of this benefit. Growth there stagnated and in some states declined, even as national figures improved. The gains have not been evenly spread within India.
This body of work traces four phases: strategic reorientation, treaty formation, a persistent competitiveness gap and a broader strategic agenda. It gives comparatively little attention to how external shocks have affected India-ASEAN trade over time, a gap this study addresses by examining major disruptions and trade performance around them.
Theme 2: Empirical Evidence on AITIGA and India-ASEAN Bilateral Trade Outcomes
The empirical record on AITIGA is mixed and mostly cautionary, and the findings differ with the outcome measured. On trade volume and balance, the evidence is consistently unfavourable to India. Using an augmented gravity equation, Tham and Kam (2014) find that tariff liberalisation benefited ASEAN’s exports to India more than the reverse, while persistently high trade costs constrained Indian export competitiveness. Krishnamurthy (2025) and Seshadri (2022) both report a continuing widening of India’s deficit with ASEAN and attribute it to weak rules of origin and divergent tariff liberalisation schedules that favour ASEAN producers.
On growth and macroeconomic effects, the findings are negative to null. A gravity study based on Heckscher-Ohlin and Linder frameworks reports that India’s trade growth rates were higher before AITIGA than after, and that trade liberalisation and FDI did not robustly support external-sector growth (Singh et al., 2022). Hye and Lau (2015) find a negative long-run but positive short-run relationship between trade openness and growth in India, so the benefits of openness are neither uniform nor lasting.
None of these studies reports an unambiguously positive effect of AITIGA for India. The trade-balance studies agree on an unfavourable distribution of gains, and the growth studies split between negative long-run effects and positive short-run ones. AITIGA expanded trade opportunities, but its effect on India’s broader growth remains ambiguous, and the momentum that pre-dated the treaty arguably counted for more than the treaty itself.
Theme 3: Infrastructure, Trade Facilitation and Sustainable Supply Chains
Preferential market access alone cannot produce trade gains without parallel improvements in infrastructure and trade facilitation. This theme therefore moves from the treaty’s tariff architecture to the physical and procedural systems that decide whether Indian exporters can use the preferences on offer. The evidence divides into regional ASEAN studies and India-ASEAN studies, and the latter are scarce.
At the regional level, Bhattacharyay (2009) estimates ASEAN’s infrastructure deficit at US$596 billion against only US$164 billion in private investment, which constrains connectivity and integration. The study predates AITIGA and concerns intra-ASEAN needs rather than India-ASEAN trade. The Asian Development Bank and UNESCAP (2024) report that a 1% improvement in trade facilitation is associated with more than 1.5% growth in trade, which suggests that procedural efficiency matters at least as much as hard infrastructure, and it advocates sustainable supply chains. These findings come from broad regional trends and do not test whether India’s use of AITIGA preferences improved.
India-specific evidence points to domestic bottlenecks. The Research and Information System for Developing Countries (2014) maritime connectivity report notes that about 95% of India’s trade moves by sea, yet India depends on Singapore, Malaysia and Sri Lanka for transshipment and Jawaharlal Nehru Port performs relatively weakly. This reduces export competitiveness and raises the risk of trade diversion, undermining AITIGA’s tariff advantages. Arvis et al. (2023) document India’s progress through digital reforms, with import dwell time falling from 32.4 days in 2015 to 2.6 days in 2022 after a supply-chain visibility platform was introduced. That report assesses logistics performance globally and not its consequences for India-ASEAN trade.
Regional evidence therefore establishes that infrastructure and facilitation matter, while India-specific evidence identifies maritime and logistics constraints but is limited in scope. No study yet assesses empirically how improvements in India’s physical and digital connectivity affect the use of AITIGA preferences and bilateral trade performance.
Theme 4: Exogenous Shocks and Trade Resilience
External shocks affect how any trend in India-ASEAN trade should be read, because they can distort trade data independently of the agreement. Global trade was already weakening before COVID-19. The World Trade Organization (2021) reported that world merchandise trade volume fell by 0.1% in 2019, the first annual decline since the 1.8% contraction during the global financial crisis, with merchandise export values shrinking by 3% to US$18.89 trillion. COVID-19 was a far larger shock: global merchandise trade volume fell by 5.3% in 2020 before rebounding by about 8.0% in 2021, and UNCTAD documented severe disruption to global value chains, shipping networks and ports. India-ASEAN trade shows the same pattern. It fell from US$96.79 billion in 2018-19 to US$86.92 billion in 2019-20 and US$78.91 billion in 2020-21, a decline of about 18.5%. It then rebounded by about 39.9% to US$110.40 billion in 2021-22 and rose to US$131.50 billion in 2022-23.
Trade agreements may cushion such shocks. A UNCTAD regression study covering 139 countries found that trade within a regional trade agreement fell by 5.6 percentage points less than trade outside one after the pandemic, although the difference varied across regions and among developing economies (Nicita & Saygili, 2021). AITIGA may therefore have provided some buffering, but it would not have prevented all fluctuation. Later shocks added to the volatility. The Russia-Ukraine war of 2022 disrupted energy, food and commodity markets, and disruptions to major raw material exports contributed to large rises in global food and energy prices (World Bank, 2022), which can change the dollar value of trade without any change in physical volumes. In late 2023, attacks on shipping in the Red Sea disrupted maritime trade further. UNCTAD estimated that Suez Canal merchandise trade volume fell by 42% in the first two months of 2024 and container tonnage by 82%, and the IMF noted that rerouting around the Cape of Good Hope added more than 10 days on average to delivery times (International Monetary Fund, 2024). India-ASEAN trade fell from US$131.50 billion in 2022-23 to US$120.54 billion in 2023-24.
Literature Summary
Across the four themes, the literature agrees on the strategic importance of the relationship and confirms that AITIGA expanded trade, though with benefits skewed toward ASEAN. It also treats infrastructure and trade facilitation as important constraints and external shocks as sources of volatility. What it does not offer is a direct empirical test of how infrastructure, trade facilitation and external shocks together shape India’s export performance under AITIGA. The causal pathways are largely inferred rather than demonstrated, and regional disparities within India, particularly in Northeast India, remain overlooked despite its proximity to ASEAN.
Research Gap
Four gaps stand out. First, the structural constraints identified in the literature, such as non-tariff distortions and weak rules of origin, are well documented, but the mechanisms through which domestic infrastructure deficits aggravate them in the India-ASEAN context are underexplored. This matters because tariffs alone cannot explain why exports and imports respond differently to liberalisation.
Second, most studies use aggregate national data, which hides regional disparities within India. Northeast India is close to ASEAN, yet systematic evidence on this spatial dimension is limited. Third, the literature does not empirically test how trade-facilitation improvements, such as digitalisation and port efficiency, interact with India’s trade with individual ASEAN members, even though there is broad agreement that they matter. Fourth, and most critically, few assessments account explicitly for external shocks when interpreting changes associated with AITIGA, so the agreement’s apparent effect may be overstated or understated.
This study responds to these gaps within the limits of the available data. It examines country-wise and sectoral patterns to explain uneven trade outcomes, reads the trade series with the major external shocks in view, and estimates a gravity model of bilateral trade. The regional (Northeast India) and facilitation-interaction questions are not tested with the current data and are left for further research.
3. Research Methodology
3.1 Research Design
The study uses a quantitative, explanatory and comparative design based on secondary data. A quantitative approach suits the analysis because the variables, namely trade values, GDP, population and exchange rates, are measurable. The explanatory element examines whether AITIGA is associated with changes in India-ASEAN trade flows between 2000 and 2025, before and after the agreement.
The comparisons are of three kinds: exports against imports, to see whether the trade balance shifted; across all 10 ASEAN countries, to identify which changed most; and across sectors using HS-level data, to identify which product categories drove the changes. The methods are descriptive statistics and CAGR, together with an augmented bilateral gravity panel model estimated by pooled OLS, country fixed effects, two-way fixed effects and random effects. A share-shift analysis of trade creation and diversion is treated as indicative only. The link between trade volumes and economic growth is examined through a literature-based discussion, because isolating the effect of AITIGA-driven trade changes on GDP growth is beyond the data and model design.
The design keeps description, association and causation separate. The 2010 cut-off is not treated as a clean starting point, since the Global Financial Crisis, COVID-19 and other events also affected trade. Their influence is assessed descriptively and, in the two-way specification, partly absorbed by year effects.
3.2 Sample and Sampling Technique
The unit of analysis is the India-ASEAN bilateral country pair, observed annually over 2000-2025. The intended frame has 10 cross-sectional units, India’s trade with each ASEAN member (Brunei Darussalam, Cambodia, Indonesia, Lao PDR, Malaysia, Myanmar, the Philippines, Singapore, Thailand and Viet Nam), observed over 26 years, giving 260 potential country-year observations. The final estimation sample has 150 observations because the regression is restricted to observations for which all required variables are available in the dataset. The descriptive and econometric samples are therefore not identical.
At the aggregate level the study covers all 10 ASEAN members and uses no probability sampling. Purposive, criterion-based sampling applies at two levels only. For HS-level disaggregation, where data or computational limits arise, the analysis may focus on India’s five largest ASEAN trade partners by volume (Singapore, Indonesia, Malaysia, Thailand and Viet Nam), so coverage of smaller members is thinner in the sectoral analysis. For the share-shift analysis, non-ASEAN comparator countries are drawn, where applicable, from foreign suppliers trading in the same HS tariff lines liberalised under AITIGA, to improve comparability.
3.3 Data Collection Tool
The study uses secondary data from official trade and economic databases. Bilateral exports, imports, total trade and trade balance with ASEAN partners for 2000-2025 come from the Directorate General of Commercial Intelligence and Statistics (DGCIS), India’s primary source of official merchandise trade statistics, and are cross-checked against the UN Comtrade database. The AITIGA indicator is a dummy variable equal to 0 for the pre-AITIGA period and 1 for the post-AITIGA period. HS-level classification is used for the sectoral analysis. India’s share in ASEAN’s total imports is computed from the same databases to assess trade creation or diversion. India’s GDP, partner-country GDP, population and other macroeconomic variables come from the World Bank’s World Development Indicators (WDI), and exchange rates and other financial variables from the IMF and RBI records. Trade, GDP and population variables are log-transformed before estimation. Growth rates, CAGR and trade shares are calculated directly from the collected data rather than taken from published secondary estimates. The key indicators are computed as follows.
Growth rate (%) = [(Vt – Vt-1) / Vt-1] x 100
CAGR (%) = [(Vn / V0)^(1/n) – 1] x 100
ASEAN share in India’s total imports (%) = (India’s imports from ASEAN / India’s total imports from the world) x 100
India’s share in ASEAN’s total imports (%) = (ASEAN’s imports from India / ASEAN’s total imports from the world) x 100
3.4 Variables and Ethical Considerations
The main outcome variables are total bilateral trade, exports, imports and trade balance. Total trade is exports plus imports and trade balance is exports minus imports. Annual growth rates and CAGRs are calculated where compatible annual series exist. The AITIGA implementation indicator is coded 0 for 2000-2009 and 1 for 2010-2025, but because the final estimation sample contains no usable variation in this indicator, the model does not estimate an AITIGA coefficient. India’s GDP, partner-country GDP, population and exchange rates serve as controls in the gravity model. ASEAN’s share of India’s imports is an indicative descriptive measure only and does not by itself establish trade creation or diversion. The study relies on published secondary data and involves no human participants, so no ethical clearance issues arise. Table 1 summarises the variables.
Table 1: Variables used in the analysis, their type, measurement and data source
|
Variable |
Type |
Measurement |
Source |
|
Total bilateral trade |
Outcome |
Exports + imports (USD, log-transformed) |
DGCIS; UN Comtrade |
|
Exports (India to ASEAN) |
Outcome |
Annual export value in USD; log-transformed |
DGCIS; UN Comtrade |
|
Imports (India from ASEAN) |
Outcome |
Annual import value in USD; log-transformed |
DGCIS; UN Comtrade |
|
Trade balance |
Outcome |
Exports minus imports (USD) |
DGCIS; UN Comtrade |
|
Annual growth rate (exports, imports, trade) |
Outcome (derived) |
Year-on-year percentage change, computed separately for the pre- and post-AITIGA periods |
Calculated from DGCIS and UN Comtrade data |
|
CAGR (exports, imports, trade) |
Outcome (derived) |
Compound annual growth rate over 2000-2009 and 2010-2025 |
Calculated from DGCIS and UN Comtrade data |
|
AITIGA implementation dummy |
Explanatory (policy) |
0 = 2000-2009 (pre-AITIGA); 1 = 2010-2025 (post-AITIGA) |
Constructed by the researchers |
|
India’s GDP |
Control |
Annual GDP; log-transformed |
World Bank WDI |
|
ASEAN partner-country GDP |
Control |
Annual GDP; log-transformed |
World Bank WDI |
|
Population (India and partner) |
Control |
Annual population; log-transformed |
World Bank WDI |
|
Exchange rate |
Control |
Annual official bilateral exchange rate |
IMF; RBI records |
|
HS-level trade values |
Sectoral |
Export, import and trade value by HS product code |
DGCIS; UN Comtrade |
|
ASEAN share of India’s imports |
Indicative (trade creation or diversion) |
Share of India’s total imports sourced from ASEAN relative to non-ASEAN suppliers, in identical liberalised HS lines |
Calculated from DGCIS and UN Comtrade data |
|
Trade shares and sectoral growth rates |
Descriptive |
Percentage changes and shares used to compare patterns across countries, sectors and periods |
Calculated from DGCIS and UN Comtrade data |
3.5 Limitations
Several limitations apply. The 2010 cut-off is not a clean counterfactual: year fixed effects absorb common shocks but do not fully address confounders such as the Global Financial Crisis, COVID-19 and geopolitical and maritime disruptions. Any AITIGA coefficient would therefore be an association and not a causal effect, unless a stronger identification strategy is developed. Treatment is coded as a binary pre/post-2010 indicator rather than phased, because tariff-schedule data are limited. A full 10-country HS-level analysis is data-intensive and may be restricted to major partners, which limits coverage of smaller ASEAN members. The share-shift comparison is indicative only, since a rising ASEAN import share alone cannot separate trade creation from trade diversion. The discussion of trade and growth is non-causal by design and rests on the literature and not on an estimated AITIGA-growth effect. Finally, reporting gaps and definitional differences across Comtrade, WDI and the exchange-rate sources may affect comparability.
4. Data Analysis and Interpretation
4.1 Introduction
This section analyses India’s merchandise trade with the ten ASEAN member states using descriptive trade statistics, sectoral composition, external-shock indicators and a gravity-model framework. It first identifies how trade has changed, then examines the composition of that change, and finally tests whether partner-country economic size and other variables are statistically associated with bilateral trade. AITIGA entered into force on 1 January 2010, which gives a descriptive break between the pre-AITIGA period (2000-2009) and the post-AITIGA period (2010-2025). A before-and-after comparison is not a causal evaluation, however, because global financial conditions, commodity prices, COVID-19, geopolitical developments and shipping disruptions also affected trade over the period.
4.2 Data Overview and Analytical Design
The analysis combines calendar-year import data with a matched fiscal-year merchandise trade series. A full 2000-2025 annual panel is available for imports only, and a matched export and import series is available for FY2013-14 to FY2023-24. Unless stated otherwise, long-run import trends use calendar-year data and export-import comparisons use the fiscal-year series, so the two are not perfectly aligned in time. A complete verified annual export series covering both 2000-2009 and 2010-2025 was not available, so pre- and post-period averages and CAGRs are reported for imports only. Country-level absolute import values for 2025 were inconsistent with the aggregate, so only the published country shares are used and no totals are rebuilt from them. Recent official observations may be revised and should be treated as provisional. Table 2 summarises the coverage.
Table 2: Data coverage and analytical framework
|
Component |
Coverage / definition |
Use |
|
Imports |
2000-2025, calendar years |
Long-run trajectory and AITIGA-period comparison |
|
Exports, imports, total trade |
FY2013-14 to FY2023-24 |
Matched growth and composition analysis |
|
AITIGA |
In force from 1 January 2010 |
Descriptive period break |
|
Econometric panel |
150 bilateral observations |
Gravity-model estimation |
|
Trade scope |
Merchandise trade only |
Services excluded |
Source: World Integrated Trade Solution (WITS), World Bank, using UN Comtrade merchandise trade data; Directorate General of Commercial Intelligence and Statistics (DGCI&S), Ministry of Commerce and Industry, Government of India.
4.3 Conceptual and Theoretical Framework
4.3.1 Trade Liberalisation and Regional Integration
Trade agreements can affect bilateral trade by lowering tariffs, improving market access and reducing some transaction costs. In a free-trade setting, lower barriers can generate trade creation when imports shift toward more efficient foreign suppliers. The gains need not be symmetric, though, because partners differ in production structure, supply-chain position, competitiveness and non-tariff barriers. A rise in total trade after an agreement therefore does not imply that exports and imports rise at the same rate.
4.3.2 Comparative Advantage and Trade Composition
Comparative advantage offers a second lens. Countries export goods in which their relative efficiency is stronger and import goods in which foreign suppliers have cost, resource or scale advantages. In India-ASEAN trade, ASEAN supplies industrial inputs and commodities, while Indian exports are concentrated in selected manufacturing, chemicals, pharmaceuticals, agricultural products and other value-added categories. The composition of products therefore shapes the aggregate balance.
4.3.3 Gravity Theory
The gravity model explains bilateral trade partly through economic size. Larger economies have greater production capacity and market demand, and trade is also affected by trade costs and other country characteristics. GDP, population and exchange rates are therefore treated as structural correlates of trade. The model complements the descriptive analysis: the descriptive statistics show what happened, and the gravity framework examines which observable characteristics are associated with differences in bilateral trade.
4.3.4 Interpreting the AITIGA Break
The AITIGA date is useful but should not be treated as an isolated treatment event. The global financial crisis affected the early period, commodity prices moved trade values, COVID-19 sharply disrupted commerce, and geopolitical and maritime disruptions after 2022 added volatility. The post-AITIGA period is therefore associated with a different trade trajectory, which is not the same as saying that every change was caused by AITIGA.
4.4 Descriptive Statistics and Trade Trend
The matched fiscal-year series shows substantial growth in India-ASEAN merchandise trade. Total trade rose from US$74.41 billion in FY2013-14 to US$120.54 billion in FY2023-24, an increase of 62.0% (DGCI&S, n.d.). The rise was not smooth: trade fell in FY2015-16 and during the pandemic and then recovered strongly.
Table 3: India-ASEAN merchandise trade, FY2013-14 to FY2023-24 (US$ billion)
|
Year |
Exports |
Imports |
Total trade |
Trade balance |
|
2013-14 |
33.133 |
41.278 |
74.411 |
-8.145 |
|
2014-15 |
31.812 |
44.714 |
76.526 |
-12.902 |
|
2015-16 |
25.133 |
39.909 |
65.042 |
-14.776 |
|
2016-17 |
30.961 |
40.617 |
71.578 |
-9.656 |
|
2017-18 |
34.203 |
47.133 |
81.336 |
-12.930 |
|
2018-19 |
37.473 |
59.321 |
96.794 |
-21.848 |
|
2019-20 |
31.546 |
55.369 |
86.915 |
-23.823 |
|
2020-21 |
31.485 |
47.420 |
78.905 |
-15.935 |
|
2021-22 |
42.327 |
68.070 |
110.397 |
-25.743 |
|
2022-23 |
44.000 |
87.500 |
131.500 |
-43.500 |
|
2023-24 |
41.210 |
79.330 |
120.540 |
-38.120 |
Source: DGCI&S, Ministry of Commerce and Industry, Government of India; data compiled in the Delhi Policy Group policy brief (Seshadri, 2022) and supplemented with Ministry-reported FY2022-23 figures and the FY2023-24 series cited in ERIA (2024).
Figure 1: India-ASEAN merchandise exports and imports, FY2013-14 to FY2023-24
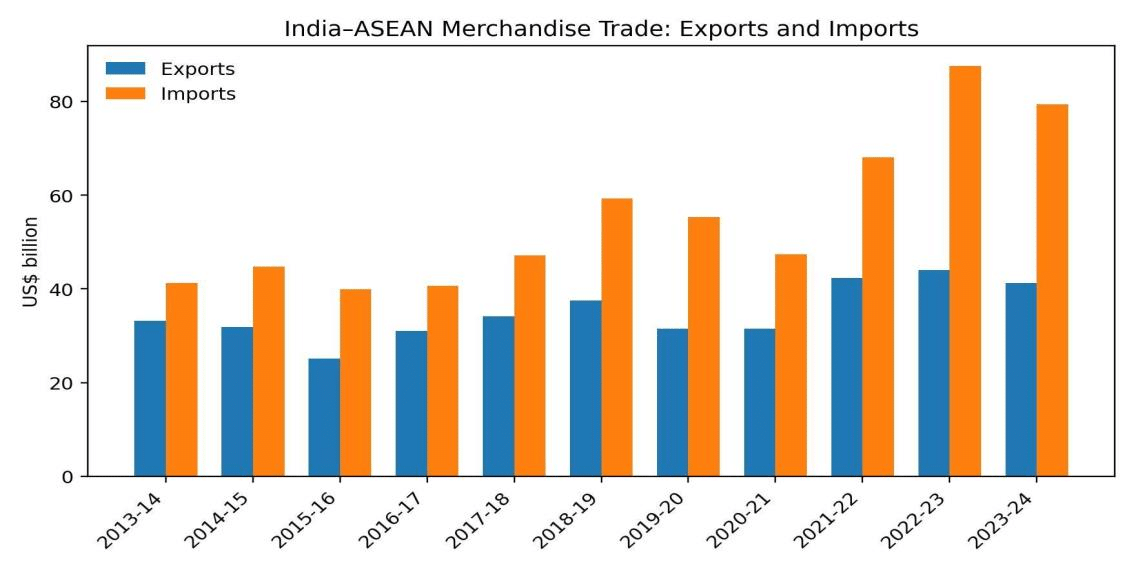
Source: DGCI&S, Ministry of Commerce and Industry, Government of India; Seshadri (2022), Vietnam News Agency (2024) and ERIA (2024) for the reported series.
Imports exceeded exports in every year of the series. Imports rose from US$41.28 billion in FY2013-14 to US$79.33 billion in FY2023-24, while exports rose from US$33.13 billion to US$41.21 billion (DGCI&S, n.d.). Both flows expanded in absolute terms, which indicates deeper commercial integration, but the larger increase on the import side made bilateral trade more import-intensive.
4.4.1 Export-Import Asymmetry
Between FY2013-14 and FY2023-24, exports increased by 24.4% and imports by 92.2%. The export share of total trade declined from 44.5% to 34.2% while the import share rose from 55.5% to 65.8%, and the bilateral merchandise deficit widened from US$8.15 billion to US$38.12 billion. Total trade growth alone could suggest more balanced integration, but its composition shows that the expansion was driven disproportionately by imports. This is consistent with a relationship in which ASEAN suppliers strengthened their position in India’s import basket while Indian exports expanded more slowly.
4.4.2 Volatility
Trade expansion was interrupted by substantial shocks. Total trade fell from US$96.79 billion in FY2018-19 to US$78.91 billion in FY2020-21, a decline of 18.5%, before rising by about 39.9% in FY2021-22. Movements of this size make a simple linear reading of the post-2010 trend inappropriate.
4.5 Distribution and Group Comparisons
4.5.1 ASEAN Import Trajectory, 2000-2025
Figure 2: India’s imports from ASEAN, 2000-2025
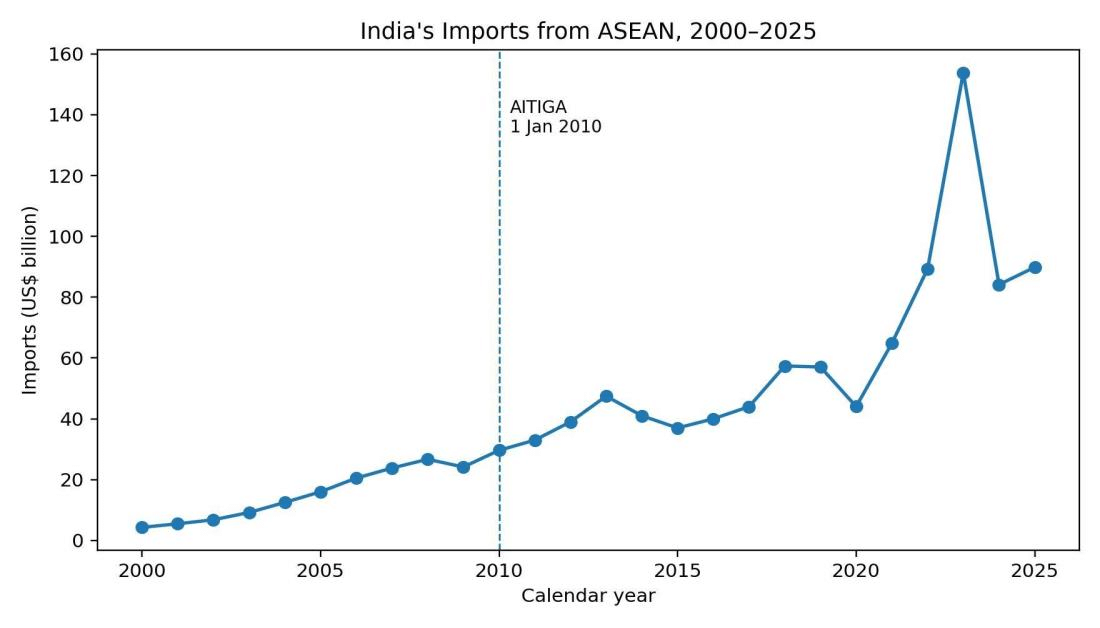
Source: World Integrated Trade Solution (WITS), World Bank, using UN Comtrade bilateral merchandise trade data.
Imports rose from about US$4.30 billion in 2000 to US$24.16 billion in 2009, and the post-2010 series stayed at much higher levels. Imports reached US$47.45 billion in 2013, stayed between US$37 billion and US$44 billion during 2014-2017, and then rose sharply after the pandemic. The 2023 peak of US$153.84 billion was followed by a correction to US$84.15 billion in 2024 and US$89.84 billion in 2025.
4.5.2 Pre- and Post-AITIGA Import Comparison
Table 4: Pre- and post-AITIGA import comparison, 2000-2009 vs. 2010-2025
|
Indicator |
2000-2009 |
2010-2025 |
Interpretation |
|
Average imports (US$ bn) |
14.38 |
59.97 |
Post-period average is about 4.2 times higher |
|
Import CAGR |
21.1% |
7.7% |
Lower post-period rate reflects a much larger base |
|
Starting value (2000 / 2010) |
4.30 |
29.64 |
Large difference in starting scale |
|
Ending value |
24.16 (2009) |
89.84 (2025) |
Substantially higher post-period level |
Source: WITS / UN Comtrade annual imports series, 2000-2025. CAGR uses 9 annual intervals for 2000-2009 and 15 annual intervals for 2010-2025.
4.5.3 Changing Trade Composition
Figure 3: Export and import shares in total India-ASEAN trade
Source: Calculated from DGCI&S merchandise trade values reported for FY2013-14 to FY2023-24.
The composition of bilateral trade shifted toward imports over the matched period. The export share fell by about 10.3 percentage points, from 44.5% to 34.2%, and the import share rose by the same amount. This measure is useful because it does not depend on the size of the overall market: it shows that imports became a larger part of total trade.
4.5.4 Country Concentration
India’s ASEAN imports in 2025 were concentrated among a few partners. Singapore, Indonesia, Thailand and Malaysia together supplied about 83.6%, and Viet Nam a further 12.9%, so the top five account for more than 96% of the total (Table 5). This fits the gravity view that larger and more industrially diversified ASEAN economies matter both as markets and as suppliers. The scale of trade appears to reflect partner economic size, production capacity and regional supply chains as well as tariff preferences.
Table 5: ASEAN partner-country shares in India’s imports, 2025
|
Partner |
2025 imports (US$ thousand) |
Share |
|
Singapore |
24,238,610 |
26.98% |
|
Indonesia |
20,291,680 |
22.58% |
|
Thailand |
16,426,790 |
18.29% |
|
Malaysia |
14,174,190 |
15.78% |
|
Viet Nam |
11,614,360 |
12.93% |
|
Other ASEAN members |
3,097,000 |
~3.44% |
Source: Government of India trade data as reproduced in the research dataset; country-share composition reported for 2025. Published country-share percentages are used as the comparative measure; absolute country-level figures from the underlying file are not used to construct aggregate totals.
4.5.5 Sectoral Structure and Economic Interpretation
Aggregate trade values do not show which products generate the asymmetry. India’s exports to ASEAN are spread across pharmaceuticals, organic chemicals, iron and steel, vehicles and components, gems and jewellery, agricultural products and selected petroleum products. Imports are concentrated in mineral fuels, vegetable and palm oils, industrial chemicals, machinery and equipment, and intermediate inputs (Table 6). This composition is consistent with comparative advantage and production-network specialisation: ASEAN economies supply commodities and intermediate inputs at scale, while India has export strengths in selected manufactured and knowledge-intensive sectors. The result can be high two-way trade without a balanced trade position.
Table 6: Major product groups in India-ASEAN trade, by direction
|
Direction |
Major product groups |
Interpretation |
|
Indian exports |
Pharmaceuticals; organic chemicals; iron and steel; vehicles and components; gems and jewellery; agriculture |
Diversified manufacturing and value-added products |
|
Indian imports |
Mineral fuels; palm and vegetable oils; machinery; industrial chemicals; intermediate inputs |
Resource, energy and production-input dependence |
4.5.6 External Shocks
Nominal trade values move with both quantities and prices. Commodity price increases, for instance, can raise the dollar value of imports without a proportionate rise in physical quantities. The post-2020 surge should therefore be read with caution and not attributed mechanically to trade policy.
Table 7: External shocks and trade movements
|
Period |
Observed movement |
Analytical implication |
|
FY2018-19 to FY2020-21 |
Total trade: 96.79 to 78.91 bn |
COVID-19 disruption |
|
FY2020-21 to FY2021-22 |
Total trade: 78.91 to 110.40 bn |
Strong post-pandemic recovery |
|
FY2022-23 to FY2023-24 |
Total trade: 131.50 to 120.54 bn |
Post-2022 and maritime disruption context |
Source: DGCI&S, Ministry of Commerce and Industry, Government of India; supporting publications are listed in the References.
4.5.7 Growth-Rate Analysis
Figure 4: Annual export and import growth, FY2013-14 to FY2023-24
Source: Calculated from DGCI&S-sourced annual merchandise trade values.
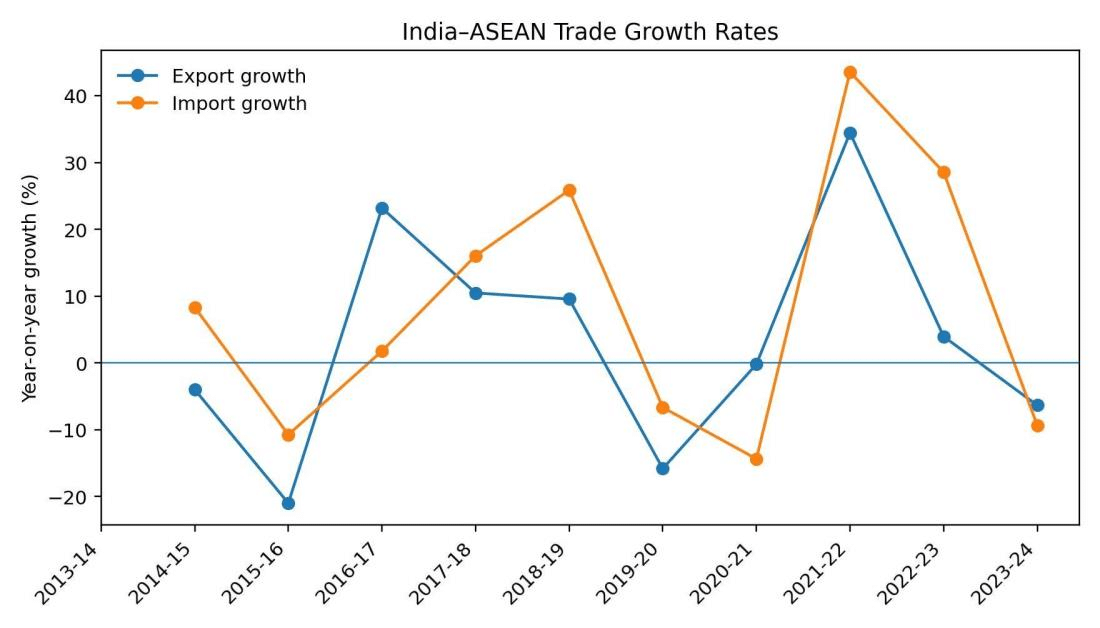
Imports grew faster than exports in several high-growth years: by 25.9% in FY2018-19 and 43.5% in FY2021-22, against export growth of 9.6% and 34.4% respectively. In downturns both flows contracted, but neither consistently fell by more than the other. Exports fell more in FY2015-16 and FY2019-20, and imports fell more in FY2020-21 and FY2023-24.
4.5.8 Matched-Decade Growth Comparison
Table 8: Matched-decade growth comparison, FY2013-14 vs. FY2023-24
|
Indicator |
FY2013-14 |
FY2023-24 |
Cumulative change / CAGR |
|
Exports (US$ bn) |
33.133 |
41.210 |
+24.4%; CAGR 2.2% |
|
Imports (US$ bn) |
41.278 |
79.330 |
+92.2%; CAGR 6.8% |
|
Total trade (US$ bn) |
74.411 |
120.540 |
+62.0%; CAGR 4.9% |
Source: DGCI&S-based matched annual series for FY2013-14 to FY2023-24.
On a CAGR basis imports grew about 3.1 times as fast as exports over the matched period, a gap of about 4.6 percentage points a year, and the cumulative increase in imports was also much larger. This is the cleanest same-source evidence in the available material on export-import asymmetry.
4.6 Econometric and Statistical Results
4.6.1 Gravity Model Specification
The model relates bilateral trade to the economic size of India and the ASEAN partner, population, exchange rates and the AITIGA policy indicator. In logarithmic form the continuous coefficients can be read as elasticities. It is estimated by pooled OLS, country fixed effects, two-way fixed effects and random effects (Table 9).
Table 9: Gravity model estimation results
|
Variable |
Pooled OLS |
Country FE |
Two-way FE |
Random effects |
|
ln GDP, India |
0.355 |
0.564 |
Omitted |
0.443 |
|
ln GDP, partner |
1.803*** |
1.472 |
1.402 |
1.598*** |
|
ln Population, India |
-0.659 |
5.529*** |
Omitted |
-0.260 |
|
ln Population, partner |
-0.581 |
-6.148 |
-7.065 |
-0.407 |
|
ln Exchange rate |
-0.003 |
-0.119*** |
-0.176*** |
-0.064 |
|
AITIGA |
Not estimated |
Not estimated |
Not estimated |
Not estimated |
Note: *** denotes statistical significance at approximately the 1% level.
4.6.2 Interpretation
Partner-country GDP is the strongest explanatory variable. Its coefficient is positive in all four specifications and statistically significant in the pooled (1.803) and random-effects (1.598) models. In the pooled specification, a 1% increase in partner GDP is associated with roughly a 1.8% increase in bilateral trade, holding the other included variables constant. India’s GDP is positive but statistically insignificant in every reported specification. Population effects are mixed and generally weak. Exchange-rate effects are specification-sensitive: the coefficient is negative and significant under fixed effects but not under random effects. Economic size is therefore a more robust correlate of bilateral trade than population or exchange-rate movements in the current model.
4.6.3 AITIGA Identification
The AITIGA coefficient is not estimated because the policy variable has no usable variance in the final estimation sample. This is an identification limitation and not evidence of a zero policy effect. The model therefore cannot produce an independent associative or causal AITIGA estimate from the regression sample.
4.7 Diagnostic and Robustness Checks
Table 10: Diagnostic and robustness test results
|
Diagnostic test |
Result |
Interpretation |
|
F-test: FE vs. pooled |
F(9, 135) = 19.116, p < 0.001 |
Reject pooled OLS; country effects matter |
|
Breusch-Pagan LM |
χ²(1) = 281.53, p < 0.001 |
Reject pooled OLS; panel effects matter |
|
Hausman: FE vs. RE |
χ²(5) = 2.588, p = 0.7632 |
No evidence against random effects |
4.7.1 Model Selection
The F-test and the Breusch-Pagan LM test both reject the pooled specification, which indicates meaningful country-specific heterogeneity. The Hausman test does not reject random effects. Together the diagnostics support random effects as a defensible baseline. The random-effects estimator assumes that country-specific effects are uncorrelated with the regressors and are drawn from a common distribution across the ten ASEAN partners, whereas fixed effects treat them as country-specific parameters. The Hausman statistic compares the five coefficients common to both specifications and, at χ²(5) = 2.588 (p = 0.7632), does not reject the consistency of the random-effects estimates. The F-test of country fixed effects against pooled OLS has 9 numerator degrees of freedom (10 partner countries minus 1) and 135 denominator degrees of freedom (150 observations minus 10 country effects minus 5 regressors).
4.7.2 Reading the Evidence Together
The econometric results should be read with the descriptive evidence. Imports became the larger part of bilateral trade and import sourcing is concentrated in large ASEAN economies, and the gravity results independently show that partner GDP is positively associated with trade. The two are complementary: economic size helps explain trade volume, while sectoral composition and import dependence help explain why high trade volume can coexist with a persistent deficit.
4.7.3 Limits of Inference
The model cannot identify an AITIGA coefficient, rests on 150 observations and omits some determinants of bilateral trade. The calendar-year import series and the fiscal-year matched series are not perfectly aligned, and the descriptive comparisons establish associations and patterns, not causal effects. Any implications for trade or industrial policy would need further research with adequate policy variation, for example a difference-in-differences or synthetic-control design.
5. Discussion
The trade record is clear. Total India-ASEAN trade grew from US$74.41 billion in FY2013-14 to US$120.54 billion in FY2023-24, but imports grew about three times as fast as exports (CAGR of 6.8% against 2.2%), the export share of total trade fell from 44.5% to 34.2%, and the deficit grew more than fourfold, from US$8.15 billion to US$38.12 billion. The sectoral pattern matches the comparative-advantage explanation in the literature: ASEAN supplies fuels, commodities and intermediate inputs, while Indian exports are concentrated in pharmaceuticals, chemicals and selected manufacturing. Krishnamurthy (2025) and Seshadri (2022) trace this structure to weak rules of origin and tariff schedules that favour ASEAN producers. Rising trade under such an asymmetric structure signals deeper commercial integration, not a proportionate gain in India’s domestic output.
The gravity results add to this picture. Partner-country GDP is the strongest and most consistently positive correlate of bilateral trade (1.803 in the pooled model and 1.598 with random effects), while India’s own GDP is insignificant in every specification. This suggests that trade expansion has been driven largely by the scale of ASEAN economies and not by improvements on India’s supply side, which weakens any reading of trade growth as a sign of Indian economic strengthening.
Drawing growth conclusions is further complicated by identification. The AITIGA indicator has no usable variance in the estimation sample, so the gravity model gives no estimate of the agreement’s effect, and the post-2010 period overlaps with the Global Financial Crisis, COVID-19 and later geopolitical and maritime disruptions. Total trade fell from US$96.79 billion in FY2018-19 to US$78.91 billion in FY2020-21 and then recovered by about 39.9% in FY2021-22, movements that can affect trade values independently of the agreement. Growth in trade volume and economic growth are distinct outcomes, and the first does not automatically imply the second. AITIGA is associated with a larger scale of India-ASEAN trade, but whether that has strengthened India’s economy depends on export competitiveness, value addition and rules of origin, which trade-volume data and the present design cannot establish. This is consistent with the cautionary literature, including the mixed openness-growth evidence in Hye and Lau (2015).
Against the study’s objectives, the evidence shows uneven trade growth across products and partner economies and only indicative evidence on trade creation and diversion. It does not support the claim that higher trade volumes automatically produced broader economic growth.
6. Conclusion
The main goal of this study is to analyze the development of trade between India and ASEAN countries considering the effect of the ASEAN-India Trade in Goods Agreement (AITIGA). Special emphasis is put on the dynamics of trade volume, trade flows pattern, concentration of trading partners, structure of trade, and determinants of bilateral trade.
As a result of the research, one can make a conclusion about the significant increase in India-ASEAN trade in the post-2010 period. At the same time, this increase was rather uneven. So, for the period of FY2013-14 to FY2023-24, there was an increase in Indian imports from ASEAN by 92.2%, and in exports by 24.4%. Accordingly, the share of imports in the total bilateral trade increased from 55.5% to 65.8%, while the share of exports decreased from 44.5% to 34.2%. As a consequence, the trade deficit doubled – from US$8.15 billion to US$38.12 billion.
The composition of trade is also skewed toward a few ASEAN trading partners. The aforementioned five countries make up over 96% of India’s ASEAN imports. ASEAN provides India with large amounts of energy, commodities, machinery and intermediates, whereas Indian exports mainly consist of pharmaceuticals, chemicals, metals, automobiles and agricultural goods. This means that the disparities in production capabilities and competitiveness still matter for bilateral trade performance.
Moreover, the results of the gravity model show that the economic size of ASEAN partner countries significantly influences bilateral trade. However, it has to be mentioned that the model does not give any independent estimation of the impact of AITIGA. Consequently, the observed trade growth after 2010 cannot be treated as evidence that AITIGA was responsible for this development. External factors such as the outbreak of the COVID-19 pandemic, changes in commodity prices and geopolitical events played their role in this regard.In general, it would seem that there is some indication that AITIGA was linked to higher levels of commercial integration between India and ASEAN, but the results have been uneven when considering India’s exports. Higher levels of trade do not imply better economic benefits necessarily. It will be dependent upon the ability for India to derive greater benefits from its trade relationship with ASEAN in terms of enhancing export competitiveness, adding more value to its domestic economy, improving its infrastructure and trade facilitation, and developing more robust supply chains.
It should be noted that the major issue is not simply to raise the level of trade between India and ASEAN but to improve the quality and balance of this trade.
References
Arvis, J.-F., Ojala, L., Shepherd, B., Ulybina, D., & Wiederer, C. (2023). Connecting to compete 2023: Trade logistics in an uncertain global economy: The Logistics Performance Index and its indicators. World Bank. https://lpi.worldbank.org/sites/default/files/2023-04/LPI_2023_report_with_layout.pdf
Asian Development Bank, & United Nations Economic and Social Commission for Asia and the Pacific. (2024). Asia-Pacific trade facilitation report 2024: Promoting sustainability and resilience in global value chains. Asian Development Bank. https://doi.org/10.22617/TCS240210-2
Banik, N., & Kim, M. (2024). India-ASEAN trade relations: Examining the trends and identifying the potential. Global Business Review, 25(2_suppl), S59–S77. https://doi.org/10.1177/0972150920953546
Baru, S. (2001). India and ASEAN: The emerging economic relationship towards a Bay of Bengal community (Working Paper No. 61). Indian Council for Research on International Economic Relations. https://icrier.org/publications/india-and-asean-the-emerging-economic-relationship-towards-a-bay-of-bengal-community/
Bhattacharyay, B. N. (2009). Infrastructure development for ASEAN economic integration (ADBI Working Paper No. 138). Asian Development Bank Institute.
Ghosh, D. (2024). India-ASEAN economic relations and Northeast India: Act East Policy as a new paradigm. India Quarterly, 80(2), 196–218. https://doi.org/10.1177/09749284241241594
Hye, Q. M. A., & Lau, W.-Y. (2015). Trade openness and economic growth: Empirical evidence from India. Journal of Business Economics and Management, 16(1), 188–205. https://doi.org/10.3846/16111699.2012.720587
International Monetary Fund. (2024, March 7). Red Sea attacks disrupt global trade. IMF Blog. https://www.imf.org/en/blogs/articles/2024/03/07/red-sea-attacks-disrupt-global-trade
Krishnamurthy, P. (2025). India’s shifting stance on the ASEAN trade pact: A 15-year retrospective and future implications. SSRN. https://doi.org/10.2139/ssrn.5391467
Ministry of External Affairs, Government of India. (2025). India-ASEAN relations. Government of India. https://www.mea.gov.in/asean-india-relations.htm
Nicita, A., & Saygili, M. (2021). Trade agreements and trade resilience during COVID-19 pandemic (Research Paper No. 70). United Nations Conference on Trade and Development. https://unctad.org/publication/trade-agreements-and-trade-resilience-during-covid-19-pandemic
Rao, B. V. (2012). India’s Look East Policy: A critical assessment. India Quarterly, 68(3), 243–259.
Research and Information System for Developing Countries. (2014). ASEAN-India maritime connectivity report. ASEAN-India Centre. https://www.ris.org.in/sites/default/files/Publication/Final-Print-Martitime%20connectivity%20report.pdf
Seshadri, V. S. (2022, December 30). Preparing for a review of the ASEAN-India Trade in Goods Agreement (AITIGA) (DPG Policy Brief, Vol. VII, Issue 48). Delhi Policy Group. https://www.delhipolicygroup.org/uploads_dpg/publication_file/preparing-for-a-review-of-the-asean-india-trade-in-goods-agreement-aitiga-4780.pdf
Singh, R. K., Kumar, A., Kumari, J., & Singh, Y. (2022). Empirical study of India’s trade and investment relations with ASEAN countries: Evidence from the gravity model theory. Arthshastra Indian Journal of Economics & Research, 11(3), 8–28. https://doi.org/10.17010/aijer/2022/v11i3/172680
Singh, S. (2020). From Look East to Act East: India’s evolving engagement with Southeast Asia. Journal of Asian Security and International Affairs, 7(2), 153–172.
Tham, S. Y., & Kam, A. J. Y. (2014). Reassessing the impact of the ASEAN-India Free Trade Agreement. Jurnal Ekonomi Malaysia, 48(2), 99–110. https://doi.org/10.17576/jem-2014-4802-09
Varma, A. (2015). ASEAN-India free trade agreement: An assessment of merchandise exports and imports (MPRA Paper No. 75035). Munich Personal RePEc Archive. https://mpra.ub.uni-muenchen.de/75035/
Vietnam News Agency. (2024, April 19). India’s trade deficit with ASEAN widens. VietnamPlus. https://en.vietnamplus.vn/indias-trade-deficit-with-asean-widens-post284765.vnp
World Bank. (2022, April). Commodity markets outlook: The impact of the war in Ukraine on commodity markets. https://thedocs.worldbank.org/en/doc/24e8d315b8229b791ea61e0fa09b28d0-0350012022/original/CMO-April-2022.pdf
World Trade Organization. (2021). World trade statistical review 2021. https://www.wto.org/english/res_e/statis_e/wts2021_e/wts2021_e.pdf