
Authors: Shivani Malik, Adesegun Timileyin N., Sugandh Drall
ABSTRACT
Educational expansion is often expected to narrow income gaps. This exploratory study asks whether basic education indicators move with income inequality in low- and middle-income countries. It describes associations between adult literacy, primary gross enrolment and the Gini coefficient, using public UNESCO and World Bank data. The roster is 25 purposively selected countries; the 23 with inequality data are the sample named in the title. Complete-case samples were 23 for literacy, 14 for enrolment and 22 for earliest-to-latest change, with observations from 1970 to 2025. Pearson and rank correlations with 95% confidence intervals and sensitivity analyses were computed. The associations were weak, positive and imprecise: r = 0.23 (interval −0.21 to 0.58) for latest literacy, r = 0.08 (−0.47 to 0.58) for latest enrolment and r = 0.16 (−0.28 to 0.55) for changes. Literacy rose in all 22 countries with change data, while inequality fell in 14. When observations were recent and no more than five years apart, the association was moderately positive (r = 0.49, 0.03 to 0.78; n = 18), but it weakened when income-based inequality estimates were excluded, pointing to measurement differences (the income-based estimates are all in three Latin American countries and Türkiye). No specification showed higher literacy or enrolment accompanying lower inequality. Observations are asynchronous, inequality measures mix income and consumption, the sample is small and purposive, and intergenerational mobility is not measured. The results do not show that education fails to reduce inequality; they indicate that basic education indicators are not reliable signals of falling income inequality, and that harmonised data are needed for stronger conclusions.
Keywords – adult literacy; primary enrolment; income inequality; Gini coefficient; low- and middle-income countries; exploratory cross-country analysis
INTRODUCTION
Background
Education is widely seen as the fairest route out of disadvantage. If children from poor families can reach the same schools and qualifications as children from richer ones, their life chances should depend less on where they started. Access to basic education has expanded greatly over the past half-century: the share of the world’s adults who can read and write rose from about 65% in 1975 to about 88% in 2024 [1].
Importance of the topic
The question sits between two Sustainable Development Goals (SDGs): SDG 4, on inclusive and quality education, and SDG 10, on reducing inequality within and between countries. Governments report progress on SDG 4 largely through literacy and enrolment rates. If gains in these indicators do not reliably coincide with lower income inequality, they cannot be read as evidence of progress on SDG 10, and investment in schooling may need to be paired with other measures, such as labour-market policy and redistribution. The question matters most in low- and middle-income countries, where schooling is often the main route by which children from poorer families can improve on their parents’ position.
Existing literature
Research suggests that the spread of schooling has not produced the equalising effect many expected. The World Bank’s Global Database on Intergenerational Mobility (GDIM), which covers 153 countries and 97% of the world’s population, finds that children in developing countries have been less successful than those in high-income countries at surpassing their parents’ education, despite lower parental education [2]. In several countries, the expansion of secondary and higher education has mainly benefited families that were already advantaged [3]. Across countries, higher income inequality also tends to accompany lower mobility between generations [4].
Research problem
It therefore remains unclear whether the spread of basic education has gone together with narrower income gaps, or whether it has raised everyone’s level of schooling while leaving the gaps between groups in place. Most of the evidence concerns intergenerational mobility or secondary and higher education [2, 3], so the base of the education system, adult literacy and primary enrolment, has received less attention in relation to income inequality.
Research gap
The literature reviewed in the next section reveals an empirical and contextual gap: few studies describe, for a group of low- and middle-income countries, whether basic education indicators and income inequality move together, both across countries and within countries over time, using openly available indicators. The gap is set out in full at the end of the literature review.
Research question and objectives
This paper asks: how are adult literacy and primary gross enrolment associated with income inequality in the available observations for a selected group of low- and middle-income countries, and do changes in literacy co-vary with changes in inequality? The objectives are (1) to describe the association between the latest available education indicators and the latest Gini coefficient; (2) to describe the association between earliest-to-latest changes in literacy and in the Gini coefficient; and (3) to set these descriptive results beside published evidence on educational expansion and inequality, keeping what is measured, what is inferred and what is taken from prior literature separate. The study does not estimate causal effects, compare countries by level of development, or measure intergenerational mobility or policy.
Significance of the study
The study provides a transparent, reproducible description that uses only public data, and it reports the uncertainty and measurement problems that affect such comparisons. Its main value is practical: it tests whether commonly reported basic-education indicators can be treated as signals of falling income inequality, which matters for policymakers who monitor SDG 4 and SDG 10 together and for researchers planning analyses based on harmonised data or direct mobility measures.
Structure of the paper
The literature review develops a conceptual framework; the methodology describes the data, sample and analyses; the data analysis presents and interprets the results; and the conclusion sets out implications, limitations and directions for further research.
LITERATURE REVIEW
The review is limited to what bears on the paper’s question: whether basic education indicators and income inequality move together. It is organised around three themes: what educational expansion does to inequality of opportunity; why gains in basic education need not appear in the distribution of income; and how differences in measurement affect cross-country comparisons of inequality. Research on intergenerational mobility and on policy is treated only as context, because this study has no data on either. The working argument is that education does not automatically reduce inequality, because its equalising effect depends on whether opportunity is independent of family background [5].
Theme 1 — Educational expansion and inequality of opportunity
Educational opportunity concerns whether people have a fair chance to enter education, remain in it, gain qualifications and progress to higher levels regardless of family background. Comparative research treats the association between family origin and educational outcomes as a central indicator of equality of opportunity [5].
A central pattern in the literature is that expansion increases participation without necessarily equalising opportunity. Evidence from 24 countries in the European Social Survey shows that class gaps in education narrowed in the post-war decades and then stopped narrowing, and that for some birth cohorts expansion widened unequal access to secondary or tertiary education, because families with more resources took up the new places first [3]. A comparative analysis of Argentina, Chile and Mexico finds that inequality is not removed by expansion but reorganised across educational stages, so that access to primary or secondary schooling does not guarantee equal access to good schools, completion or university [6]. Both studies point to the same conclusion: expansion alone is not a reliable route to lower inequality, because advantage tends to resurface at whichever stage remains unequal. The literature therefore distinguishes formal access, which enrolment rates capture, from substantive opportunity, which also depends on teaching quality, completion and progression [3, 6].
Theme 2 — From basic education to income inequality
Gains in basic education reach the distribution of income only through further stages. Educational attainment and later labour-market outcomes are related but separate stages [5], so gains in education need not translate into gains in income position. Education may also raise individual attainment while leaving the relative advantage of privileged families largely intact [7]. Adult literacy and primary enrolment sit at the base of this sequence, which is why their relation to income inequality cannot be assumed.
The closest large body of cross-country evidence concerns intergenerational educational mobility, the extent to which parents’ education predicts children’s education, and not income inequality itself. It shows that educational mobility is lower on average in developing countries than in high-income countries [2, 8]; that mobility tends to be lower where income inequality is high and families find it hard to borrow, and higher where public education spending favours poorer groups; and that it can even fall during periods of rapid educational expansion [7, 9]. A study of 49 countries finds that economic development improves educational mobility more strongly where inequality is lower [10]. This evidence supports a conditional rather than automatic relationship. It concerns a different outcome from the one measured here, so it is used in this paper only as a point of comparison.
Theme 3 — Measuring income inequality across countries
Cross-country comparisons of inequality depend on how household welfare is measured. Latin American surveys generally measure income, whereas South Asian, Sub-Saharan African and Middle Eastern surveys generally measure consumption, and consumption-based estimates tend to show lower inequality [11]. The concept can also change within one country’s series, as in Türkiye, whose recent estimates are based on an income survey [12]. Comparative research notes more generally that measurement differences make cross-national trends and rankings difficult to interpret [5]. An association between an education indicator and the Gini coefficient can therefore reflect how inequality was measured as well as how unequal a country is. For this reason the present study examines measurement before offering any substantive reading of its results.
Policy context (not tested in this study)
Policy is the reason the question matters, so it is reviewed here, but it is context only: this study has no policy measures and tests none. At the system level, comparative welfare-state research shows that education and social policy work together. Countries with social democratic welfare regimes show a weaker link between parents’ and children’s occupations than countries with liberal, corporatist or mixed regimes, and wider access to post-secondary education also weakens this link, although wider access does not by itself guarantee equal opportunity [13]. Evidence from the Organisation for Economic Co-operation and Development (OECD) points the same way: education and early-childhood policies help explain why some countries are more mobile than others [14], while redistribution through taxes and cash transfers has weakened in most OECD countries in recent decades [15].
At the level of specific interventions, quasi-experimental evaluations show that targeted reforms, including smaller classes, additional spending, tutoring and a move from early tracking towards comprehensive schooling, can produce lasting gains for disadvantaged students. Finland’s comprehensive-school reform is one of the clearest documented examples, although, as a single-country case, how far its results transfer to other contexts remains open; early academic tracking, by contrast, can reinforce socioeconomic differences [16]. Taken together, this evidence suggests that the effect of expansion depends less on schooling alone than on how expansion is designed and combined with social policy. It is used in this paper only when possible explanations are discussed, and not as a result.
Synthesis and conceptual framework
Across the three themes, the literature gives no reason to expect that higher literacy or enrolment will automatically coincide with lower income inequality. Expansion widens participation without necessarily equalising opportunity [3, 6]; the conversion of education into income depends on later stages that basic indicators do not capture [5]; and cross-country differences in the Gini coefficient partly reflect measurement [11]. The question for this paper is therefore a narrow one: do the commonly reported basic education indicators move with income inequality in the available data, and how sensitive is the answer to timing and measurement?
Fig. 1 sets out this scope. It separates three kinds of statements that are kept apart throughout the paper: what is measured (adult literacy, primary gross enrolment, the Gini coefficient and the association between them); what is inferred from those measurements (whether the indicators can be read as signals of lower inequality, and how far the association reflects timing and the welfare concept); and what is taken from prior literature only and is not tested (who benefits from expansion, later attainment and labour-market outcomes, intergenerational mobility and policy design). The figure is an organising framework, not a causal model estimated by this paper.
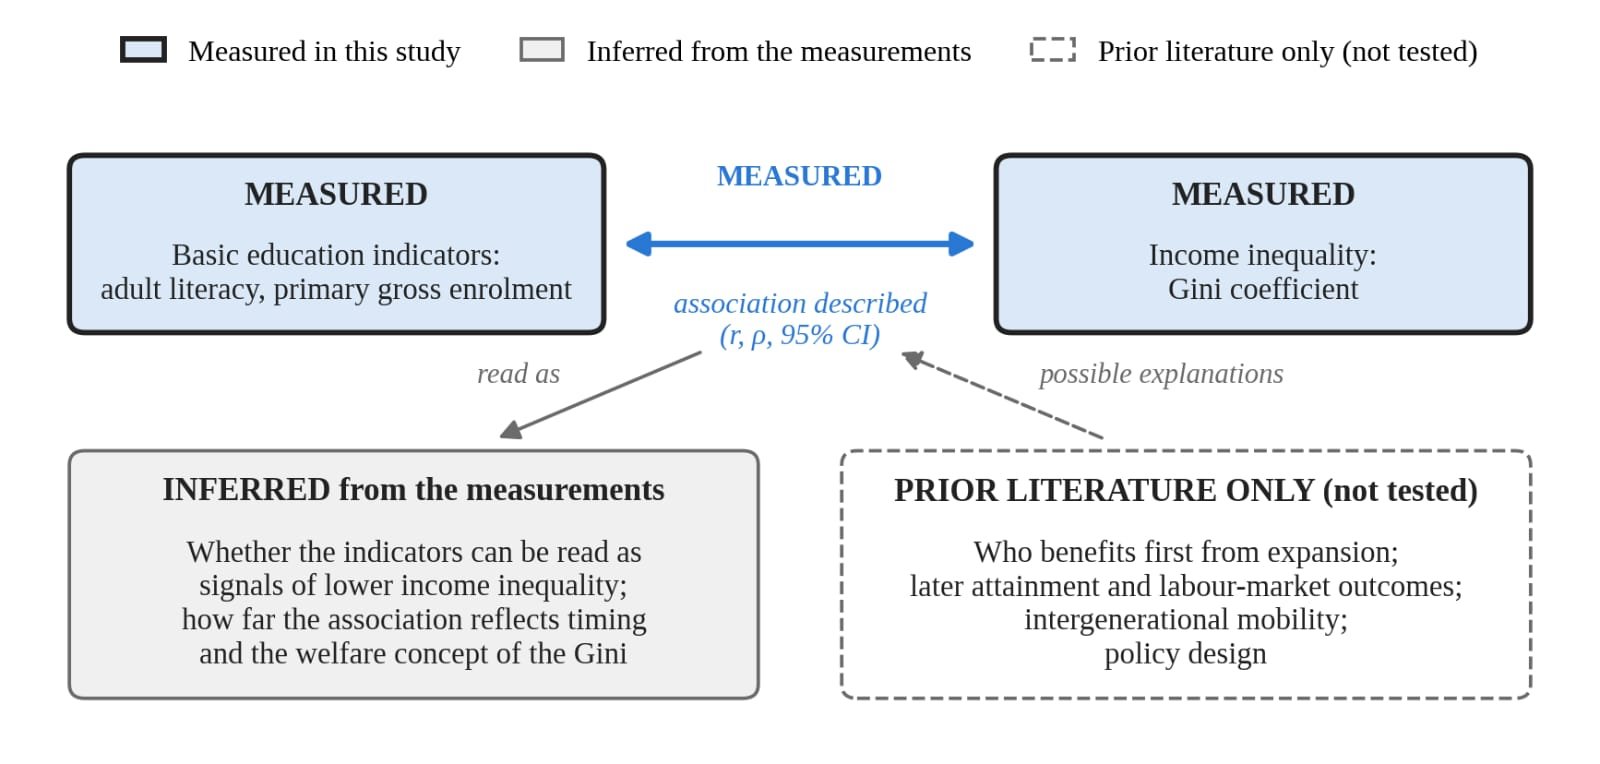
Fig. 1: Conceptual framework: what is measured, what is inferred from the measurements, and what is taken from prior literature only
Source: Authors’ synthesis of the literature reviewed
Research gap
Four specific gaps emerge from the themes above. First, there is an empirical gap between education and income outcomes: global studies mainly measure intergenerational educational mobility, and fewer relate educational change to income inequality, even though attainment and labour-market outcomes are separate stages [5]. Second, there is a gap in the level of education studied: the comparative evidence concentrates on secondary and tertiary expansion [3], and says less about whether gains at the base of the system, in adult literacy and primary enrolment, move with income inequality. Third, there is a contextual gap: much of the comparative evidence comes from Europe, the OECD or Latin America, while outcomes vary widely across developing regions [8]. Fourth, there is a methodological gap: cross-national comparisons are complicated by measurement differences that make trends and rankings difficult to interpret [5], and these problems are rarely reported alongside descriptive results.
The present study addresses these gaps in part. Using public data for a roster of 25 countries, of which 23 low- and middle-income countries across Africa, Asia, the Middle East and Latin America have inequality data, it describes whether adult literacy and primary enrolment are associated with income inequality, both at the latest observation and over time, and it reports the uncertainty and measurement sensitivity of those associations. It does not estimate mobility or test mechanisms; where it suggests explanations, these are drawn from the literature. Its contribution is a bounded exploratory comparison, not a comprehensive account of education’s effects on inequality or mobility.
METHODOLOGY
Research design
The study uses an exploratory, descriptive, correlational design based on secondary country-level data. Associations were described in two ways: using each country’s latest available values (a latest-value comparison), and using the difference between each country’s earliest and latest values (an endpoint-change comparison). Because observation years differ across countries and indicators, both comparisons are asynchronous, and the endpoint-change comparison is not a panel analysis: it does not align time periods, control for country-specific trends or establish temporal order. The design is appropriate for describing whether commonly reported indicators move together, but it cannot identify causal effects.
Study setting / context
The unit of analysis is the country. The countries lie in Sub-Saharan Africa, North Africa and the Middle East, Central, South and East Asia, and Latin America. The analysed observations range from 1970 (the earliest enrolment value) to 2025 (the latest enrolment and Gini values); literacy observations span 1975–2024 and Gini observations 1977–2025. The year of every value is reported in Appendix Table A1.
Population and sample
The roster consists of 25 countries: Afghanistan, Bangladesh, Brazil, China, Egypt, Ethiopia, Ghana, India, Indonesia, Iran, Jordan, Kazakhstan, Kenya, Kuwait, Kyrgyzstan, Laos, Mexico, Morocco, Nepal, Nigeria, Pakistan, Peru, the Philippines, South Africa and Türkiye. The roster is distinct from the analysis samples. Adult literacy is available for all 25 countries, the Gini coefficient for 23 (the downloaded Gini series contains no estimate for Afghanistan or Kuwait), and primary enrolment for 16. Each analysis uses complete cases only: 23 countries for literacy and inequality (analysis A), 14 for enrolment and inequality (analysis B), and 22 for the endpoint-change analysis (analysis C), from which Kenya is excluded because it has a single literacy observation (2000). All 23 countries in the inequality analyses are low- or middle-income economies.
Sampling technique
The roster was chosen purposively by the research team on two criteria: availability of adult literacy data from the UNESCO Institute for Statistics, and a spread of world regions. No dated candidate-country frame, quotas or selection sequence were recorded, so the selection cannot be reproduced exactly. The roster is therefore treated as a purposive convenience sample; it is not representative of low- and middle-income countries, and results describe these countries only.
Data sources/instruments
Three indicators were downloaded through Our World in Data on 17 September 2026 (Table 1). For each country, the earliest and latest available value of each indicator was extracted with its year, using a Python extraction script. The GDIM was not used as data; it is cited only as published evidence.
Table 1: Indicators, definitions and data sources
|
Indicator |
Role |
Definition |
Source (version) |
|
Adult literacy rate |
Education indicator |
% of people aged 15 and over who can, with understanding, read and write a short simple statement on everyday life |
UNESCO Institute for Statistics, via Our World in Data [1] |
|
Primary gross enrolment ratio |
Education indicator |
Enrolment in primary education, regardless of age, as % of the population of official primary-school age; can exceed 100% |
UNESCO Institute for Statistics, via Our World in Data [17] |
|
Gini coefficient |
Inequality indicator |
0 = perfect equality, 1 = maximum inequality; based on household income or consumption per capita, depending on the survey (recorded for every observation; see Table A1) |
World Bank Poverty and Inequality Platform (PIP), version 20260324, via Our World in Data [18]; welfare type from the PIP API [19] |
Source: Compiled by the authors
Variables / constructs
Education indicators. The adult literacy rate is defined as in Table 1. It measures whether basic skills have reached the adult population; it is one outcome of education, not a measure of educational attainment or learning quality. The primary gross enrolment ratio measures access to primary school; because it counts over-age and under-age pupils, for example after late entry or grade repetition, it can exceed 100%, and it does not measure attendance, completion or learning.
Inequality indicator. The Gini coefficient summarises the distribution of household welfare. The PIP series combines two welfare concepts: Latin American surveys generally measure income, whereas South Asian, Sub-Saharan African and Middle Eastern surveys generally measure consumption, and consumption-based estimates tend to show lower inequality [11]. The concept can also change within a country’s series: Türkiye’s recent estimates are based on an income survey [12]. The merged dataset did not record the welfare concept of each observation, so it was looked up for all 46 Gini observations (the earliest and latest year for each of the 23 countries) in the World Bank PIP database, using its welfare-type field [19] on 4 October 2026. Every looked-up Gini value matched the dataset value to within 0.001. The latest estimate is income-based for four countries (Brazil, Mexico, Peru and Türkiye) and consumption-based for the other 19. Four countries changed concept between their earliest and latest estimates: China, Kazakhstan and Nepal (income to consumption) and Türkiye (consumption to income). The Philippines’ 2023 survey also has an income-based record (Gini 0.393); the dataset’s consumption-based value (0.352) is used. The concept is therefore recorded for every observation, but it is not harmonised, and it is closely tied to region.
Change variables and mobility. Changes are measured as latest minus earliest value, as defined in (2) below. Intergenerational mobility is not measured. Where the paper refers to it, it uses the GDIM definitions: absolute upward mobility, the share of adults with more education than their parents, and relative mobility, the strength of the link between parents’ and children’s schooling [20].
Data collection procedure
The education and inequality tables were merged by country name and ISO country code into one file of 25 rows. The merged file was checked for duplicate country records, missing country codes and Gini values outside the range 0–1; none were found. These checks confirm internal consistency, not the accuracy of the source data. Missing values were not imputed. The merged file also contains government spending on education, which was not used in this analysis. The analysis columns of the merged file and the analysis script are provided as supplementary files.
Data analysis / analytical framework
Descriptive statistics (n, mean, standard deviation, minimum, median and maximum) were calculated for the latest value of each indicator. Associations were measured with the Pearson correlation coefficient:
r = Σ(xᵢ − x̄)(yᵢ − ȳ) / √[ Σ(xᵢ − x̄)² · Σ(yᵢ − ȳ)² ](1)
where xᵢ is the education indicator and yᵢ the Gini coefficient for country i, and x̄ and ȳ are their sample means. In analyses A and B, x and y are the latest values; in analysis C they are the endpoint changes:
ΔLᵢ = Lᵢ,latest − Lᵢ,earliest ; ΔGᵢ = Gᵢ,latest − Gᵢ,earliest(2)
where L is the adult literacy rate (percentage points) and G the Gini coefficient. A positive ΔL means literacy rose, and a negative ΔG means inequality fell. A negative correlation would be consistent with more education accompanying less inequality; it would not show that education reduces inequality. For each correlation we report the two-sided p-value, a 95% confidence interval (CI) calculated with Fisher’s z-transformation, and Spearman’s rank correlation (ρ) as a check that is less sensitive to extreme values. Outliers in the latest Gini values were identified with the interquartile range (IQR) rule:
Gᵢ < Q₁ − 1.5 × IQR or Gᵢ > Q₃ + 1.5 × IQR, where IQR = Q₃ − Q₁(3)
with quartiles calculated by linear interpolation (the pandas default). Six sensitivity analyses were added to address timing and measurement: excluding the flagged outlier; a leave-one-out analysis, recomputing each correlation with each country removed in turn; excluding the countries with income-based Gini estimates; excluding, in analysis C, the four countries whose welfare concept changed between endpoints; annualising the changes by dividing each by its interval in years; and restricting analysis A to countries whose latest literacy and latest Gini observations are no more than five years apart and whose latest Gini is from 2015 or later (the timing window, W). These analyses are exploratory. Because several related tests are reported, no single p-value is treated as decisive, and estimates and intervals are emphasised. Analyses were run in Python 3.11 with pandas 3.0, NumPy 2.4 and SciPy 1.17.
Validity / reliability
Reliability rests on official statistics from the UNESCO Institute for Statistics and the World Bank, retrieved in a single download on a recorded date, and on a scripted analysis that reproduces the statistics reported in the text and Tables 2–5 from the supplementary dataset. Validity is limited in three known ways, which the sensitivity analyses address in part: observations are asynchronous across countries and indicators; the Gini series mixes income and consumption concepts, and four countries change concept between endpoints; and literacy and gross enrolment are narrow measures of education. The flagged outlier was retained in the main analyses because it is a genuine observation, and the effect of removing it is reported.
Ethical considerations
The study uses aggregate, publicly available country-level data and involves no human participants or personal data, so informed consent and confidentiality do not arise. Ethical practice focused on attribution, licensing and responsible interpretation. The original producers and the publishing platform are cited in full. Our World in Data publishes its processing under the Creative Commons BY 4.0 licence, while the underlying data remain subject to the original providers’ terms. Because country comparisons can be read as judgements about countries, the paper avoids ranking countries on the basis of non-comparable measures and reports measurement differences alongside results. The download date is reported because these databases are revised regularly.
DATA ANALYSIS AND INTERPRETATION
Preliminary / descriptive results
Table 2 summarises data coverage, and Appendix Table A1 lists every country’s values, years and inclusion in each analysis. Literacy is complete for all 25 countries. The Gini coefficient is missing for Afghanistan and Kuwait, and primary enrolment for nine countries, so the enrolment analysis covers only 14 countries and should be read with particular caution. Missingness is not random: the countries without Gini data include one affected by prolonged conflict and one high-income Gulf state, so the analysis samples exclude both ends of the development range.
Table 2: Missing values by indicator (roster of 25 countries)
|
Indicator |
Missing |
Missing (%) |
Countries with missing data |
|
Adult literacy rate |
0 / 25 |
0.0 |
— |
|
Primary gross enrolment ratio |
9 / 25 |
36.0 |
Mexico, Morocco, Nepal, Nigeria, Pakistan, Peru, Philippines, South Africa, Türkiye |
|
Gini coefficient |
2 / 25 |
8.0 |
Afghanistan, Kuwait |
Source: Authors’ calculations based on [1, 17, 18]
Table 3 reports descriptive statistics for the latest available value of each indicator. Adult literacy averages 83.1% but ranges from 37.3% to 99.7%. The primary gross enrolment ratio averages 99.2% (n = 16; range 82.4% to 112.2%), which indicates broad access to primary school but says nothing about completion or learning. The mean latest Gini coefficient is 0.362 (n = 23; range 0.255 to 0.541).
Table 3: Descriptive statistics, latest available year
|
Indicator |
n |
Mean |
SD |
Min |
Median |
Max |
|
Adult literacy rate (%) |
25 |
83.07 |
16.06 |
37.27 |
88.92 |
99.73 |
|
Primary gross enrolment ratio (%) |
16 |
99.17 |
7.96 |
82.36 |
99.30 |
112.23 |
|
Gini coefficient |
23 |
0.362 |
0.071 |
0.255 |
0.347 |
0.541 |
Source: Authors’ calculations based on [1, 17, 18]. SD = standard deviation. Latest years differ by country (Appendix Table A1).
Fig. 2 shows the latest Gini value for the 23 countries with data, with the year of each estimate. India has the lowest value (0.255) and South Africa the highest in this sample (0.541). The four countries with income-based latest estimates (confirmed in the PIP database [19]), Brazil, Türkiye, Mexico and Peru, are all in the upper third of the distribution, which is consistent with income-based measures showing higher inequality than consumption-based measures [11]. Differences between countries therefore partly reflect how inequality was measured. Applying the IQR rule in (3) gives quartiles of 0.310 and 0.398 and bounds of 0.178 and 0.530; South Africa is the only value outside them and is flagged as a high outlier.
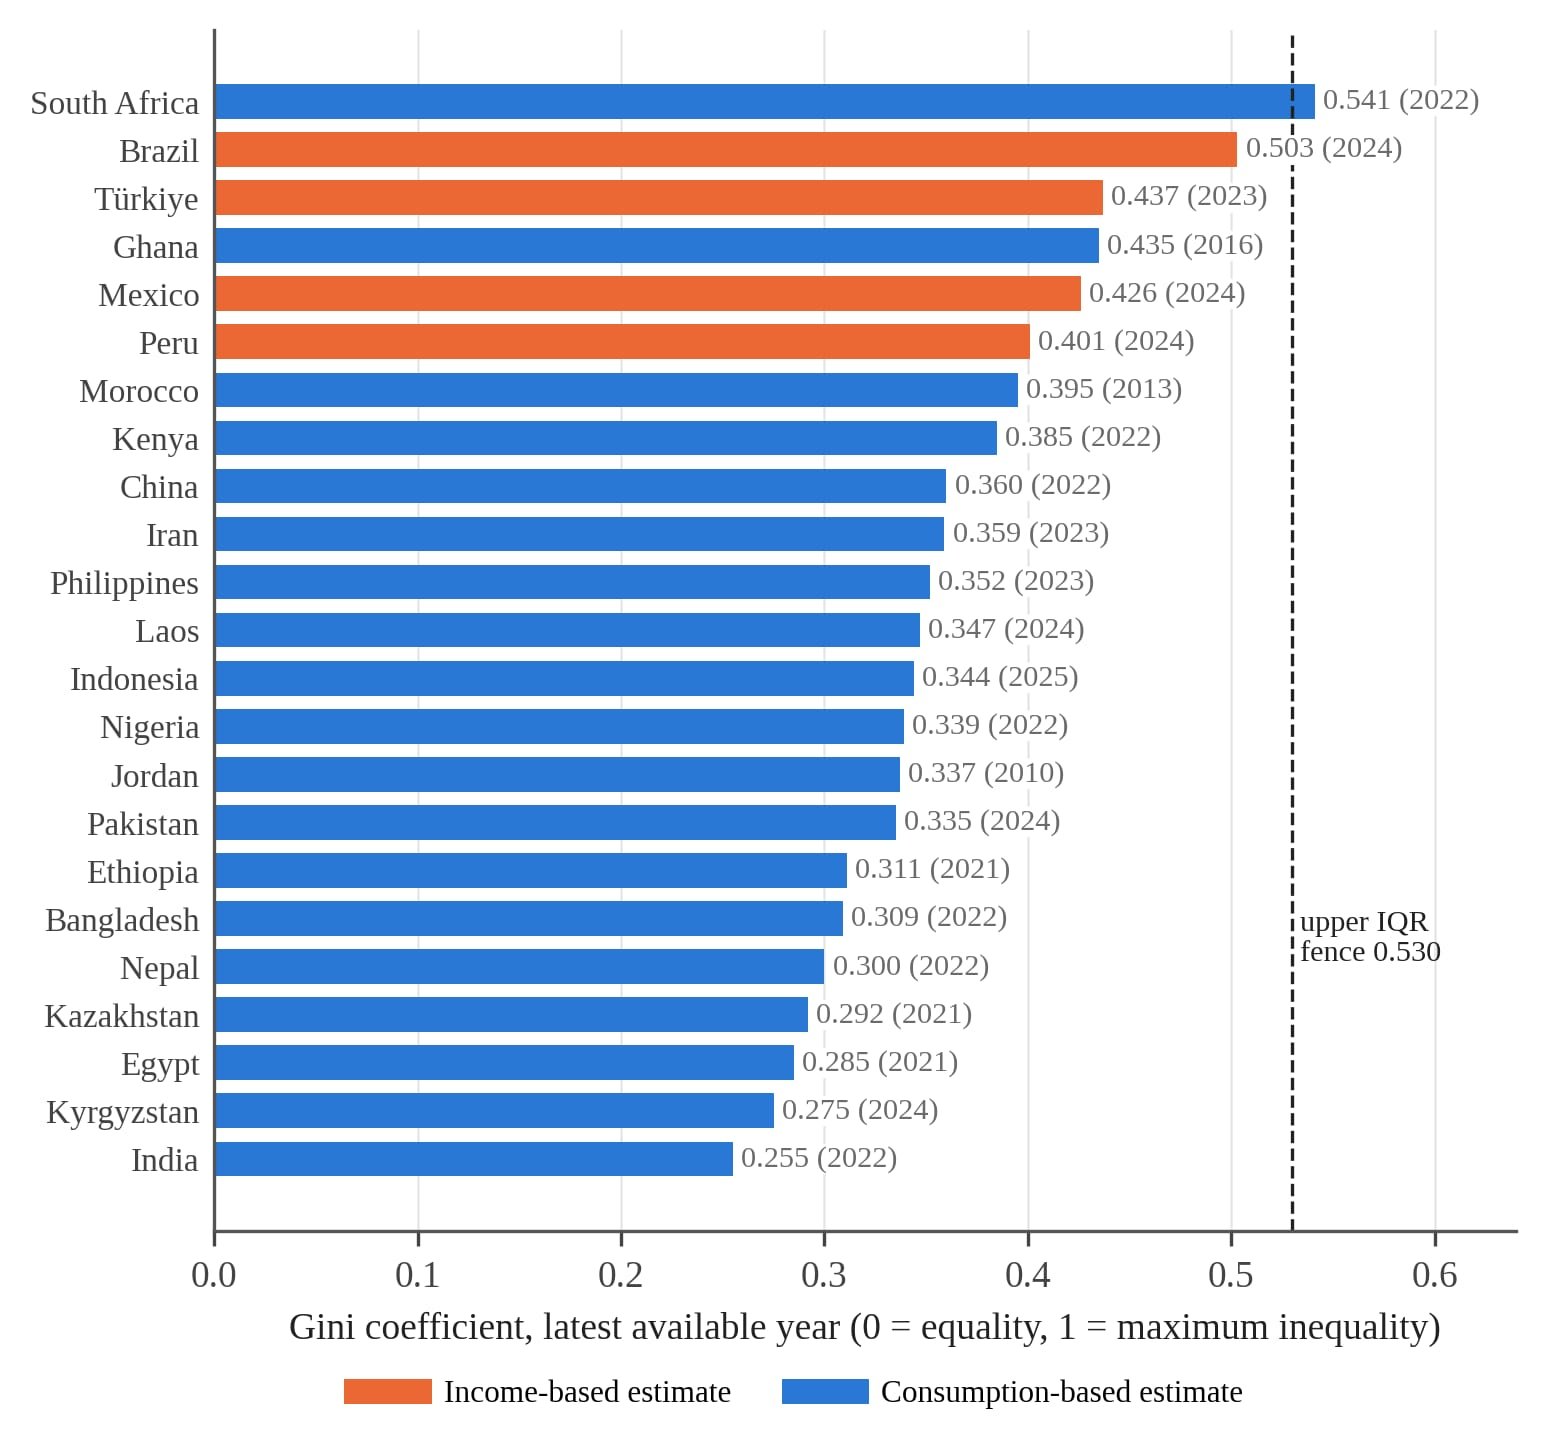
Fig. 2: Latest Gini coefficient by country, with year of estimate and upper IQR fence (n = 23; no data for Afghanistan or Kuwait; welfare concept of latest estimate shown by colour)
Source: Authors’ calculations based on [18]; welfare concept from [19]
Results for objective 1: latest-value associations
If higher education indicators went with lower inequality, the correlations would be negative. Fig. 3 and Table 4 show that they are not. Both are weak, positive and imprecise: for literacy and the Gini coefficient, r = 0.23 (95% CI −0.21 to 0.58; n = 23; p = 0.299), and for enrolment and the Gini coefficient, r = 0.08 (95% CI −0.47 to 0.58; n = 14; p = 0.792). Spearman correlations are similar (ρ = 0.14 and 0.11). The intervals are wide enough to include a moderate negative association as well as a moderate positive one, so these results do not show that no association exists. No single country drives the literacy result: removing each country in turn gives values of r between 0.17 and 0.31.
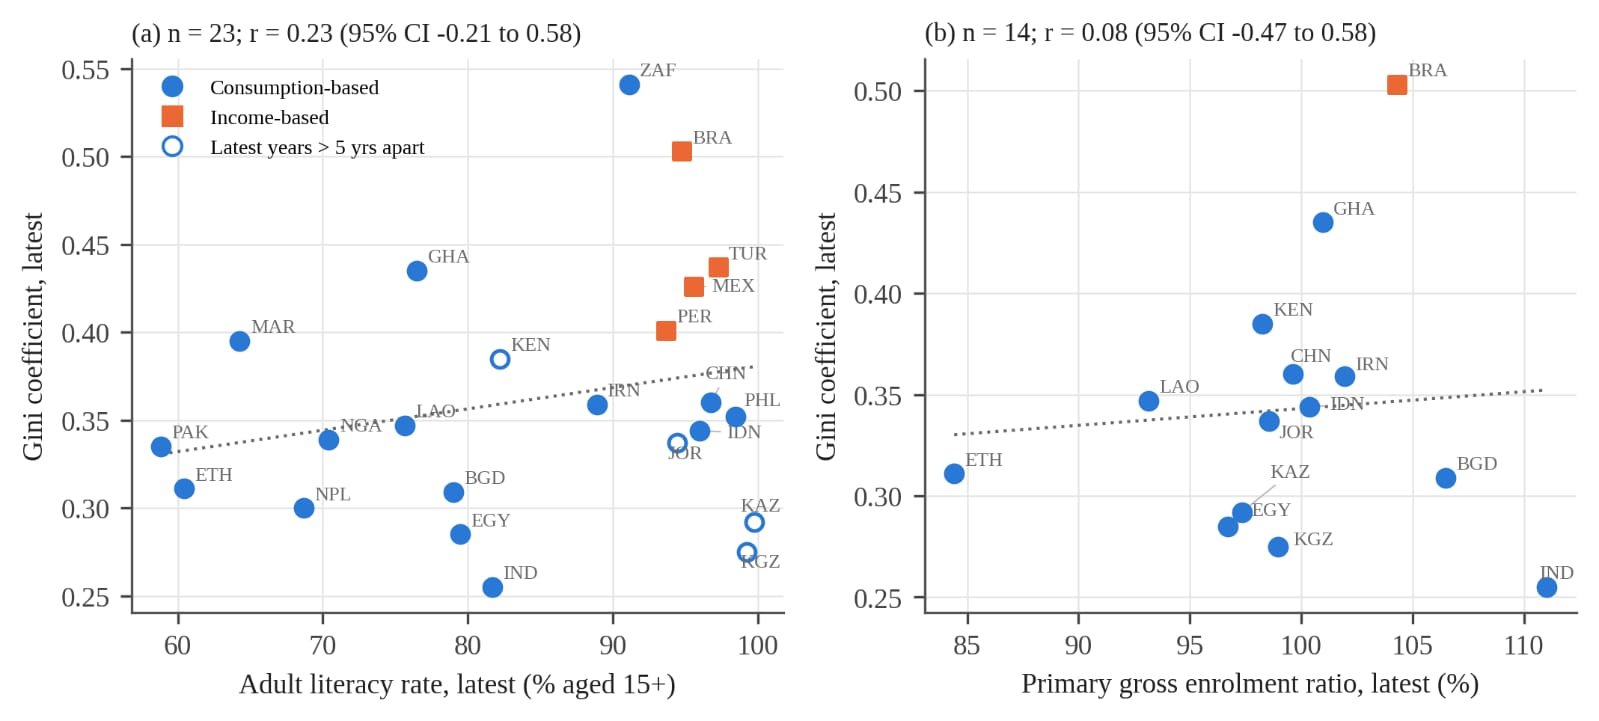
Fig. 3: Latest adult literacy (a, n = 23) and latest primary gross enrolment (b, n = 14) against latest Gini coefficient; hollow markers in (a) show countries whose latest literacy and Gini years are more than five years apart; squares are income-based latest estimates; dotted line is a descriptive least-squares fit
Source: Authors’ calculations based on [1, 17, 18]; welfare type from [19]
Table 4: Main correlation results
|
Pair of variables |
n |
r |
95% CI |
p |
ρ |
Leave-one-out r |
|
A. Literacy (latest) vs Gini (latest) |
23 |
0.226 |
−0.205 to 0.584 |
0.299 |
0.143 |
0.173 to 0.311 |
|
B. Enrolment (latest) vs Gini (latest) |
14 |
0.077 |
−0.473 to 0.584 |
0.792 |
0.108 |
−0.115 to 0.364 |
|
C. Literacy change vs Gini change |
22 |
0.164 |
−0.276 to 0.548 |
0.465 |
0.263 |
0.074 to 0.338 |
Source: Authors’ calculations based on [1, 17, 18]. Two-sided p-values; CI by Fisher’s z; ρ = Spearman’s rank correlation.
Results for objective 2: endpoint-change associations
Literacy rose in all 22 countries with two literacy observations and Gini data, while the Gini coefficient fell in 14 and rose in 8 (Fig. 4). Because literacy rose everywhere, this count describes the direction of inequality, not a link with education. The endpoint-change correlation is weak, positive and imprecise (r = 0.16; 95% CI −0.28 to 0.55; p = 0.465; n = 22). The endpoints span different periods: the interval between literacy observations ranges from 10 to 47 years (median 40), and between Gini observations from 24 to 45 years (median 36.5). Annualising the changes to allow for these different intervals gives r = 0.25 (95% CI −0.19 to 0.61; n = 22), which does not change the conclusion.
In the endpoint data, eight countries recorded rising Gini values alongside rising literacy: Bangladesh, China, Ghana, Indonesia, Morocco and Türkiye, and, by very small margins, Laos (0.004) and Pakistan (0.002). By contrast, Ethiopia, Peru and Iran recorded the largest falls in the Gini coefficient among the 22 countries (Kenya’s larger fall is excluded because its literacy change cannot be calculated). These are paired endpoint observations; they describe co-occurrence, not mechanisms.
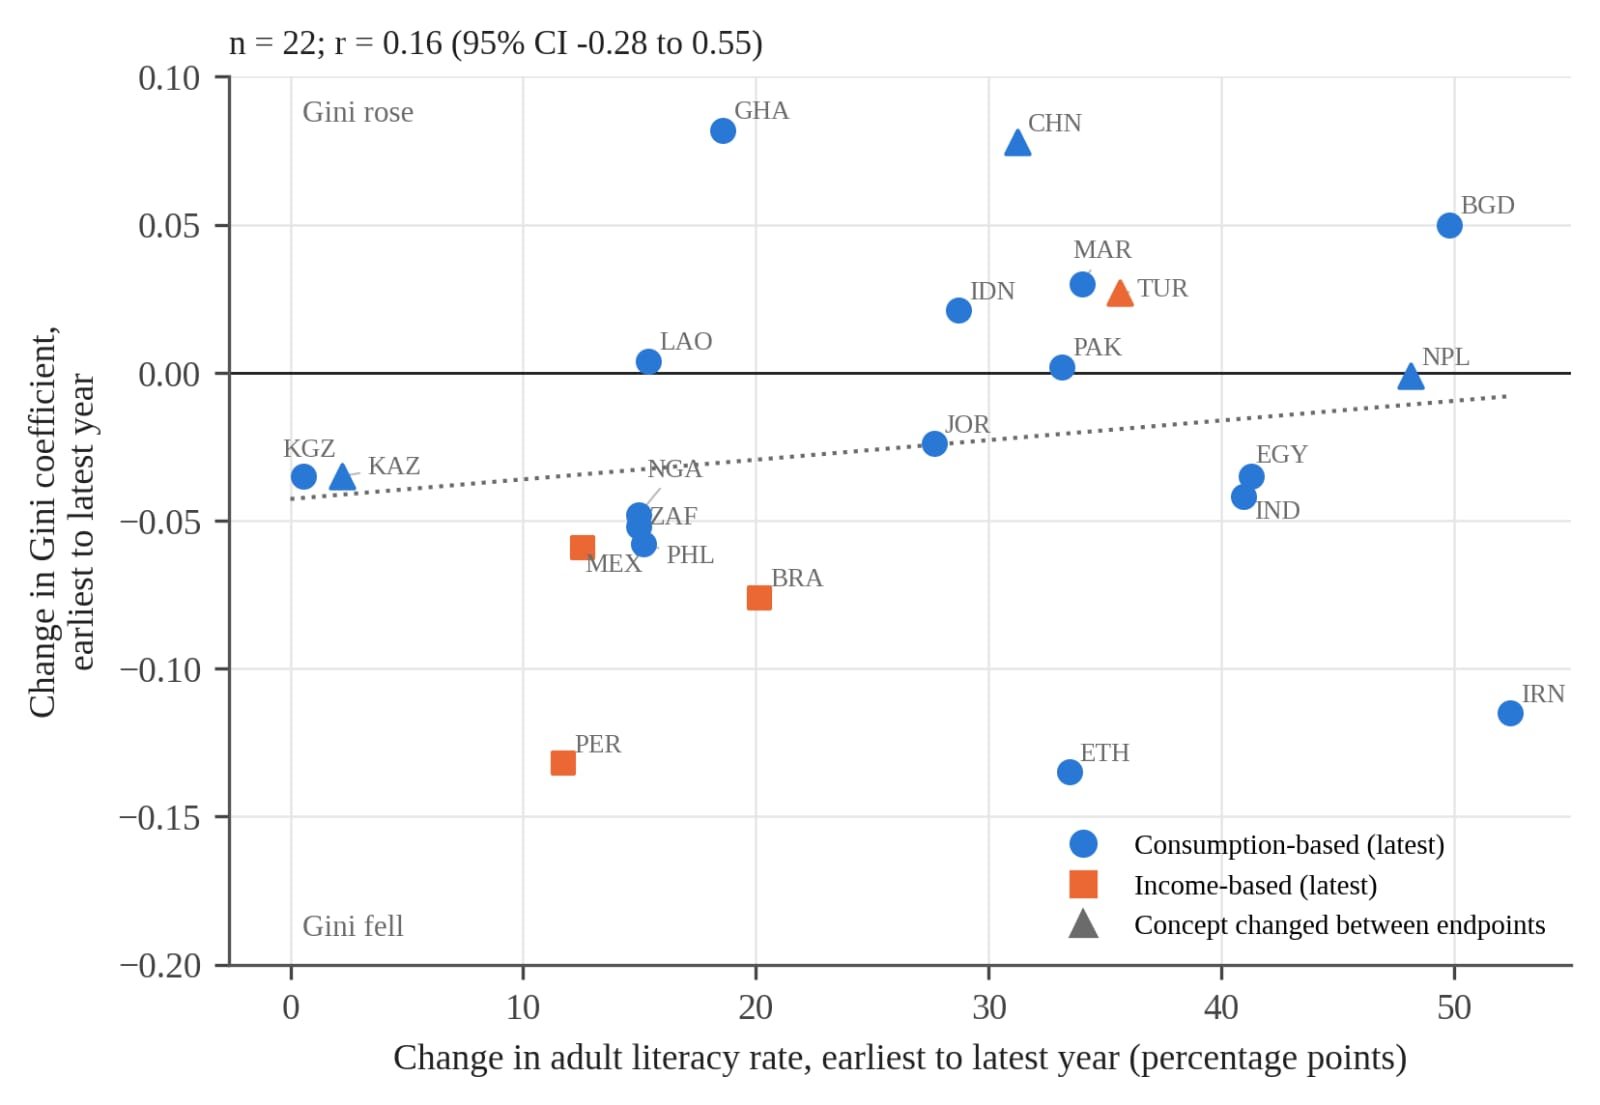
Fig. 4: Change in adult literacy rate (percentage points) against change in Gini coefficient, earliest to latest available year (n = 22; intervals differ by country, see Appendix Table A1); squares are income-based latest estimates and triangles mark countries whose welfare concept changed between endpoints; dotted line is a descriptive least-squares fit
Source: Authors’ calculations based on [1, 18]; welfare type from [19]
Fig. 5 adds longer series for five countries. China’s Gini rose from about 0.28 in 1981 to about 0.43 in 2008 and then eased to 0.36 by 2022, while literacy was also rising. Brazil’s Gini peaked just above 0.60 around 1990 and has since fallen to about 0.50. South Africa’s rose from 0.59 in 1993 to about 0.65 in the mid-2000s before falling to 0.54 in 2022. Large movements between survey rounds should be read with care, because changes in survey design and welfare concept can affect the estimates.
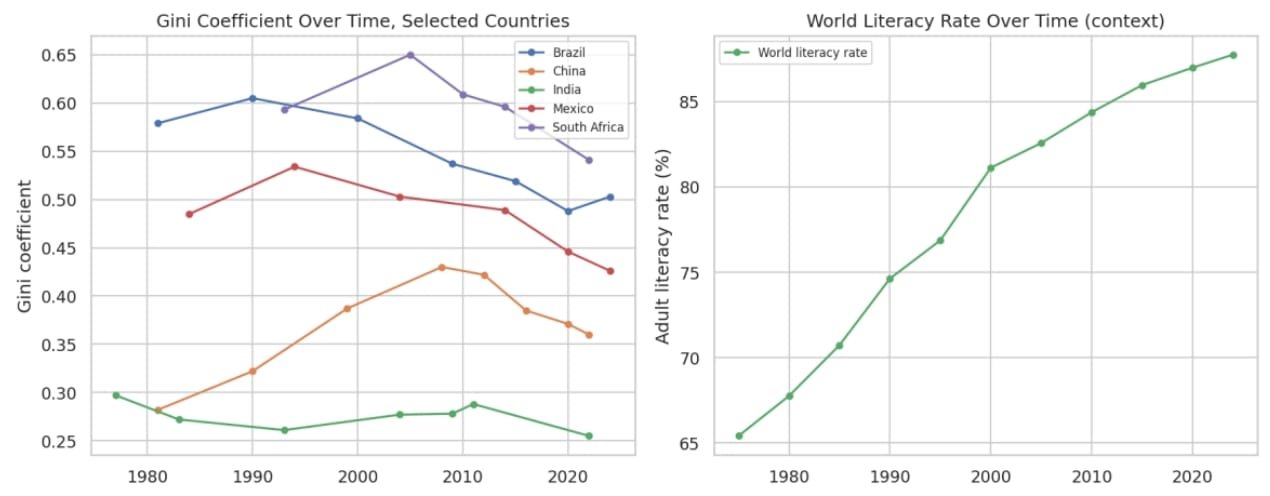
Fig. 5: Gini coefficient over time for five countries with long series (left) and world adult literacy rate, for context (right); survey years and welfare concepts differ by country
Source: Authors’ analysis of [1, 18]
Sensitivity analyses
Table 5 reports how the results change under different timing and measurement choices. Excluding South Africa changes little. Excluding the income-based countries moves the latest-value correlation towards zero (r = 0.11 without Brazil, Mexico and Peru; r = 0.03 when Türkiye is also excluded). For the change analysis, excluding the four countries whose welfare concept changed between endpoints (China, Kazakhstan, Nepal and Türkiye) leaves a weaker association (r = 0.09; n = 18). The most notable result comes from the timing window. When the analysis is restricted to the 18 countries whose latest literacy and Gini observations are no more than five years apart and whose Gini is from 2015 or later, the association becomes moderately positive (r = 0.49; 95% CI 0.03 to 0.78; p = 0.040). The five countries dropped are Jordan, Kazakhstan, Kenya, Kyrgyzstan and Morocco, including Kazakhstan and Kyrgyzstan, which combine near-universal literacy (measured in 2009) with low Gini values. This positive association weakens and its interval includes zero when the income-based countries are removed (r = 0.39 without Brazil, Mexico and Peru; r = 0.32 when Türkiye is also excluded). It is also one of several exploratory tests, so it should not be treated as a confirmed finding.
Table 5: Sensitivity analyses
|
Specification |
n |
r |
95% CI |
p |
ρ |
|
A. Latest literacy vs latest Gini (main) |
23 |
0.226 |
−0.205 to 0.584 |
0.299 |
0.143 |
|
excluding South Africa |
22 |
0.200 |
−0.242 to 0.573 |
0.373 |
0.129 |
|
excluding Brazil, Mexico, Peru (income-based) |
20 |
0.106 |
−0.353 to 0.524 |
0.656 |
0.047 |
|
excluding Brazil, Mexico, Peru, Türkiye |
19 |
0.032 |
−0.429 to 0.479 |
0.897 |
−0.033 |
|
timing window W (≤ 5 years apart; Gini ≥ 2015) |
18 |
0.489 |
0.028 to 0.778 |
0.040 |
0.540 |
|
window W, excluding Brazil, Mexico, Peru |
15 |
0.391 |
−0.152 to 0.752 |
0.150 |
0.507 |
|
window W, excluding Brazil, Mexico, Peru, Türkiye |
14 |
0.316 |
−0.257 to 0.725 |
0.270 |
0.429 |
|
C. Literacy change vs Gini change (main) |
22 |
0.164 |
−0.276 to 0.548 |
0.465 |
0.263 |
|
excluding South Africa |
21 |
0.150 |
−0.301 to 0.546 |
0.516 |
0.228 |
|
excluding Brazil, Mexico, Peru |
19 |
0.024 |
−0.435 to 0.473 |
0.923 |
0.139 |
|
excluding China, Kazakhstan, Nepal, Türkiye (concept changed) |
18 |
0.087 |
−0.396 to 0.532 |
0.732 |
0.229 |
|
annualised changes |
22 |
0.249 |
−0.193 to 0.607 |
0.264 |
0.379 |
Source: Authors’ calculations based on [1, 18]; welfare type from [19]. The enrolment analysis (B) contains no income-based country other than Brazil and does not include South Africa, so its sensitivity results are not shown.
Interpretation / discussion of findings
The discussion keeps three kinds of statement apart: what was measured, what is inferred from the measurements, and what is taken from prior literature only. Table 6 summarises them.
Finding (measured). Three things were measured: the latest-value associations, the endpoint-change association, and the sensitivity of both to timing and measurement choices. Across all of them, no specification shows the negative association that would be expected if higher literacy or enrolment accompanied lower income inequality. The estimates range from about zero to moderately positive, their intervals are wide, and their size depends on how observations are timed and on whether countries with income-based Gini estimates are included.
Interpretation (inferred from the measurements). Two inferences are drawn. Both go beyond the numbers and are weaker than the measurements themselves. First, in these countries, basic education indicators are not a reliable signal of lower income inequality. This does not show that education has no equalising effect; the samples are small, the intervals are wide, and the design cannot identify effects. Second, part of the positive latest-value association may reflect the welfare concept rather than education. The association is concentrated among countries with income-based Gini estimates, which tend to be higher than consumption-based estimates [11] and which in this sample are also high-literacy Latin American countries and Türkiye, and it moves towards zero when they are excluded. This is an inference from the sensitivity analyses, not a tested result, because the welfare concept is confounded with region: the income-based countries are three Latin American countries and Türkiye, so the analysis cannot separate the concept from other regional differences. For China, Kazakhstan, Nepal and Türkiye, the endpoint change in Gini also compares estimates on different concepts, so their direction should be read with care.
Connection with previous research (literature only, not tested in this study). The measured pattern is consistent with studies of educational expansion, which find that more schooling widens access without automatically equalising opportunity, because advantaged groups tend to benefit first and inequality can reappear at later stages of the educational pathway [3, 6]. Prior research also offers explanations that this study cannot examine. Adult literacy captures basic skills, whereas income inequality reflects differences in earnings that depend heavily on secondary and higher education, learning quality and access to good jobs, which are separate stages from basic education [5]. Mobility is weaker where inequality is high and families find it hard to borrow [9], and development raises educational mobility more where inequality is lower [10]. Redistributive welfare regimes and wider access to education are associated with weaker links between parents’ and children’s positions [13]. The countries in which inequality rose alongside rising literacy are consistent with these accounts, but the present data cannot show why inequality rose in those countries. Likewise, Brazil’s falling Gini alongside a literacy gain does not identify redistribution or labour-market change as the cause. Testing any of these explanations would require covariates, aligned time periods, policy measures and harmonised inequality data.
Relation to intergenerational mobility (not measured). Because the analysis measures income inequality rather than mobility, it cannot show whether education has made these societies more mobile. The GDIM literature, which finds lower educational mobility in developing economies [2, 20] and lower mobility where inequality is higher [4], is used as a point of comparison, not as confirmation.
Table 6: Status of the paper’s main statements
|
Status |
Statement |
Basis |
|
Measured |
Latest literacy and latest enrolment are weakly and imprecisely associated with the latest Gini coefficient (r = 0.23 and r = 0.08) |
Table 4; Fig. 3 |
|
Measured |
Literacy rose in all 22 countries with change data; the Gini coefficient fell in 14 and rose in 8; the change association is weak and imprecise (r = 0.16) |
Table 4; Fig. 4 |
|
Measured |
The latest-value association moves towards zero when countries with income-based estimates are excluded, and is larger within the timing window (r = 0.49, n = 18) |
Table 5 |
|
Inferred |
In these countries, basic education indicators are not a reliable signal of lower income inequality |
Reading of Tables 4 and 5; limited by small samples and wide intervals |
|
Inferred |
Part of the positive association may reflect the welfare concept of the Gini estimate rather than education |
Reading of Table 5 with [11, 19]; concept confounded with region |
|
Literature only |
Expansion widens access without equalising opportunity, because advantaged groups benefit first |
|
|
Literature only |
Earnings depend on later stages of education and on labour markets, which basic indicators do not capture |
[5]; not tested |
|
Literature only |
Educational mobility is lower in developing countries and where inequality is higher |
|
|
Literature only |
The effect of expansion depends on its design and on accompanying social policy |
Source: Compiled by the authors
CONCLUSION
This paper described how adult literacy and primary gross enrolment are associated with income inequality in a purposively selected group of low- and middle-income countries. It did not estimate causal effects or measure intergenerational mobility or policy. In the main analyses, the associations were weakly positive and imprecise: r = 0.23 for latest literacy (n = 23), r = 0.08 for latest enrolment (n = 14) and r = 0.16 for endpoint changes (n = 22), with 95% confidence intervals that include zero and both negative and positive values. Literacy rose in all 22 countries with change data, while the Gini coefficient fell in 14. In an exploratory analysis with better-aligned timing, the latest-value association was moderately positive, but it weakened when income-based Gini estimates were removed, which points to measurement differences. No specification showed the negative association that would indicate higher education levels accompanying lower inequality.
The main implication, which is an inference from these measurements, is for monitoring. In these countries, gains in literacy and enrolment should not be read as evidence of progress on income inequality: progress on SDG 4 indicators and progress on SDG 10 need to be tracked separately. The literature reviewed suggests, though this study does not test it, that education is more likely to reduce inequality when expansion is accompanied by improvements in school quality and completion, fair access to higher levels of education, and social policies such as early-childhood support [14, 16].
The conclusions are limited in several ways. The associations are descriptive and cannot establish causation; economic growth, tax and benefit policy and other changes may affect both education and inequality. The roster is a small purposive sample without a recorded selection frame, so the findings cannot be generalised. Observations are asynchronous, endpoint intervals differ across countries, and the Gini series mixes income and consumption concepts, and four countries change concept between endpoints. The welfare concept is recorded for every observation but is confounded with region, so its effect cannot be separated from regional differences. Literacy and gross enrolment capture only basic education, and mobility was not measured. The one-month duration of the project also limited the number of indicators and robustness checks.
Future research should use Gini estimates with a single welfare concept; align education and inequality observations within common time windows, ideally in a panel with repeated observations; add measures of secondary and tertiary completion and of learning; and link the same countries to the GDIM’s parent–child mobility estimates. A prespecified sampling frame would make the country selection reproducible, and prespecified Human Development Index (HDI) groups would allow comparisons by development level, which this study does not make. Until then, the evidence supports only a bounded conclusion: in this dataset, higher or rising basic-education indicators did not coincide with lower or falling income inequality.
DATA AND CODE AVAILABILITY
The analysis dataset (the country-level analysis columns of the merged file) and five Python scripts accompany this manuscript as supplementary files. The dataset includes the welfare type, survey year and PIP value of every Gini observation. The scripts reproduce the statistics in the text, Tables 3–5, Appendix Table A1 and Figs. 1–4, and a verification script compares each reported value with the recomputed one. Fig. 5 was produced from the full annual series downloaded from the same sources. The source indicators are publicly available from Our World in Data [1, 17, 18].
APPENDIX
Table A1: Country-level audit of values, observation years and inclusion in each analysis
|
Country |
Literacy, earliest (year) |
Literacy, latest (year) |
Enrolment, latest (year) |
Gini, earliest (year) |
Gini, latest (year) |
Years between endpoints: literacy / Gini |
Welfare type: earliest → latest |
Used in |
|
Afghanistan |
18.2 (1979) |
37.3 (2021) |
112.2 (2023) |
— |
— |
42 / — |
— |
none |
|
Bangladesh |
29.2 (1981) |
79.0 (2022) |
106.5 (2024) |
0.259 (1983) |
0.309 (2022) |
41 / 39 |
C → C |
A, B, C, W |
|
Brazil |
74.6 (1980) |
94.7 (2024) |
104.3 (2024) |
0.579 (1981) |
0.503 (2024) |
44 / 43 |
I → I |
A, B, C, W |
|
China |
65.5 (1982) |
96.7 (2020) |
99.6 (2024) |
0.282 (1981) |
0.360 (2022) |
38 / 41 |
I → C |
A, B, C, W |
|
Egypt |
38.2 (1976) |
79.5 (2022) |
96.7 (2024) |
0.320 (1990) |
0.285 (2021) |
46 / 31 |
C → C |
A, B, C, W |
|
Ethiopia |
27.0 (1994) |
60.5 (2022) |
84.4 (2024) |
0.446 (1995) |
0.311 (2021) |
28 / 26 |
C → C |
A, B, C, W |
|
Ghana |
57.9 (2000) |
76.5 (2021) |
101.0 (2024) |
0.353 (1987) |
0.435 (2016) |
21 / 29 |
C → C |
A, B, C, W |
|
India |
40.8 (1981) |
81.7 (2023) |
111.0 (2025) |
0.297 (1977) |
0.255 (2022) |
42 / 45 |
C → C |
A, B, C, W |
|
Indonesia |
67.3 (1980) |
96.0 (2020) |
100.4 (2025) |
0.323 (1984) |
0.344 (2025) |
40 / 41 |
C → C |
A, B, C, W |
|
Iran |
36.5 (1976) |
88.9 (2023) |
102.0 (2023) |
0.474 (1986) |
0.359 (2023) |
47 / 37 |
C → C |
A, B, C, W |
|
Jordan |
66.8 (1979) |
94.4 (2024) |
98.6 (2024) |
0.361 (1986) |
0.337 (2010) |
45 / 24 |
C → C |
A, B, C |
|
Kazakhstan |
97.5 (1989) |
99.7 (2009) |
97.3 (2025) |
0.327 (1993) |
0.292 (2021) |
20 / 28 |
I → C |
A, B, C |
|
Kenya |
82.2 (2000) |
82.2 (2000) |
98.2 (2023) |
0.569 (1992) |
0.385 (2022) |
— / 30 |
C → C |
A, B |
|
Kuwait |
59.6 (1975) |
96.5 (2020) |
82.4 (2021) |
— |
— |
45 / — |
— |
none |
|
Kyrgyzstan |
98.7 (1999) |
99.2 (2009) |
99.0 (2025) |
0.310 (2000) |
0.275 (2024) |
10 / 24 |
C → C |
A, B, C |
|
Laos |
60.2 (1995) |
75.6 (2023) |
93.1 (2025) |
0.343 (1992) |
0.347 (2024) |
28 / 32 |
C → C |
A, B, C, W |
|
Mexico |
83.0 (1980) |
95.5 (2024) |
— |
0.485 (1984) |
0.426 (2024) |
44 / 40 |
I → I |
A, C, W |
|
Morocco |
30.3 (1982) |
64.3 (2014) |
— |
0.365 (1984) |
0.395 (2013) |
32 / 29 |
C → C |
A, C |
|
Nepal |
20.6 (1981) |
68.7 (2019) |
— |
0.301 (1984) |
0.300 (2022) |
38 / 38 |
I → C |
A, C, W |
|
Nigeria |
55.5 (1991) |
70.4 (2024) |
— |
0.387 (1985) |
0.339 (2022) |
33 / 37 |
C → C |
A, C, W |
|
Pakistan |
25.7 (1981) |
58.9 (2021) |
— |
0.333 (1987) |
0.335 (2024) |
40 / 37 |
C → C |
A, C, W |
|
Peru |
81.9 (1981) |
93.7 (2024) |
— |
0.533 (1997) |
0.401 (2024) |
43 / 27 |
I → I |
A, C, W |
|
Philippines |
83.3 (1980) |
98.5 (2020) |
— |
0.410 (1985) |
0.352 (2023) |
40 / 38 |
C → C |
A, C, W |
|
South Africa |
76.2 (1980) |
91.2 (2024) |
— |
0.593 (1993) |
0.541 (2022) |
44 / 29 |
C → C |
A, C, W |
|
Türkiye |
61.6 (1975) |
97.3 (2021) |
— |
0.410 (1987) |
0.437 (2023) |
46 / 36 |
C → I |
A, C, W |
Source: Authors’ compilation from [1, 17, 18]. Values are the earliest and latest available observations; enrolment is missing for nine countries. Welfare type: C = consumption, I = income (World Bank PIP [19]); the Philippines’ 2023 income-based record is not used. Used in: A = literacy–Gini (latest), B = enrolment–Gini (latest), C = endpoint change, W = timing-window sensitivity analysis.
REFERENCES
[1]UNESCO Institute for Statistics, “Literacy rates among adults,” dataset, Our World in Data, 2026. [Online]. Available: https://ourworldindata.org/grapher/literacy-rate-adults (accessed Sep. 17, 2026).
[2]R. Van der Weide, C. Lakner, D. G. Mahler, A. Narayan, and R. Gupta, “Intergenerational mobility around the world: A new database,” Journal of Development Economics, vol. 166, Art. no. 103167, 2024, doi: 10.1016/j.jdeveco.2023.103167.
[3]E. Bar-Haim and Y. Shavit, “Expansion and inequality of educational opportunity: A comparative study,” Research in Social Stratification and Mobility, vol. 31, pp. 22–31, 2013, doi: 10.1016/j.rssm.2012.10.001.
[4]A. Narayan et al., Fair Progress? Economic Mobility Across Generations Around the World. Washington, DC, USA: World Bank, 2018, doi: 10.1596/978-1-4648-1210-1.
[5]R. Breen and J. O. Jonsson, “Inequality of opportunity in comparative perspective: Recent research on educational attainment and social mobility,” Annual Review of Sociology, vol. 31, pp. 223–243, 2005, doi: 10.1146/annurev.soc.31.041304.122232.
[6]P. Boniolo and S. Lemos, “Social stratification factors in educational transitions: A comparative analysis of Argentina, Chile and Mexico,” Frontiers in Sociology, vol. 11, Art. no. 1764458, 2026, doi: 10.3389/fsoc.2026.1764458.
[7]F. Torche, “Educational mobility in the developing world,” in Social Mobility in Developing Countries: Concepts, Methods, and Determinants, V. Iversen, A. Krishna, and K. Sen, Eds. Oxford, U.K.: Oxford University Press, 2021, pp. 139–171, doi: 10.1093/oso/9780192896858.003.0007.
[8]T. Leone, “Intergenerational mobility in education: Estimates of the worldwide variation,” Journal of Economic Development, vol. 44, no. 4, pp. 1–42, 2019. [Online]. Available: https://ideas.repec.org/a/jed/journl/v44y2019i4p1-42.html
[9]H. Lee and J.-W. Lee, “Patterns and determinants of intergenerational educational mobility: Evidence across countries,” Pacific Economic Review, vol. 26, no. 1, pp. 70–90, 2021, doi: 10.1111/1468-0106.12342.
[10]J. Li and Q. Zhang, “Economic development benefits or social inequality hinders? Intergenerational educational mobility in 49 countries,” Humanities and Social Sciences Communications, vol. 12, Art. no. 1348, 2025, doi: 10.1057/s41599-025-05687-x.
[11]C. Lakner, M. Negre, J. Cuesta, and A. Silwal, “Measuring inequality isn’t easy or straightforward – here’s why,” Let’s Talk Development (World Bank blog), Nov. 3, 2016. [Online]. Available: https://blogs.worldbank.org/developmenttalk/measuring-inequality-isn-t-easy-or-straightforward-here-s-why
[12]World Bank, “Poverty & Equity Brief: Türkiye,” World Bank, Washington, DC, USA, 2024. [Online]. Available: https://documents1.worldbank.org/curated/en/099061224142029970/pdf/P180097-fc6f6d1d-9a8e-4a8b-867a-3dae6c3c00df.pdf
[13]E. Beller and M. Hout, “Welfare states and social mobility: How educational and social policy may affect cross-national differences in the association between occupational origins and destinations,” Research in Social Stratification and Mobility, vol. 24, no. 4, pp. 353–365, 2006, doi: 10.1016/j.rssm.2006.10.001.
[14]O. Causa and Å. Johansson, “Intergenerational social mobility in OECD countries,” OECD Journal: Economic Studies, vol. 2010, no. 1, pp. 1–44, 2010, doi: 10.1787/eco_studies-2010-5km33scz5rjj.
[15]O. Causa, A. Vindics, and O. Akgun, “An empirical investigation on the drivers of income redistribution across OECD countries,” OECD Economics Department Working Papers no. 1488, OECD Publishing, Paris, France, 2018, doi: 10.1787/5cb47f33-en.
[16]H. Holmlund, “Education and social mobility,” IFAU Working Paper 2023:18, Institute for Evaluation of Labour Market and Education Policy, Uppsala, Sweden, 2023. [Online]. Available: https://www.ifau.se/globalassets/pdf/se/2023/wp-2023-18-education-and-social-mobility.pdf
[17]UNESCO Institute for Statistics, “School enrollment rates: Gross enrollment, primary,” dataset, Our World in Data, 2026. [Online]. Available: https://ourworldindata.org/grapher/school-enrolment?enrolment_type=gross_enrolment&level=primary&sex=both (accessed Sep. 17, 2026).
[18]World Bank, “Poverty and Inequality Platform: Gini coefficient (version 20260324),” dataset, Our World in Data, 2026. [Online]. Available: https://ourworldindata.org/grapher/economic-inequality-gini-index (accessed Sep. 17, 2026).
[19]World Bank, “Poverty and Inequality Platform (PIP) API: welfare_type field for survey-year Gini estimates,” World Bank, Washington, DC, USA. [Online]. Available: https://api.worldbank.org/pip/v1/pip (accessed Oct. 4, 2026).
[20]R. Van der Weide, C. Lakner, D. G. Mahler, A. Narayan, and R. Ramasubbaiah, “Intergenerational mobility around the world,” Policy Research Working Paper no. 9707, World Bank, Washington, DC, USA, 2021, doi: 10.1596/1813-9450-9707