A N A L Y S I S R E P O R T
A Policy Review of the Make in India Initiative
Did the decadal policy framework achieve its targets of broad-based manufacturing competitiveness and self-reliance?
Team: Finance Research
Authors: Harshita Gupta, Manya Jindal, Aarav Thomas, Shiksha Jha, Anushka Gupta, Priyasha Jena
Data sources: Ministry of Commerce & Industry, Ministry of MSME, RBI, NITI Aayog
Coverage: 2014–2024 · Decadal Structural Analysis · Manufacturing & Trade
June 2026
ABSTRACT:
National economies today are a reflection of evolving dynamics between Geopolitics, Geo-economics, and National Aspirations. With greater global integration and trade connectivity, a large part of the economy becomes embedded with international markets, their trends, and competitiveness of global firms at par with global competitors. Make in India initiative 2014 reflected similar prevailing dynamics. Make in India initiative 2014, aimed to rewrite the story aiming for sector wide reforms in manufacturing via heterogenous policy measures under single umbrella of “Make in India” and reviving manufacturing as a major powerhouse in India growing ambitions of a developing nation to a developed one. Protectionism for Indian manufactures through tariff, non-tariff barriers and restrictive trade regulations since FY15 Make in India initiative, boast to MSMEs and PLI schemes during 2020 Atmanirbhar Bharat Abhiyan, Quality control orders and restricting imports under CAROTAR rules (Customs Administration of Rules of Origin under Trade Agreements) were all aimed to reinstating and revitalizing the Manufacturing sector.
This article critically examines the comparative success of the initiative for a dominant organized Large Firms vis a vis the unorganized backbone of India’s manufacturing sector under MSME. It also evaluates how far the set ambitions for global competitiveness and growth in the External sector have been achieved in the span of a decade since the policy inception in 2014 to 2024. The analysis suggests that while policy measures create an environment for reforms and changes, the dominant players perhaps have more room to tweak policies in their favor exploiting their dominance and might in market. Also sustained growth needs structural reforms, innovation alongside protectionism, rather than fortification alone, which falls short of ambitious targets. It also suggests how policies can be realigned for sustainable, equitable growth momentum rather than targeted growth.
INTRODUCTION
25 sector wide industrial reforms were modernized under Make in India initiative in 2014 to change the picture of Manufacturing. From increasing share of industry led growth in national GDP contributions to making significant gains in External sector thus augmenting Indias growth towards a developed formalized. The aim was multisectoral and ambitious, hence the policy measures adopted were heterogenous that simultaneously supported industries at different stages of development, from labor- and capital-intensive to high-tech industries and advanced services (CESifo-Forum make-in-India, 2022). The policy perhaps became too ambitious, it aims to easing and levelling business field as well as restructuring foreign perception of the same to attract FDI, improving innovation and thereby increasing global competitiveness of Indias industry in global market. This manufacturing led growth was envisioned to also absorb the large labour surplus in India’s economy, thus churning demographic potential into growth dividends. The aims of the policies were layered, and multifaceted, all trying to reap the fruits of Manufacturing led growth.
The objectives were broad but fall narrowed on ground. The objectives it set out to achieve over the next 5 years fall flat even after a decade of reforms since the launch of Make in India in 2014. The graphs that measure variables across the decade of reforms hardly make any spikes or shifts except FY19, FY20 and largely appear to fall flat, in spite of protectionist policies. Raising tariffs, putting curbs on imports as well as increasing anti-dumping duties, were all put in place to fortify the local manufacturers from global players and allow them the gestation phase to develop competitiveness at their par. Amidst the challenges of spurring growth, the policy reforms also distorted the level playing field of business leading to differential gains across sectors and even firm s sizes. Large firms with dominant presence, structural build and influence could proactively use the policy changes in their favor to gain more revenue while even crowding out MSMEs in some labour intensive sectors like textile industries. On the other side, MSMEs and small firms largely unorganized, fragmented, lacking years of structural reforms and not integrated with relevant Industry technologies like Industry 4.0; policies like PLI (Production Linked Incentives) heavily incentivizes large firms to boost high-volume revenue and global competitiveness. They were unable to unlock and exploit the potential of reforms in a decade long Manufacturing push.
Small firms and MSME, although in terms of output, contribute 35.4 vis a vis Large Firms domination of ~65%, but the other variables are equally comparable with dominant Large Firms. The MSMEs account for 48.5% of Exports and 62% of overall employment. Therefore, their growth and understanding of the differential impacts of policies on MSME vis a vis Large Firms becomes a policy imperative. Their growth not only creates economic momentum but also creates a larger impact on ground with development, external sector growth and structural strengths in manufacturing sector, while boasting employment generation parallelly. Similarly, any distortion here creates cascading effects on larger economies.
This paper seeks to understand and critically analyze through hypothesis, data, reasoning and analysis the differential impact of policies in Manufacturing under Make in India initiative during the time frame of a decade from 2014-2024. The paper also analyses data to understand how these reform during the same tenure of 2014-2024 impacted External sector growth across various variables like GDP growth, GVA in manufacturing sector, Share of Exports vs Imports due to tariff policies and protectionism, FDI and overall global competitiveness of Indias manufacturing sector as a whole in global market. Both these research objectives try to assess and gaze through an unbiased lens, the policies and their set objectives, to understand the differential impact of policies based on sizes of the firms in conjunction to how far it was able to achieve the said ambitions.
The research paper aims to arrive at critical insights to make changes and reform policies to create more equitable growth environments, that sustain growth momentum; and not just ease of doing business for large firms, but level playing field for all players small or large effectively. Also, it will aid us in measuring the distance of the impacts of policies from the ambitious objective over a span of 10 years and understanding where it fell short. The 25 sectors wide industry reform till 2026 have still held manufacturing sector to cumulatively contribute 14% to GDP; which is halfway from the ambitious objective under 2014 Make in India policy, aimed to raise the contribution of the manufacturing sector to 25% of the GDP in Indias overall economy.
Existing studies on this policy largely examine the impact of the policy interventions or critically identify the major fallouts in implementation across different time phases like 3-year frame, 5-year frame, post-covid and so on. This paper sets out to reconcile those findings as foundations and aims to build on them for a decade long review of the policy to examine how the “Make in India” initiative influenced manufacturing sector as a whole between 2014–2024 by evaluating (i) differential policy impacts on MSMEs vis a vis large firms and (ii) the effects of tariff-based industrial policy on export competitiveness and manufacturing diversification from macroeconomic lens.
LITERATURE REVIEW
Over the last decade, across the world, industrial policy has again become an important strategy for economic development. Earlier critics believed that government intervention for attempting to “pick winners”, could lead to poor policy decisions. Now-a-days, governments look at industrial policy as a useful way to strengthen their economies, improvement in the position of global vale chains, deal with global challenges and encourage technological growth. In India, this approach directed the launch of the “Make in India” initiative in 2014. The programme aimed to increase the share of manufacturing to 25% of gross value added (GVA), create around 100 million manufacturing jobs, and make India a global manufacturing and export hub (Bhattacharyya,2017). However, repeated assessments suggest that there were persistent structural and implementation challenges that restrained performance of the policy. Gradually these goals became difficult to achieve in the early years. Later, the government introduced Production Linked Incentive (PLI) schemes to encourage firms to invest in high technology industries and certain specific domestically important sectors and push both manufacturing and exports (Aiginger & Ketels, 2024).
This literature review examines recent studies related to the key outcomes of India’s Industrial Policies and changes in the tariffs between 2014-2024. It analyses existing studies to understand how these policies have influenced manufacturing, trade, and industrial growth under the Make in India umbrella initiative.
The analysis is based on two main research questions:
- RQ1: To what extent have the policy measure and higher tariff rates introduced under the Make in India initiative and have affected MSMEs and large vertically integrated firms differently? Along with this, why did larger firms receive a greater share of the benefits from these policies?
- RQ2: What impact have India’s protective tariff policies had on global export competitiveness and domestic manufacturing diversification, and what factors have limited their contribution to achieving industrial self- reliance?
Rajan and Lamba (2024) argue that the traditional manufacturing led model is increasingly facing challenges because of automation and rising protectionism across the world. They suggest that India has a stronger advantage in high-skill manufacturing activities that are closely linked with services than relying only on traditional manufacturing. Nam (2022) supports this view by pointing out that although India’s Ease of Doing Business (EoDB) ranking improved significantly from 142nd in 2014 to 63rd in 2019; but at the same time, the performance of the manufacturing sector did not improve.
- GVA Stagnation: The share of manufacturing in Gross Value Added (GVA) remained between 14.5% and 16.6%, well below the government’s target of 25%.
- Employment Contraction: During this period, manufacturing employment declined from about 51 million to 27.3 million workers, indicating a shift towards more capital-intensive production.
- Investment Slowdown: Fall in private sector Gross Fixed Capital Formation (GFCF) from 23.1% to 21.8% of GDP, suggests a long -term private investment decline.
- The share of India in global merchandise exports increased from 1.70 per cent in 2014 to 1.82 per cent in 2023 (WTO), a near 0.12% increase in a decade, with policies in action.
Studies suggest that simplifying administrative paperwork through digitization and improving the Ease of Doing Business alone is not enough to strengthen the manufacturing sector. Long-term growth also requires big investment in technology, infrastructure, and skilled human resources. As a result, the early phases of the Make in India initiative focused more on improving business related indicators than on building a strong industrial base, making domestic industries less prepared when higher import tariffs were introduced.
RQ1: Industrial Policy Asymmetry (Large Firms vs. MSMEs)
One of the major industrial policy measures introduced under the Make in India initiative is The Production Linked Incentive (PLI) scheme. The main aim is to promote manufacturing as its design makes it easier for large companies to make profits from MSMEs. High production targets and minimum investment requirements are directly linked to incentives which many small businesses find difficult to meet.
According to Mihai Varga (2008) follows the detailed regulations, regular audits, and verification procedures requiring strong legal and administrative support, which is often beyond the capacity of smaller firms. This resulted in the limited participation of MSMEs in the PLI scheme, despite its broader objective of supporting industrial growth. Many small businesses face financial problems, including limited working capital and cash reserves, which makes it hard for them to qualify for these incentives.
Research by Prabhakar et al. (2023) for the Centre for Social and Economic Progress (CSEP) founds that higher import duties are mainly imposed on intermediate goods and machinery rather than on finished products. Their analysis of HS 6-digit product lines showed that around 92.5% of products are related to import tariffs, with most duties lying between 10% to 15%. This shows more than USD $ 242 billion in trade, accounting for nearly 54% of India’s total imports. Most importantly, over 66% of these products are capital good that manufacturers need during the production process.
This creates what economists used to call- The Inverted Duty Structure, which uses the Effective Rate of Protection (ERP). As Pathania and Bhattacharjee (2020) highlights that when tariffs on intermediate inputs are higher than tariffs on finished products, then domestic value-added production faces a negative ERP. The situation has become more challenging with the growing use of Non- Tariff Measures.
- Quality Control Orders (QCOs): one of the most significant measures is the introduction of quality control orders, which increased from 51 cumulative orders in 2015 to 765 by 2024.
- Anti-Dumping Duties (ADD): it has been imposed on nearly 7.9% of product lines to prevent the import of low-priced foreign goods
Large, vertically integrated are generally better in managing these additional costs and regulatory requirements. They have greater financial resources to maintain compliance teams, complete the bureau of Indian standard (BIS) for approval process within their own production facilities. On the other hand, many MSMEs depend on imported raw materials and intermediate goods for their day-to-day operations. when Quality control orders interrupt the supply of these inputs, or when foreign suppliers avoid the Indian market because of complex registration procedures, small businesses which experience lack of essential material.
Data from NITI Aayog and CSEP indicates that these shortages pushed domestic prices for critical inputs 15% to 30% above global benchmarks. These include specific steel grades, polyester filaments, and chemical polymers. Lacking the market’s power to pass these costs to final consumers, MSMEs saw their profit margins collapse. Mishra et al. (2023) further describes this situation as the “performance bonsai trap” in which high compliance costs and all the policy-related barriers prevent small firms from expanding their operations. Similarly, Mehrotra and Giri (2023) argue that these challenges are encouraging many MSMEs to remain in the informal sector instead of growing into larger and organized business sectors. However, this limits their participation in global value chains and also eventually slows their long-term development.
RQ2: Trade Performance, Export Competitiveness, and Manufacturing Diversification:
Although India has increased their import tariffs to protect domestic industries and encourage manufacturing, this policy has also created challenges for the country’s integration into the global trade, Chawla and Kumar (2023). Using OECD trade in value added data (TiVA), it is found that India’s participation in global value chains (GVCs) remains lower than several neighboring economies. Safeguard duties and higher tariffs on intermediate goods have made imported production more expensive, and reducing the ability of Indian manufacturers to integrate into global supply chains. As a result, India is far behind of countries like Vietnam and Thailand, which have adopted more open trade policies and have been more successful in attracting manufacturing and export opportunities.
This situation also reflects what Goswani et al. (2023) describe as the Tariff Elasticity Paradox. Based on data from 2001 to 2021, it was found that higher import tariffs did not lead to a significant increase in domestic industrial production. Instead, they mainly raised the cost of production by making imported products more expensive. Similarly, Narayanan et al. (2020) showed in his sector-wise analysis that despite stronger tariffs protection, the chemical and rubber industries contracted by 0.62% while the textile sector recorded only 2.05% growth even though it was protected by nan average import tariff of 23.45%. in today’s global economy, most products are manufactured through international supply chains rather than in a single country. Manufacturers depend on affordable imported raw materials and intermediate goods to remain competitive in export markets. High tariffs and Quality Control Orders (QCO) increase the cost of these inputs; exporters face higher production costs which makes it more difficult for them to compete internationally. Narayanan et al. (2020) also found that the effects of these trade policies extended beyond manufacturing and affected several service sectors that support trade. His study reports the following: 1.78% decline in sea transport employment followed by 0.89% decline in business services, employment drops in insurance infrastructure by 0.44%, Communication Networks employment drops by 0.39%. The connection between these outcomes becomes clear. Higher tariffs on intermediate goods increase production as well as trading costs, which can reduce the overall trade volume. However, when imports and exports decline, the demand for services such as shipping, logistics, customs clearance, warehousing, and maritime insurance also falls.
Gereffi and Fernandez-Stark (2016) explain that these services are an essential part of global value chains because they support the supply of goods across countries. Since many MSMEs operate in these service sectors, they were among the businesses most affected by the decline in this trade activity. Arguments presented by Rajan and Lamba (2024) in Breaking the Mold, support the services-led growth. They argue that the slow growth of the manufacturing sector is not only the result of policy reforms but also reflects India’s natural strength in high-skill services and service-based manufacturing. According to them, India may achieve more sustainable long-term growth by focusing on sectors such as technology, software, design, and other industries instead of simply relying mainly on traditional or labour-intensive manufacturing.
The overall finding shows that these trade policies has stretched the competitive gap between India and several other Asian economies. According to Prabhakar et al. (2023), India’s share of global merchandise exports increased from 0.8% in 2001 to 2.0% in 2023, but this growth has been relatively slow compared with neighboring countries. Dring the period of 2024-2024, Vietnam increased its share from 0.3% to 1.7%, becoming an important manufacturing and electronics export hub, while China accounted for around 15.5% in global merchandise exports.
Similarly, the IMD World Competitiveness Ranking (2023) shows that India continues to rank below countries such as Malaysia, Thailand, and Vietnam, particularly in areas related to global trade policy and business competitiveness. Although, the objective was to encourage domestic production, imports from China continued to grow, especially for capital machinery, electronic products, and industrial intermediate goods. This indicates that many Indian industries still reply on imported inputs for production. Balaji et al. (2022) also found that import restrictions mainly strengthened a small number of large domestic firms instead of expanding the overall manufacturing base.
The electronics sector provides a clear example of this challenge. While India has recorded an increase in mobile phone exports, the level of Domestic Value Added (DVA) remains relatively low at around 12% to 51%. Most high-value components continue to be imported from countries such as China, Taiwan and South Korea, while production in India is largely limited to assembling and testing the final products. This resulted in the creation of total value where the domestic manufacturing sector captures only a small share of it.
Mishra et al. (20230 describe this is the “performance bonsai trap”, where high compliance costs and policy related barriers which makes it difficult for small firms to expand. Instead of becoming suppliers to large manufacturers, many MSMEs remain small and are unable to integrate into international production networks.
Pathania and Bhattacharjee (2020) argue that reducing tariffs on intermediate goods would lower production costs and improve the competitiveness of domestic manufacturers.
Also, the NITI Aayog Action Plan on Trade Inversions recommends reviewing the existing tariff structure and aligning Quality Control Orders (QCO) with internationally accepted standards. At the same time, entry of schemes such as PLI programme and increasing investment in technology, research and development, infrastructure that could help more MSMEs participate in industrial growth. Such measures would strengthen India’s manufacturing sector while improving its connection with global value chains.
RESEARCH METHODOLOGY
This current research contains an analytical and descriptive study that uses secondary sources to assess the outcome of The Make in India initiative from 2014 to 2024. We believe that an analytical review of policy is appropriate for this research since our goal is not to model economic relationships but to critically examine the design, implementation, and outcome of significant industrial policy. The paper will focus on two aspects: (i) Differential impact of policy interventions on MSMEs and large firms; (ii) The impact of tariff policy on export competitiveness and diversification in manufacturing.
The current research will rely mainly on secondary data sources. Information will be gathered from government reports, policy documents, and statistical data published by the Ministry of Commerce and Industry, Ministry of Micro, Small and Medium Enterprises (MSME), the Press Information Bureau (PIB), Niti Aayog, Reserve Bank of India (RBI), and MAKE IN INIDA website Information is gathered from reports published, as per the international comparative perspective, by the World Bank, UNIDO, Bank for International Settlements (BIS), and such relevant international organizations. Moreover, academic literature, including journal articles and research reports by Nam (2022), Narayan et al. (2020), Mukherjee and Chanda (2020), Anand and Thomas (2026), Som (2018), Prabhakar et al. (2026), has been reviewed to identify and evaluate the impact of industrial policy.
The current research will use these resources since they provide credible, reliable, verifiable, and longitudinal data necessary to analyze the impact of policy on manufacturing over an extended period. In this regard, we believe that reports from government agencies and international organizations enrich the research with high-quality data that enhances the paper’s overall creditability.
The analysis for this research will be carried out using a multi-methodology approach that will include:
- Comparative analysis to understand how Make in India impacted MSMEs and Large Firms from different perspectives, including investment, productivity, profitability, competitiveness, and access to policy benefits. At the same time, the comparison will highlight the differences in policy’s differential impact on firms and identify if some categories gained more advantages than others.
- Assessment of the diversity of manufacturing using indicators that include growth, employment, exports, imports, FDI, and value addition with trends from 2014 to 2024 to demonstrate the objective of Make in India.
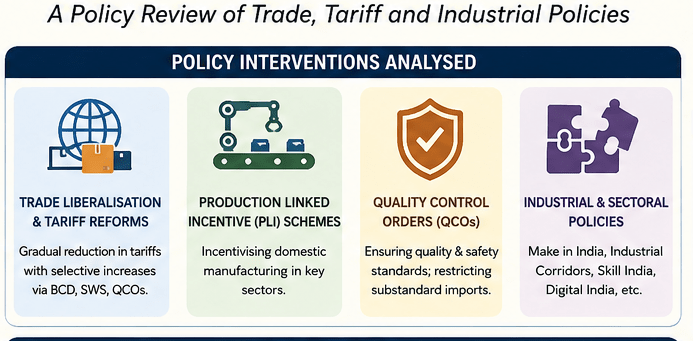
- Review of the impact of tariff and non-tariff policy instruments on trade, with a focus on Quality control order (QCO), Anti-Dumping Duties (ADDs), and Production Linked Incentives (PLI). The impact on various sectors and businesses has been used to review the Policy reports, government documents, and academic literature.
- The diversification in manufacturing and effect on various sectors and businesses which use indicators like import dependency, share of exports in the world, value addition, and participation in global value chains.
The period for this research covers 2014 to 2024, which includes the majority of Make in India policy’s implementation period. This study focuses on manufacturing, which includes trade, investment, employment, and some other factors. We believe that a ten-year timeframe is sufficient to analyze the impact of industrial policy on a country’s economy without overestimating the short-term effects. Also, the COVID-19 pandemic that happened in 2020 has impacted India’s economy the most, and the grounds of this event have been pacify in our analysis.
Limitations:
The current research will be based on data published by other organizations, and different methodological approaches may have been used to gather and present information. Additionally, some of the analyzed initiatives, including the production-linked incentive (PIL) scheme and semiconductor policies, are new, and their long-term impact is difficult to evaluate. Eventually, our analysis maintained a correlation between policy actions and results which does not attempt to establish any causal relationship.
DATA ANALYSIS AND DISCUSSION
Manufacturing Sector Overview
The “Make in India” initiative, launched in September 2014 was based on three quantitative targets.
- Achieving a manufacturing growth of 12% to 14% per year
- Creation of 100 million jobs
- Increasing the manufacturing sector’s share of GDP to 25%.
Even after a decade of its launch, these objectives have only been partially achieved as shown by the available evidence. The manufacturing target, at 25% of GDP, was never reached and has remained the same over the range of 15% to 17%. Even though the target has been pushed back twice, from 2022 to 2025, the trend indicates that the structural transformation envisioned in the Make in India policy has progressed slowly than it was anticipated. It is now effectively folded into the National Manufacturing Mission’s 2035 goal of a 25% GDP share, 143 million jobs, and US $1.2 trillion in merchandise exports by then. The recalculation under the new GDP base year shows the same picture from a different angle- the share of manufacturing’s Gross Value Added (GVA) at constant basic prices has been “rising steadily year-on-year from 14.5% to 16.3%” in the new series for 2022-23 to 2024-25. The World Bank’s comparable figure shows the sector’s contribution to GDP falling to 13% in 2024 from 15% in 2018. Growth has been more volatile than sustainable – the CAGR of the manufacturing sector over 2018-19 to 2024-25 stands at a modest 1.9%, with broad-based stagnation in volumes across most sectors barring a few despite periodic acceleration in Index of Industrial Production (IIP) growth on account of public capex. These trends suggest that growth has been uneven rather than sustained. Policy measures such as promotion of investment, tariff protection and other production incentives have been successful in supporting certain industries but have failed to generate manufacturing expansion across all industries.
This claim can be supported with earlier research. Four years into the programme, Lalita Som’s independent assessment comes to the same conclusion from the investment side: India jumped 30 places in the World Bank ease-of-doing-business rank in 2017 and eased FDI restrictions, but on the investment to GDP and the ratio of value added manufacturing to GDP, the country has been seeing a downward trend, a pattern that she links to the larger literature on premature deindustrialization in developing economies (Som, 2019).
Sources: 2014–2021, Nam (2022), Table 1; 2022–23, Suyash Rai & Anirudh Burman, Carnegie India (2023)
Employment outcomes have also remained far below the policy expectation. The goal was to create 100 million jobs in manufacturing, but the employment impacts were far less than that as indicated by studies. According to Periodic Labour Force Survey (PLFS) 2023-2024, India’s Worker Population Ratio (WPR) increased from 56% in 2022-23 to 58.2% in 2023-24 indicating overall better employment environment rather than job generation specific to manufacturing. Inspite of this, India’s structural transformation remains incomplete, with service sector having 55% of the GVA while employing to 1/3rd of the working population, whereas agriculture continued to employ 42% of the workforce when only contributing about 16-18% of the GVA (ILO, 2024). A CEDA analysis based on CMIE’s Consumer Pyramids Household Survey further estimated that manufacturing employment declined from 51 million workers in 2016–17 to 27.3 million in 2020–21, representing a 46% decline. Although these estimates are from CMIE rather than a government source, they give a perspective on the drawbacks this sector faced. Overall, manufacturing growth remained concentrated in relatively capital-intensive industries, limiting the labour absorption, leading to a ‘jobless growth’.
These findings directly relate to one of the objectives of this study. Although Make in India contributed to improvements in selected industries and attracted investment into sectors such as electronics and automobiles, the overall indicators of manufacturing output, employment, and GDP contribution show only modest structural improvement over the decade. This suggests that favourable conditions for growth in certain sectors were there but Make in India remained less successful in achieving aggregate manufacturing development across the economy.
LARGR FIRMS: BENEFICIARIES OF POLICY CHANGES
Economists have witnessed a new phenomenon where a small number of firms, who are the best in their industry and sector, stand out as benchmark performers and are regarded as “superstar firms”. These firms have differentiated themselves with extremely good performance in the economy as compared to their peer firms. In India, Hindustan Unilever, Tata Steel, and Jindal Steel and Power, among many others are considered as “Star Firms”. This elite group, comprising top 2% to 4% firms, occupy the dominant share of total industrial revenue. This growing disproportionate growth raises an important question regarding the distribution of benefits under Make in India- has the policy benefitted all manufacturing firms or reinforced the position of already established firm?
1. Revenue and Growth analysis
The revenue and growth of the manufacturing sector show a highly skewed distribution. The dominance of establishments in the highest Net Value Added (NVA) class increased considerably. These firms were responsible for 59.9% of the total industrial output by 2023-24, showing a rise from 52.85% in 2017-18.
Large establishments with more than 5000 employees, saw their shares of factories, output, and employment rise. These firms showed an increase in their share of total production from 15.36% to 18.52% during this same window. These trends showed that the growth was concentrated among the large star firms instead of being evenly distributed among all manufacturing firms.
This dominance is driven by a disproportionate investment in intangible assets; star firms capture 27% of total technological expenditure and 20% of advertising expenditure, with lagged R&D spending significantly increasing the probability of attaining star status. While schemes like Policy Linked Incentives (PLI) and tariff protection created opportunities for investment, large firms were, very often, better positioned to meet the eligibility than MSMEs and take scale of investment needed to take advantage of these programs. This suggests that the capability of a firm played an important role in determining outcomes alongside the policy.
The steel sector is the cleanest illustration. Even before the 2025 safeguard duty, India’s largest steelmakers were posting strong margins under existing protection: Tata Steel’s EBITDA margin stood at 21% in India and SAILs at 11.6%, prompting the trade think tank GTRI to argue that Indian producers are “far from distressed”. In the most recent reporting quarter, most listed steel majors like Tata Steel, JSW Steel, SAIL, Jindal Steel, and Jindal Stainless all reported positive YoY revenue growth, with EBITDA per tons improving across the board, supported in part by an anti-dumping duty of up to 12%; Tata Steel and JSW Steel delivered strong double-digit EBITDA margins alongside double-digit volume growth.
The Viscose Staple Fibre (VSF) case is more extreme because it involves a near-monopoly. (Anand and Thomas, 2026) show that the dominant domestic VSF producer’s capacity doubled, domestic sales increased 2.5 times and EBITDA from its VSF division increased four times as much between 2014-15 and 2021-22, which is the exact time in which anti-dumping duties and tariff hikes insulated it from ASEAN competition. They estimate cumulative monopoly rents of US$2.5 – 3.1 billion between 2010 and 2024, equivalent to 14-17% of the firm’s cumulative VSF sales value rents. The authors attribute explicitly to policy, not to efficiency: “these rents were not the by-product of superior technology, higher quality, or scale efficiencies… but the mechanical consequence of a protected domestic market.” Taken together, these findings suggest that while trade protection may have strengthened the competitive position of dominant firms, existing market advantages and investment capacity also played an important role in shaping outcomes.
2. Pricing power in downstream markets
Pricing power in Indian manufacturing is unevenly distributed and seems to be concentrated among the large firms. According to Maji et al., the median price-cost margin across the sector is estimated at 12.45% but firms in tobacco (32.10%), pharmaceuticals (25.37%) and publishing (21.86%) however, report a much higher margin. This is explained by high barriers to entry such as intellectual property protection, strong brand recognition and regulatory requirements, which limit competitive pressures and help to sustain profitability. Large firms are more likely to invest more heavily in intangible assets such as research and development and advertising, making the product differentiation stronger and reinforcing their market position. By contrast, more fragmented and labour-intensive industries such as textiles (9.91%) and food products (6.29%), generally operate with lower margins and face more competition and less pricing power..
Large firms are in a better position to sustain these margins because they invest more in research & development, brand building and technology which leads to greater product differentiation. Their large scale allows them to efficiently source intermediate inputs and distribute their fixed costs over their higher volumes of production. Firms with stronger financials and access to technology were more equipped to take advantage of trade liberalization, Make in India policy and related schemes. This means that policy incentives reinforced existing competitive advantages rather than making an equal playing field for all firms to take advantage.
This concentration of pricing power can be seen through the Viscose Staple Fibre (VSF). According to Anand & Thomas (2026), domestic buyers paid approximately 21-25% more than international benchmark prices for the same fibre between 2010 and 2021. Even after withdrawal of anti-dumping duties in 2021, the price gap remained due to Quality Control Order (QCO), introduced in 2023 which restricted import competition. According to the authors, these measures allowed the dominant domestic producer to maintain substantial pricing power in the domestic market.
Source: Anand & Thomas (2026), based on UN Comtrade and the firm’s annual reports.
Evidence from market regulations further supports this. In 2020 the Competition Commission of India CCI, fined the dominant VSF producer ₹302 crore for abusing its dominant position and engaging in systematic price discrimination between export and domestic buyers (Anand & Thomas, 2026). Similar concerns have been seen in the steel side, with the criticism of safeguard duty on flat steel which leads to increase in input cost for downstream industries such as automobiles, construction, etc. While such measures were taken to protect the domestic producers, they reduce competition and increase cost of production which uses steel as their raw material.
Most evidence suggests that pricing power became concentrated among the established firms during the Make in India Period. Although these policies supported Indian manufacturing, they benefitted more to firms with already substantial market share, better technology and more financial resources.
3. Policy advantages
Product Linked Incentive (PLI) scheme by the Government of India is a type of performance linked incentive given to companies on incremental sales from products manufactured in domestic units. It has played a central role in India’s industrial policy by encouraging investment, expanding domestic manufacturing, and improving global competitiveness. However, the Production Linked Incentive (PLI) scheme by design and nature is structurally tilted towards larger firms. Under the scheme, the minimum incremental-investment threshold is ₹10 crore for MSMEs, ₹100 crore for other firms with a ceiling of ₹1,000 crores. As incentives are paid on incremental sales over a fixed 2019-20 base year, firms with an already established production base meet the eligibility criteria more easily compared to others. The outcome is visible in the distribution of the beneficairies of the scheme. According to Press Information Bureau (PIB) Ministry of Commerce & Industry, out of 764 approved PLI applications across 14 sectors, only 176 are MSMEs – roughly 23%, while other were larger firms. This presents a clear distortion in terms of beneficiaries of scheme.
A Reuters analysis of the PLI scheme (2025) similarly states “large-scale manufacturers dominate the PLI scheme, while small and medium enterprises (SMEs) struggle to compete”. Compliance requirements such as multi-year audited financial statements, GST filings, and performance bank guarantees impost a considerable cost. While these measures are taken to ensure accountability and proper usage of public funds, they hinder the participation of financially contrained firms.
These benefits extend beyond policy. Star firms benefit from economies of scale, larger bargaining power and easier access to cheaper financial resources leading them to invest more in technology and expand production. Given their greater financial and operational scale, large firms perhaps are better positioned than MSMEs to benefit from such incentives. At the same time, it should be recognised that the scheme was primarily designed to create globally competitive manufacturing champions in strategic sectors, rather than to provide broad-based support to all firms. Therefore, the greater participation of large firms reflects both the objectives of the scheme and the structural advantages they already possessed.
Overall, the evidence suggests that PLI schemes had been successful in attracting investment and expanding production but the benefits have been unevenly distributed. Large firms easily met the criteria and the compliances while small firms could not. This supports that the Make in India strengthened the competitiveness of established firms more as compared to the MSMEs.
MSME IMPACT (vis-à-vis Large Firms)
1. Credit constraints
Access to institutional finance remained a major constraint for the MSMEs during much of the Make in India period. The UK Sinha Committee (2019) identified a credit gap of approximately 20-25 lakh crore which was a result of asymmetric information, poor formalization, and lack of collateral among smaller firms. This led to the inability of smaller firms to invest in technology and expand production.
The first meaningful improvement occurred post-cov id, via the Emergency Credit Line Guarantee Scheme (ECGLS), collateral free lending measures and OCEN (Open Credit Enablement Network). According to RBI (2025), the rate of growth of MSME credit (14.1%) exceeded that of retail (11.7%) and services (11.2%). The MSME Non-Performing Assets fell from 4.5% to 3.6%. These trends indicate improvement in the financial health of the sector and greater access to formal credit.
These improvements occurred relatively late in the study period. Between 2014 to 2020, with tariff increases and non-tariff measures, input costs increased and several MSMEs continued to face financing constraints. Although it is difficult to establish a direct relationship, the available evidence suggests that less access to credit reduced the capacity of smaller firms to adjust to increasing production cost and act according to policy made changes. In contrast, larger firms adapted easily to policy changes and input prices, reinforcing uneven benefits of the Make in India policy.
2. Crowding-out effect
The manufacturing industry in India is a relatively concentrated industry, whereby the growth of big companies leaves little room economically for smaller businesses. The advantages of high market power and economies of scale have helped big companies gain an advantage, leaving MSMEs constrained by demand and competition. In addition, policy initiatives such as the Production Linked Incentive (PLI) schemes may disproportionately benefit large firms, potentially reinforcing existing structural disparities within the sector.
The steel-duty episode is the cleanest documented instance of crowding-out by value-chain position rather than simple firm size. The Global Trade Research Initiative (GTRI) has argued that safeguard duties, together with Quality Control Orders (QCOs), may reduce import competition in a way that primarily benefits a small number of large domestic steel producers. At the same time, industry bodies such as the Automotive Component Manufacturers Association (ACMA) have raised concerns that higher steel prices increase production costs for downstream manufacturers, many of which are MSMEs. This indicates that while trade protection may strengthen upstream producers, it can also place additional cost pressures on downstream industries that depend on steel as a key input.
The VSF case shows the mechanism even more starkly because the downstream segment is explicitly MSME-characterized: Anand and Thomas (2026) describe viscose yarn spinning as “labour-intensive and competitive,” with spinners as pure “price takers in both input procurement and output sales” who had “little scope to adjust” when fibre prices rose. India’s share in the global yarn exports fell from 13.2% in 2011 to 8.7% in 2024, a decline that closely tracks the anti-dumping timeline.
Taken together, these examples suggest that the effects of industrial and trade policy have not been uniform across the manufacturing value chain. Upstream producers appear to have benefited more from protection and policy support, whereas downstream industries, many of which are dominated by MSMEs faced rising input costs and grater competitive pressure. This supports the broader argument of the study that, although industrial policies under Make in India stimulated investment and production, their benefits were more pronounced for large firms than for smaller manufacturers.
3. Structural issues
Indian MSMEs are trapped in a low productivity cycle because of substantial technological lag and ongoing dependence on traditional methods of production. These companies don’t have the financial capacity to upgrade to modern digital systems or research and development procedures that are important for survival in an increasingly competitive global market. The “missing middle” phenomenon shows how institutional and financial barriers prevent smaller firms from scaling into better, technologically advanced medium scale producers. The compliance landscape that is characterized by multiple ambiguous labor laws and the technically complex GST system has disproportionately strained the administrative abilities of small firms. These regulatory hurdles together with high transaction costs of formal credit, push many MSMEs into the informal sector, further excluding them from policy benefits and modernizing capital.
EXPORT COMPETITIVENESS AND IMPORT DEPENDENCE
1. Export competitiveness
India’s global merchandise export share has barely moved across the entire Make in India period: 0.8% (2001) → 1.8% (2011) → 2% (2023) (Prabhakar et al., CSEP-JETRO). Whereas Vietnam was smaller, less sheltered, but managed to increase from 0.3% to 1.7%. Total manufactures share of total merchandise export has followed the same trend: The ratio of manufactures export to total merchandise export decreased from 79% in 1999 to 60% in 2013 before recovering to 67% in 2024. In addition, the share of merchandise exports to GDP ratio declined from 14.1% in 2022/23 to 12.1% in 2024/25 under the new GDP series.
The example of VSF industry is another clear-cut evidence of the same pattern in micro-level: The ratio of India’s export of yarns on the basis of VSF has decreased from 13.2% (in 2011) to 8.7% (in 2024), whereas the ratio of India’s export of garments on the basis of VSF has decreased from 5.0% (in 2017) to 3.9% (in 2024), while over this period, Bangladesh’s ratio of garments exports on the basis of VSF increased from 0.1% to 4.8%,. This is essentially a controlled experiment in what tariff-driven input costs due to export competitiveness when a competitor next door does the opposite.
2. Import dependence with OSAT (Outsourced Semiconductor Assembly and Test) model
This is where Make in India’s 2014 policy, “assembly without backward linkage” problem shows up most clearly. India’s chip imports rose 36% in 2024 to nearly $24 billion, and a further 20% year-on-year in 2025, now accounting for about 3% of India’s total import bill, with China supplying 30% of these imports, Hong Kong 19%, South Korea 11%, Taiwan 10%, and Singapore 10%. Carnegie’s analysis of the broader supply chain is more pointed: “imports of semiconductors have surged in India by 92 percent over the last three years,” driven by a growing assortment of contract manufacturers, many of them Chinese, assembling devices in India. On electronic components more broadly, India exported $38.56 billions of electronics in FY24-25 while importing $36.8 billion of electronic components in the same period, with China supplying nearly 40% of those component imports, a dependence the government’s own Electronics Component Manufacturing Scheme was explicitly designed to address. This directly mirrors the CSEP-JETRO finding that India’s heaviest cumulative tariff/QCO/ADD protection sits in the 10–15% bracket on intermediate goods ($122.7 billion of imports), precisely the category that includes the inputs India’s “success story” electronics exporters most need.
3. Mixed outcomes
Positive: Domestic manufacturing of mobile phones increased 28 times from ₹18,000 crore in 2014-15 to ₹5.45 lakh crore in 2024-25, while electronics exports increased eight times to ₹3.27 lakh crore in FY24-25. CSEP-JETRO machines trade matrix shows there is a real “Apple effect”: the ratio of actual versus predicted gap of machinery final goods exports to USA increased from 10% (2017) to 51% (2023).
Negative: The same sources concede; the gains are shallow. “Even in successful sectors like mobile manufacturing, the percentage of local value addition remains in single digits. Critical components such as semiconductor chips and subassemblies are still imported. The CSEP-JETRO data confirm this asymmetry at the aggregate level too: India’s machinery import gap-ratio with the world reached 90% by 2023, while its export gap-ratio lagged well behind, India is integrating into “Factory Asia” predominantly as an importer, not yet as an exporter, of machinery. Production growth without export growth, and assembly growth without component self-sufficiency, is the pattern that recurs across every case examined in this section.
FINANCIAL MARKET IMPACT
1. Profitability
Although the median price-cost margin for the total manufacturing sector is at 12.45%, it has exhibited cyclical volatility, becoming 11.4% in 2023-24. Large “star firms” maintain continuous, super-normal profits by using economies of scale, regulatory insulation, and intensive investment in intangible assets like R&D and branding. Higher margins are likely to be more concentrated in specialized and regulated industries such as Tobacco (32.10%), Pharmaceuticals (25.37%), and Publishing (21.86%). On the other hand, markups are very low for MSMEs operating in smaller and more labor-intensive industries such as Food Products (6.29%) and Leather (9.01%). These firms are slowed down by falling demand, persistent credit exclusion, and inverted duty structures that increase input costs. While economic growth (IIP Index of Industrial Production) generally supports revenue, inflation becomes an impediment in profitability thereby raising factor prices, particularly for MSMEs which lack the pricing power to offset rising costs.
Already established in 4.2: Tata Steel (21% EBITDA margin) and SAIL (11.6%) sustained double-digit margins through the protection cycle; the VSF dominant producer’s EBITDA from its protected division rose fourfold (Anand & Thomas, 2026).
2. Stock market reaction
Two episodes summarise whether investor’s price protection benefits in real time. First, at the macro level: by mid-August 2024 the Sensex and Nifty 50 had surged 21.0% and 24.2% year-on-year respectively, with the rally led by automobiles, oil and gas, insurance, banking, and capital goods which were domestically oriented, often protected sectors, while sectors with deep global ties, including chemicals and IT, grew at a slower pace, reflecting weak global demand. Second, at the announcement level: when the DGTR recommended a three-year steel safeguard duty in August 2025, steel stocks moved immediately, as JSW Steel rose 2.44%, SAIL 1.77%, Jindal Steel 1.4%, and Tata Steel 1.2%, a clean same-day market read that investors expect protection to convert directly into margin.
3. FDI impact
Foreign Direct Investment (FDI) played a critical part in the Make in India era (2014-2024) was quite complex, on one side there was notable growth in capital inflows and increasing integration into the international production network, as well as technology upgrading; while its impact on manufacturing employment and domestic investment performance is quite feeble.
- Magnitude and Economic Growth: FDI inflows have risen over the past decade favoured by liberalized policies and an attempts to create a more favourable investment environment. During the period from April 2014 to March 2022, more than US$ 523 billion worth of FDI has been attracted to India. These investments contributed to capital formation, better productivity, and economic growth with some estimates showing an additional contribution of around 1% to real GDP and investment growth.
- Sectoral Heterogeneity: The distribution of FDI across sectors remains skewed. While manufacturing sectors such as automobiles, electronics, and electrical equipment recorded some inflows, the services sector continued to attract the largest share of foreign investment. In electronics manufacturing, FDI contributed to India’s emergence as a major smartphone assembly hub, although domestic value addition remained comparatively limited during the formative years of expansion.
- Innovation and Labor Substitution: Global manufacturing standards, management knowledge transfer, and technology transfer have all benefited greatly from foreign direct investment. International affiliates are more creative and engage in more intensive research and development. Also, a shift towards capital-intensive production methods has also been prompted by technology-intensive expenditures, which has reduced the need for labour and raised concerns about manufacturing jobs.
- Policy and Structural Constraints: Although reforms such as the expansion of the automatic route increased India’s attractiveness to foreign investors, certain structural concerns are still present. The decline in the investment-to-GDP ratio despite rising inflows indicates that some FDI has been allocated to acquisitions and brownfield investments rather than the development of new productive capacity through greenfield projects, while rising profit repatriation has decreased net FDI income in recent years.
CONCLUSION
Protectionist policies were undertaken as a measure to realign forces in industry to revive the growth and potential of Manufacturing led growth in India. Make in India 2014 tariff measures were framed on similar lines. Tariff measures, PLI scheme, and FDI policies were introduced with the motto of self-reliance under Atmanirbhar Bharat, to incentivize production across sectors. But the problem with the government led manufacturing policies lie in policy inconsistency, poor sectoral targeting that distorts the market in favour of firms that have been at par with structural reforms like in case of Viscose staple fibre, steel industry, automobiles, etc. While on the other side MSMEs and small players struggling with structural issues in their day-to-day business, like credit availability, lack of technological inputs, advanced machinery and know-how; they are unable to implement such policies and fall short, while the dominant players exploit the incentives and policies to increase their output share as well as revenue. The above analysis reports that the policy succeeded in driving in investments in selected sectors via PLI and tariffs measures; the fruits remained largely distributed, with large firms winning over MSMEs structural fallacies.
Even though measures like OCEN (Open credit enablement network), CGMTSE (Credit Guarantee Fund Trust for Micro and Small Enterprises) were introduced, their implementation came way too little and a way too late to make any effective amends in the already distorted manufacturing environments. Also tariff-import correlation from 2014-2023 have been effectively zero, rather no significant aggregate import demand was driven by India’s own tariff schedule (IISPPR data science, Trade and Tariff analysis report) Imports surged because of domestic demand, global commodity prices, pandemic shocks and exchange rates rather than declining.
Along similar directives, while the protectionist policies like tariffs’ measures were formulated in good intentions, it ignored the decades long geographical fragmentation in global value chains, a reality that increases the correlation factor and dependence of exports on imports for example, in case of semiconductor supply chain. India’s industries under semiconductor manufacturing are majorly rerouting imported goods by assembling them under “Make in India” packaging, which increased dependence on China, Taiwan, Vietnam rather than adding any effective value in Global Value Production. Although, it cannot be dismissed that these industries take decades of gestation period to effectively add value, but the branding of Assembly lines manufacturing under Make in India remains inflated. Export led growth needs to build supply chain diversification and resilience, alongside greater integration with Global value chains, to build strategic indispensability in manufacturing and exports in global markets. Such movements take decades of policy intervention and due investments in intangible assets like R&D and innovation, and we must continue to make amends to further translate India’s manufacturing aspiration and ambition into real world gains.
This policy review also understands the dynamic and volatile global environment that also added headwinds in delaying India from achieving objectives under “Make in India, 2014” ambitious plan. The tailwinds created via policy interventions could not soar the manufacturing sector alone; they must be paved by favorable global environments as well. But in the current situation, global volatility and rising protectionism among nations offer little to bargain on that front. Going forward, government must situate policies understanding that these volatilities are here to stay alongside changing nature of industries with AI and automation that is causing structural upheaval. Moving ahead in such times need steadfastness, frequent policy’s revision and interventions, and increasing valued production at home to become not an assembly plant in Global value chain or effectively distribute gains to already established large firms with coming opportunities; but to become a strategic indispensability in global manufacturing chain. Building resilience, self-reliance and value-based domestic production can help in integrating India into global value chain that strengthens India’s ambition into real outcomes.
The research findings are based on secondary data and policy reports, which provide larger macroeconomic pictures and try to capture broad policy trends and associations but refrain from establishing any definitive relationships. Future policy intervention must prioritise capability building, competitiveness, and vertical integration between industries at home before relying on external policy instruments (like tariffs, QCO) to push for large global value chain integration.
RECOMMENDATIONS:
Policy research has also narrowed down some recommendations to align the policy objectives to ground realities of present times, and Fastrack reforms to achieve the set objectives of Make in India policies:
Partnerships and Collaborations of MSMEs, small firms with Large Firms and Industry leaders of their sector for sub-contracting, ancillary manufacturing, technological assistance and employee training. These activities could be promoted by Apex chambers like FICCI, ASSOCHAM, MSME associations to promote coincidental growth rather than distortion and making the larger manufacturing capacities in India aligned to Industry 4.0 standards. Their linkages could also internationalize the MSMEs’ participation in Global value chains. (Bala Subrahmanya, 2017).
Policy measures like correcting the Inverted Duty structure and rolling back Quality control orders on intermediate goods except safety measures or critical goods, could improve the manufacturing activity at home. Also, policy measures that focus on increasing productivity and value addition increase global competitiveness, thereby improving exports and trade and integration with global value chains. These measures are long term, but more focused on sustained growth momentum rather than growth spikes for a short period built on fortification of Industry at home.
Rajan (2015) suggests the introduction of a kind of “Make for India” program aimed at further promoting “import substitution,” especially at present where India harbors 17% of global population, nearly 60 percent of India’s GDP has been driven by domestic private consumption. The country’s consumer market is currently the sixth largest in the world and is expected to rise to third place by 2030 (World Economic Forum 2019). However, with global aspirations of Indian consumers, the local products manufacturers have to match global standards, not to achieve export competitiveness, but to successfully achieve Import substitution, otherwise it would not be sustainable and would fail to survive the frugal perception and critical judgement of Indian consumers.
Also, a policy review both periodic and long term to evaluate trajectory and redirect the path to its goal is an effective tool in heterogenous and umbrella initiatives like Make in India. With multiple players with differential settings, a broad policy falls short to reconcile those differences, thereby creating a differential impact in the long term. To overcome it, targeted segmentation for achieving policy objectives could be more efficient to maximize manufacturing output.
REFERENCES
- https://www.drishtiias.com/daily-updates/daily-news-editorials/revamping-indias-manufacturing-sector
- https://www.imd.org/centers/wcc/world-competitiveness-center/rankings/world-competitiveness-ranking/