Aditya Shafy Chandra1*, Sadiya Altaf Janwari2
1Faculty of Agricultural Economics and Agribusiness Studies, Khulna Agricultural University, Khulna-9100, Bangladesh.
2Islamic University of Science and Technology, Awantipora, Pulwama, India
Corresponding Author: adityashafy.chandra@gmail.com
E-mail address: sadiajanwari20@gmail.com
Abstract
This study analytically investigates women’s financial inclusion across seven south Asian countries and has used World Development Indicators from 2011 to 2021. Financial inclusion can be defined as the availability and equality of opportunities to access and use financial services. It has emerged as an urgent priority of development linked to gender equality, reducing poverty and economic growth (Sarma & Pais ,2011; World Bank, 2014). This examination reveals significantly large cross-country variation with women owning an account, range from 2.95% in Pakistan to 89.28% in Sri Lanka by 2021. Panel regression analysis shows that GDP per capita impacts financial inclusion (p < 0.01) while female labor force shows a positive yet statistically insignificant relationship. India has witnessed a noticeable improvement with 192.76% growth over the decade, which resulted due to targeted policy interventions which includes Pradhan Mantri Jan Dhan Yojana (Kapoor,2014). Pakistan, on the other hand, despite witnessing significant percentage gains, it still maintained to have the lowest total inclusion levels, which reflects socio cultural and institutional barriers (Rahman, Rana & Barua, 2019). The findings mentioned in this paper highlight the vitality of integrated policy approaches that merge economic development, digital infrastructure expansion and initiatives to challenge the gender norms which are restrictive coercing women’s financial participation.
Keywords: Financial Inclusion, Gender Gap, South Asia, Economic Development, Women Empowerment, Digital Finance
1. Introduction
Financial inclusion has been identified as an important aspect of inclusive economic development and poverty reduction strategies across the world (Sarma & Pais, 2011; World Bank, 2014). Financial inclusion is described as the “process of ensuring access to suitable financial products and services at reasonable costs in a fair and transparent manner” (Hannig & Jansen, 2010). Financial inclusion helps people save money in a safe manner, invest in productive sectors, cope with economic risks, and become resilient to financial shocks. Financial inclusion has been recognized as a facilitator for achieving seven out of the seventeen Sustainable Development Goals (United Nations, 2015).
For women in particular, financial inclusion is more than just an economic empowerment tool; it is also a means of achieving greater autonomy, decision-making capacity, and social mobility (Kabeer, 2005; Swamy, 2014). Financial inclusion can allow women to build assets on their own, invest in education and health, establish and grow businesses, and make their own decisions about household resources. Studies have shown that financial inclusion of women has positive spillover effects on child nutrition, education, and overall household well-being (Dupas & Robinson, 2013).
Despite the rapid economic growth and development of financial systems in South Asia over the past two decades, the region still has some of the most visible gender gaps in financial inclusion in the world (International Monetary Fund, 2018). Women in South Asia are confronted with multiple barriers such as lower levels of education, limited participation in the labor market, digital divides, and deeply rooted socio-cultural factors that impede their economic empowerment (Ghosh & Vinod, 2017; Rahman, Rana, & Barua, 2019). Although some studies have been conducted on financial inclusion in South Asia, and some cross-country studies have been conducted, empirical evidence specific to South Asia, using standardized and comparable data sets for all major economies.
In this context, the present study undertakes a comprehensive empirical analysis of women’s financial inclusion in seven South Asian nations, namely Bangladesh, Bhutan, India, Maldives, Nepal, Pakistan, and Sri Lanka, using World Development Indicators data from 2011 to 2021. Specifically, the study aims to:
- examine the level and trend of women’s financial inclusion across South Asian countries from 2011 to 2021.
- identify key socio-economic determinants influencing women’s financial inclusion in the region.
- compare cross-country variations in women’s financial inclusion and analyze contributing factors.
By addressing these objectives, the study contributes to the growing literature through a standardized, region-wide comparative framework.
2. Literature Review
2.1 Conceptual Framework of Financial Inclusion
The literature on financial inclusion has progressed from the conventional focus on access to banking services to a broader focus that includes access, usage, and quality aspects of financial inclusion (Demirgüç-Kunt & Klapper, 2013). Sarma and Pais (2011) constructed a multi-dimensional index of financial inclusion that covered banking penetration, the degree of banking services, and the use of the banking system. Chakravarty and Pal (2013) further extended this line of thinking by incorporating an axiomatic structure that covered the distributional elements of financial inclusion.
More recent literature suggests that financial inclusion must be considered not only as a function of account ownership but as engagement with formal financial services (Allen et al., 2016). This difference between access and usage becomes even more important in the context of women’s financial inclusion, where gender-specific barriers could result in a higher level of account dormancy among women (Demirgüç-Kunt et al., 2018).
2.2 Determinants of Financial Inclusion
The existing literature has been able to identify some of the important determinants that affect the availability of formal financial services. At the macroeconomic level, economic development has been identified as an important determinant of financial inclusion. Economies with higher GDP per capita have better financial systems, more developed regulatory systems, and greater household capacity to access formal financial services (Sethi & Acharya, 2018). Sharma (2016) has also been able to identify important empirical relationships between economic development and financial inclusion in the Indian context.
Education has been identified as an important determinant of financial inclusion. Education and literacy abilities enable people to understand financial systems and make important decisions (Mehrotra et al., 2009). For women, education has been identified as an important determinant of financial inclusion. Education not only increases financial abilities but also increases bargaining power in the household (Ghosh & Vinod, 2017).
Labor force participation is another important determinant, although the correlation is complex. The formal sector job generates demand for banking services through salaries, as well as familiarity with financial institutions (Aterido, Beck, & Iacovone, 2013). However, in environments where the informal sector is the norm, the correlation between labor force participation and financial inclusion could be weakened.
2.3 Digital Technology and Financial Inclusion
Recent studies have also emphasized the revolutionary potential of digital technology in improving financial inclusion. Mobile banking and digital payment services have proven to be effective solutions for reaching rural areas where banking infrastructure is still underdeveloped (Jack & Suri, 2014). The success of Kenya’s M-Pesa mobile money service has also shown that digital financial services can significantly improve access and lower transaction costs (Jack & Suri, 2014).
Digital financial services have provided women with limited mobility with unprecedented opportunities for financial inclusion (Klapper & Singer, 2017). Nevertheless, the digital divide may cause financial exclusion to continue or even worsen if not addressed in policy (World Bank, 2018).
2.4 Gender Dimensions of Financial Inclusion
However, an increasing number of studies focus on the challenges that women face in accessing formal financial services. Swamy (2014) lists several constraints such as legal impediments to women’s property rights, social norms that consider men as the dominant financial decision-makers, and the design of financial products that do not take into account women’s requirements. Aterido et al. (2013) discovered large gender gaps in accessing finance in Sub-Saharan Africa.
Studies on South Asia in particular show the particular importance of socio-cultural considerations in improving women’s financial inclusion. Ghosh and Vinod (2017) show that in the Indian context, household characteristics, women’s autonomy in decision-making, and mass media access are important determinants of women’s financial inclusion. Rahman et al. (2019) discovered that in the South Asian countries, the legal environment that defines women’s economic empowerment has a large effect on financial inclusion outcomes.
2.5 Financial Inclusion and Development Outcomes
Empirical studies have shown that financial inclusion has positive developmental outcomes. Prina (2015) carried out a field experiment in Nepal and found that the provision of savings accounts improved women’s savings, productive investments, and household bargaining power. Dupas and Robinson (2013) found that the provision of savings accounts to market vendors in Kenya improved their savings and productive investments, especially for women.
At the macroeconomic level, studies have found a positive relationship between financial inclusion and economic growth, poverty reduction, and reduction of income inequality (Kling et al., 2022; Sethi & Acharya, 2018). However, the relationship is found to be contingent on other factors such as the quality of regulation and institutional framework (Hannig & Jansen, 2010).
3. Methodology
3.1 Research Design
The design of this research is quantitative, using secondary data analysis through panel data techniques. The use of panel data has several advantages over other techniques, such as cross-sectional analysis or time series, including the capacity to control for country-specific unobserved heterogeneity (Demirgüç-Kunt & Klapper, 2013).
3.2 Data Source and Coverage
The data used for this analysis was sourced from the World Development Indicators database, which is maintained by the World Bank and provides globally comparable data on development (World Bank, 2023). The World Development Indicators database provides common definitions, high standards for data quality, and widespread use in research.
The countries included in the dataset are seven South Asian nations: Bangladesh, Bhutan, India, Maldives, Nepal, Pakistan, and Sri Lanka. The period included in the dataset is from 2010 to 2022, although the availability of data for the main dependent variable is restricted to the years when the Global Findex survey was conducted: 2011, 2014, 2017, and 2021 (Demirgüç-Kunt et al., 2022).
3.3 Variables and Measurement
3.3.1 Dependent Variable
The financial inclusion of women is measured by the percentage of females aged 15 years and above who report having an account with a financial institution or mobile money service provider. This indicator is based on the Global Findex data collected through nationally representative surveys (Demirgüç-Kunt et al., 2022).
3.3.2 Independent Variables
GDP per capita (constant US$): This variable captures the overall level of economic development and average income in each country. The existing literature has found economic development to be a basic underlying driver of financial inclusion (Sethi & Acharya, 2018; Sharma, 2016).
Female labor force participation rate (% of female population ages 15+): These variable captures women’s participation in economic activities. Labor force participation generates potential demand for financial services, although the relationship may be complex in settings where informal employment is prevalent (Aterido et al., 2013).
3.4 Model Specification
The empirical relationship is estimated using the following regression model:

Where:
FI_it = women’s financial inclusion in country i at time t
GDPpc_it = GDP per capita in country i at time t
LFPR_it = female labor force participation rate in country i at time t
ε_it = error term
β₀ = intercept
β₁, β₂ = coefficients to be estimated
3.5 Limitations
There are a few methodological issues that need to be pointed out. The fact that the data on financial inclusion is not temporally extensive limits the power of the data and makes it impossible to use panel data analysis. The issue of endogeneity, especially reverse causality between financial inclusion and economic development, cannot be resolved without using instrumental variables.
4. Results and Analysis
4.1 Descriptive Statistics
The summary statistics of women’s financial inclusion and important socio-economic variables for the seven South Asian nations are provided in Table 1. The results show a large variation in the level of financial inclusion, which is consistent with the results of global financial inclusion research (Demirgüç-Kunt et al., 2022). The mean value is 42.85%, but it varies from 2.95% to 89.28%, which shows large differences in women’s access to formal financial services.
| Country | FI Mean (%) | GDP per capita ($) | LFPR (%) | Observations |
| Bangladesh | 32.94 | 1,329.83 | 36.89 | 4 |
| India | 55.95 | 1,653.09 | 27.07 | 4 |
| Nepal | 36.00 | 915.11 | 26.70 | 4 |
| Pakistan | 7.08 | 1,436.44 | 22.97 | 4 |
| Sri Lanka | 78.27 | 3,972.67 | 33.54 | 4 |
Note: FI = Financial Inclusion; GDP = Gross Domestic Product; LFPR = Labor Force Participation Rate. Mean values calculated across available observations.
Sri Lanka shows the highest degree of women’s financial inclusion with an average account ownership of 78.27%, followed by India with 55.95%. These results are consistent with the overall trends that have been identified in global financial inclusion statistics (World Bank, 2014). Pakistan has a critically low level of financial inclusion with a level of 7.08%, which indicates that there are severe structural and socio-cultural impediments in the country (Rahman et al., 2019).
The correlation between economic development and financial inclusion is clear, as Sri Lanka’s higher GDP per capita is reflected in better financial inclusion outcomes. However, the Pakistan example shows that economic development by itself is not a sufficient factor when socio-cultural impediments hinder women’s economic engagement (Ghosh & Vinod, 2017).
4.2 Trend Analysis
Figure 1 depicts the trend of women’s financial inclusion in South Asia from 2011 to 2021. All the nations demonstrate growth in women’s financial inclusion over the years, aligning with the global trend (Demirgüç-Kunt et al., 2018, 2022).
The country that has experienced the most radical change is India, where women’s account ownership increased from 26.49% in 2011 to 77.55% in 2021, a staggering growth of 192.76%. This is because India introduced its Pradhan Mantri Jan Dhan Yojana (PMJDY) in 2014, which utilized the Aadhaar biometric identification system (Kapoor, 2014).
Nepal also shows a considerable growth rate of 135.18%, whereas Pakistan, although showing a growth of 356.34%, could only manage 13.48% in 2021 from a remarkably low base of 2.95%. Sri Lanka has the highest absolute level of inclusion at 89.28% in 2021, which is close to achieving universal financial inclusion (World Bank, 2018).
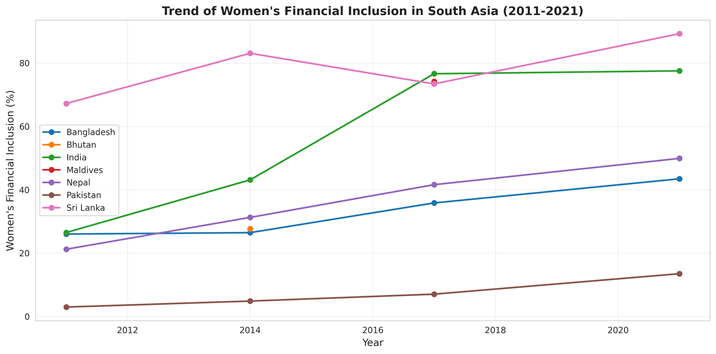
Figure 1: Trend of Women’s Financial Inclusion in South Asia (2011-2021)
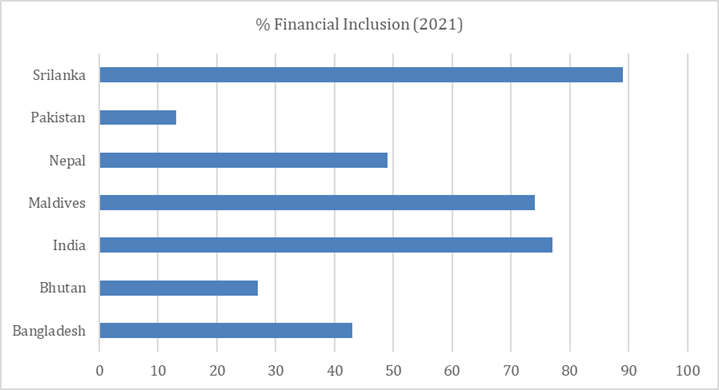
Figure 2: Women’s Financial Inclusion Comparison Across South Asia (2021)
4.3 Correlation Analysis
The correlation matrix, which tests bivariate correlations, is shown in Table 2. GDP per capita shows a moderate positive correlation with financial inclusion (r = 0.578, p < 0.01), suggesting that economic development is significantly related to women’s financial inclusion, as supported by the literature that highlights the significance of economic development (Sethi & Acharya, 2018; Sharma, 2016).
| Variable | FI_female | GDP per capita |
| GDP per capita | 0.578*** | 1.000 |
| LFPR_female | 0.280 | 0.423*** |
Note: *** p < 0.01. N = 22 observations.
The female labor force participation rate has a weaker positive relationship with financial inclusion (r = 0.280, p = 0.207), which is not statistically significant. This result indicates that in the South Asian scenario, participation in the labor force may not necessarily guarantee financial inclusion, perhaps due to the prevalence of informal employment (Aterido et al., 2013).
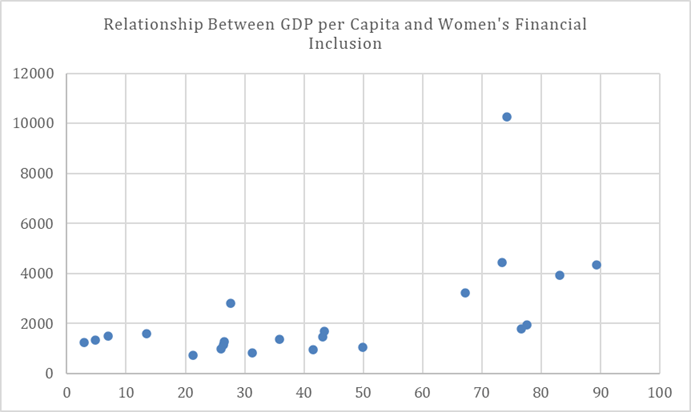
Figure 3: Relationship Between GDPs per Capita and Women’s Financial Inclusion
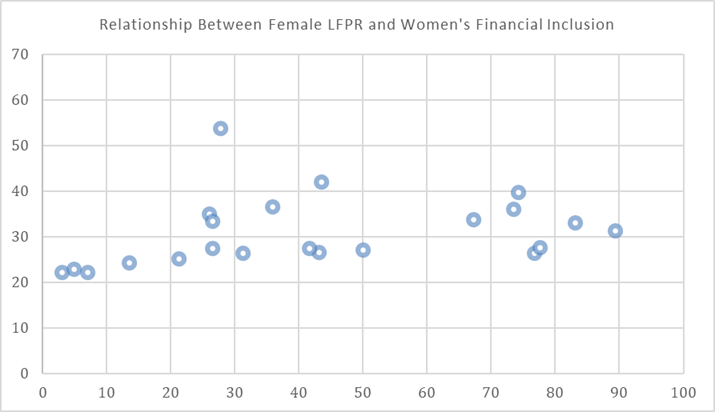
Figure 4: Relationship Between Female LFPR and Women’s Financial Inclusion
4.4 Regression Analysis
The result of the OLS regression analysis is shown in Table 3. The result shows that the model can explain about 33.54% of the variation in financial inclusion (R² = 0.3354). This is a moderate explanatory power, because there are only a few independent variables, and the complexity of the variables of interest, which are the determinants of financial inclusion.
| Variable | Coefficient |
| Constant | 21.590 |
| GDP per capita | 0.007227*** |
| Female LFPR | 0.155 |
| R-squared | 0.3354 |
Note: *** indicates significance at p < 0.01.
The regression analysis shows that the GDP per capita has a statistically significant positive impact on women’s financial inclusion. The coefficient of 0.007227 shows that for every $1,000 increase in GDP per capita, there is a 7.23 percentage point increase in women’s account ownership. This result highlights the core role of economic development in improving financial inclusion (Hannig & Jansen, 2010; Sethi & Acharya, 2018).
The female labor force participation rate has a positive coefficient of 0.155 but is not statistically significant. This result may be because in South Asian labor markets, where the informal sector is predominant, labor force participation may not generate enough demand for banking services (Aterido et al., 2013).
5. Discussion
The results of this study indicate that there is a large cross-country variation in the financial inclusion of women in South Asia, along with a considerable overall progress achieved during the 2011-2021 decade. The massive growth in the account ownership of women in India is one of the most remarkable financial inclusion achievements in South Asia. The close to tripling of the account ownership of women indicates the massive success of the Pradhan Mantri Jan Dhan Yojana scheme and the inclusion of biometric identification facilities, which made it easier to open accounts and increased rural outreach (Kapoor, 2014). The high level of financial inclusion of women in Sri Lanka, which is close to universal coverage in 2021, indicates relatively stronger economic development, education, and banking infrastructure (World Bank, 2018). The low financial inclusion in Pakistan indicates the combined effect of weak economic development, socio-cultural factors, and limited women’s mobility, along with a weak financial infrastructure (Rahman et al., 2019).
The regression analysis supports the role of economic development as a core determinant of women’s financial inclusion. The statistically significant positive correlation between GDPs per capita and women’s account ownership indicates that greater levels of economic development are conducive to supply-side driven development of financial infrastructure and demand-side capacity to access formal financial services (Hannig & Jansen, 2010; Sethi & Acharya, 2018). Economic development could also have indirect effects through education, technology, and institutional development. The insignificant correlation between female labor force participation and financial inclusion indicates that employment does not necessarily contribute to formal financial inclusion in countries where informal employment is prevalent. This result implies that the quality, quality of employment, and nature of employment could be more important than mere participation rates (Aterido et al., 2013).
The growing use of digital financial services in South Asia has also increasingly contributed to improving access, especially among women with mobility restrictions. Mobile banking and digital payment services can minimize the need for branch visits and lower transaction costs, thus potentially reducing gender gaps in access (Jack and Suri, 2014; Klapper and Singer, 2017). The growth of digital financial services must be complemented by efforts to address the gender digital divide, as imbalances in the use of mobile phones and internet access could otherwise perpetuate gender gaps.
Some limitations of this research should be pointed out. Firstly, the analysis is based on aggregate indicators at the macro level, which could hide significant differences in each country depending on rural or urban areas, education, or income quintiles. Secondly, the data on financial inclusion is limited in terms of time, as it only spans four waves of the survey, which reduces the power of the panel data analysis and does not allow for more complex panel estimations. Thirdly, the endogeneity between financial inclusion and economic development cannot be completely controlled in the current model, so the findings should be interpreted in terms of correlation and not causation. Lastly, the analysis is based only on account ownership and does not account for the intensity of use or the quality of financial services provided. Future research should use micro-data, investigate the intensity of use of financial services, and explore causal links using quasi-experimental or instrumental variables methods.
6. Policy Implications
The empirical results highlight that to enhance women’s financial inclusion in South Asia; a comprehensive policy approach is needed to link economic development with gender-responsive financial sector policies. Although increased GDP per capita is a crucial factor in enhancing financial inclusion outcomes, economic growth by itself is not sufficient unless it leads to equal access to financial infrastructure and services for women (Kelkar, 2010). To address this issue, policymakers need to integrate gender-responsive financial inclusion policies into overall development planning to ensure that women share equal benefits of economic growth.
The development of digital financial services is a promising approach to address the gender gap in financial inclusion (Klapper & Singer, 2017). Mobile money and digital payment systems can help address mobility limitations and lower transaction costs, but this can only be achieved by closing the gender gap in digital access. Digital literacy, affordable internet, and women’s mobile phone access are thus essential to financial sector digitalization. Furthermore, policies should focus not only on account opening numbers but also on continued usage. This can be achieved by developing gender-sensitive financial products, simplifying procedures, and removing hidden costs that limit continued use (Allen et al., 2016).
Where socio-cultural factors limit women’s engagement in economic activities, financial inclusion strategies need to be integrated with gender empowerment efforts (Kabeer, 2005). Changes in legislation to enhance women’s economic rights, awareness campaigns at the grassroots level, and upgrading the quality and formal nature of women’s employment can help strengthen the correlation between employment and access to financial services (Swamy, 2014). The regional disparity evident in this study indicates that significant progress can be made when the expansion of digital infrastructure, institutional efforts, and political will are synchronized in a unified policy framework.
7. Conclusion
This paper has analyzed the financial inclusion of women in South Asia using World Development Indicators from 2011 to 2021, and the findings show that there has been considerable progress, as well as challenges. Although all nations have shown improvement, there are still considerable gaps in the region, as well as compared to the universal standards of financial inclusion.
The findings have also confirmed that economic development, as measured by GDP per capita, is a major factor that drives the financial inclusion of women in the region. Every $1,000 increase in GDP per capita is associated with a 7-percentage point increase in women’s account ownership. The dramatic change in India, from 26.49% to 77.55%, shows how policy initiatives can speed up the process of financial inclusion (Kapoor, 2014; Sharma, 2016).
However, economic development by itself is shown to be insufficient. The experience of Pakistan illustrates that even with an increase in GDP, deeply ingrained socio-cultural factors can pose a significant challenge to women’s financial inclusion (Rahman et al., 2019). The non-significant correlation between female participation in the workforce and financial inclusion indicates that the quality and nature of employment are more important than simple participation in the workforce (Aterido et al., 2013).
Going forward, achieving universal financial inclusion for women in South Asia will require a multifaceted approach that tackles economic as well as non-economic barriers. Digital financial services have tremendous potential in reaching excluded groups in a cost-effective manner (Jack & Suri, 2014; Klapper & Singer, 2017). However, technology adoption needs to be accompanied by financial literacy programs, an enabling regulatory environment, and attempts to overcome restrictive gender norms (Kabeer, 2005).
The challenge is great. Financial inclusion is more than a development metric; it is a set of fundamental questions of economic justice, gender equality, and human ability. Women who have access to formal financial services can save for emergencies, invest in education and health, accumulate assets, and engage more fully in the economy. As South Asia presses forward in its development journey, it is imperative that women be given equal access to formal financial systems (United Nations, 2015; Global Partnership for Financial Inclusion, 2020).
References
Allen, F., Demirgüç-Kunt, A., Klapper, L., & Martinez Peria, M. S. (2016). The foundations of financial inclusion: Understanding ownership and use of formal accounts. Journal of Financial Intermediation, 27, 1-30.
Aterido, R., Beck, T., & Iacovone, L. (2013). Access to finance in Sub-Saharan Africa: Is there a gender gap? World Development, 47, 102-120.
Chakravarty, S. R., & Pal, R. (2013). Financial inclusion in India: An axiomatic approach. Journal of Policy Modeling, 35(5), 813-837.
Demirgüç-Kunt, A., & Klapper, L. (2013). Measuring financial inclusion: Explaining variation in use of financial services across and within countries. Brookings Papers on Economic Activity, 2013(1), 279-340.
Demirgüç-Kunt, A., Klapper, L., Singer, D., & Ansar, S. (2022). The Global Findex Database 2021: Financial inclusion, digital payments, and resilience in the age of COVID-19. World Bank Publications.
Demirgüç-Kunt, A., Klapper, L., Singer, D., Ansar, S., & Hess, J. (2018). The Global Findex Database 2017: Measuring financial inclusion and the fintech revolution. World Bank Publications.
Dupas, P., & Robinson, J. (2013). Savings constraints and microenterprise development: Evidence from a field experiment in Kenya. American Economic Journal: Applied Economics, 5(1), 163-192.
Ghosh, S., & Vinod, D. (2017). What constrains financial inclusion for women? Evidence from Indian micro data. World Development, 92, 60-81.
Global Partnership for Financial Inclusion. (2020). G20 2020 Financial Inclusion Action Plan. GPFI.
Hannig, A., & Jansen, S. (2010). Financial inclusion and financial stability: Current policy issues. ADBI Working Paper Series, No. 259.
International Monetary Fund. (2018). Financial inclusion in Asia-Pacific. IMF Departmental Papers/Policy Papers.
Jack, W., & Suri, T. (2014). Risk sharing and transactions costs: Evidence from Kenya’s mobile money revolution. American Economic Review, 104(1), 183-223.
Kabeer, N. (2005). Gender equality and women’s empowerment: A critical analysis of the third millennium development goal. Gender & Development, 13(1), 13-24.
Kapoor, A. (2014). Financial inclusion and the future of the Indian economy. Futures, 56, 35-42.
Kelkar, V. (2010). Financial inclusion for inclusive growth. ASCI Journal of Management, 39(1), 55-68.
Khan, H. R. (2011). Financial inclusion and financial stability: Are they two sides of the same coin? Address at BANCON, Chennai.
Klapper, L., & Singer, D. (2017). The opportunities and challenges of digitizing government-to-person payments. World Bank Research Observer, 32(2), 211-226.
Kling, G., Pesque-Cela, V., Tian, L., & Luo, D. (2022). A theory of financial inclusion and income inequality. The European Journal of Finance, 28(1), 137-157.
Mehrotra, N., Puhazhendhi, V., Nair, G., & Sahoo, B. B. (2009). Financial inclusion: An overview. Department of Economic Analysis and Research, National Bank for Agriculture and Rural Development, Mumbai.
Ozili, P. K. (2021). Financial inclusion research around the world: A review. Forum for Social Economics, 50(4), 457-479.
Prina, S. (2015). Banking the poor via savings accounts: Evidence from a field experiment. Journal of Development Economics, 115, 16-31.
Rahman, M. M., Rana, M. S., & Barua, S. (2019). The determinants of financial inclusion in South Asian countries. International Journal of Social Economics, 46(10), 1164-1185.
Sarma, M., & Pais, J. (2011). Financial inclusion and development. Journal of International Development, 23(5), 613-628.
Sethi, D., & Acharya, D. (2018). Financial inclusion and economic growth linkage: Some cross country evidence. Journal of Financial Economic Policy, 10(3), 369-385.
Sharma, D. (2016). Nexus between financial inclusion and economic growth: Evidence from the emerging Indian economy. Journal of Financial Economic Policy, 8(1), 13-36.
Swamy, V. (2014). Financial inclusion, gender dimension, and economic impact on poor households. World Development, 56, 1-15.
United Nations. (2015). Transforming our world: The 2030 agenda for sustainable development. United Nations General Assembly.
World Bank. (2014). Global financial development report 2014: Financial inclusion. World Bank Publications.
World Bank. (2018). Women, business and the law 2018. World Bank Publications.
World Bank. (2023). World Development Indicators. Retrieved from https://databank.worldbank.org/