
Pandilatha S,Vinita Pathak,Naman Bishambhu,Parvathy M A
Introduction
Environmental regulations have been increasingly implemented worldwide to mitigate environmental degradation and promote sustainable development. However, concerns have been raised about the potential negative impacts of these regulations on economic growth and competitiveness.to our realisation it is just a short term set back due to increased stringency being felt among the industries which are hugely dependent on exhaustible natural resources for their energy needs but it helps in long-term sustainable development of those industries and economy as well ensuring any country which adopts to it, can grab the highest position among the global competitors.
Recent studies have found that environmental regulations can have positive impacts on economic performance. For example, a study by Aghion et al. (2016) found that environmental regulations increased innovation and productivity in the European Union. Another study by Dechezleprêtre and Sato (2017) found that environmental regulations increased the adoption of clean technologies in the United States.a policy maker summary of (2024)Environmental Performance index shows evidence that Countries’ wealth is a strong predictor of their overall environmental performance, but some countries vastly outperform their economic peers, while others lag due to their differential responsibilities and needs.Global Innovation Index 2023 and 2024 shows the changing trend of innovations from conventional high energy intensive technologies to eco-friendly green technologies which are the outcomes of Strict environmental regulations being implemented and Relatively the Increase in Global Competitiveness of the Nation’s adopting to it are clearly visible in the data of Global Competitiveness Index (2024).which confirms the positive impact of Environmental Regulations on Competitiveness as well.
Methodology
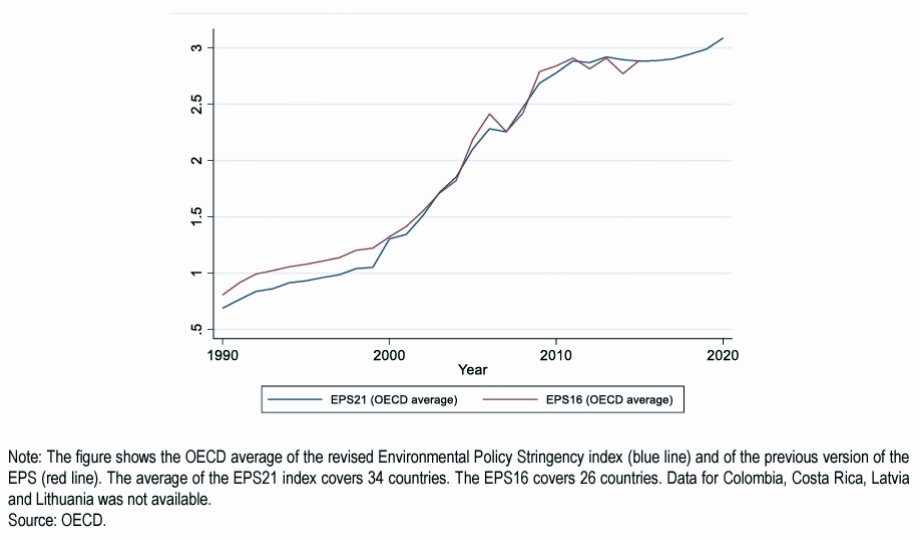 Fig.1
Fig.1
This study uses a panel dataset of 40 OECD countries over the period of 1990-2020 Examining the positive correlation between Environmental regulation Stringency and Economic Growth in terms of GDP and uses data on performance of those countries listed in Global Innovation Tracker 2023 for the competitiveness driven by the innovations emerging out of Environmental Stringency. Stringency is defined as the degree to which environmental policies put an explicit or implicit price on polluting or environmentally harmful behaviour.
The index is based on the degree of stringency of 13 environmental policy instruments, primarily related to climate and air pollution.
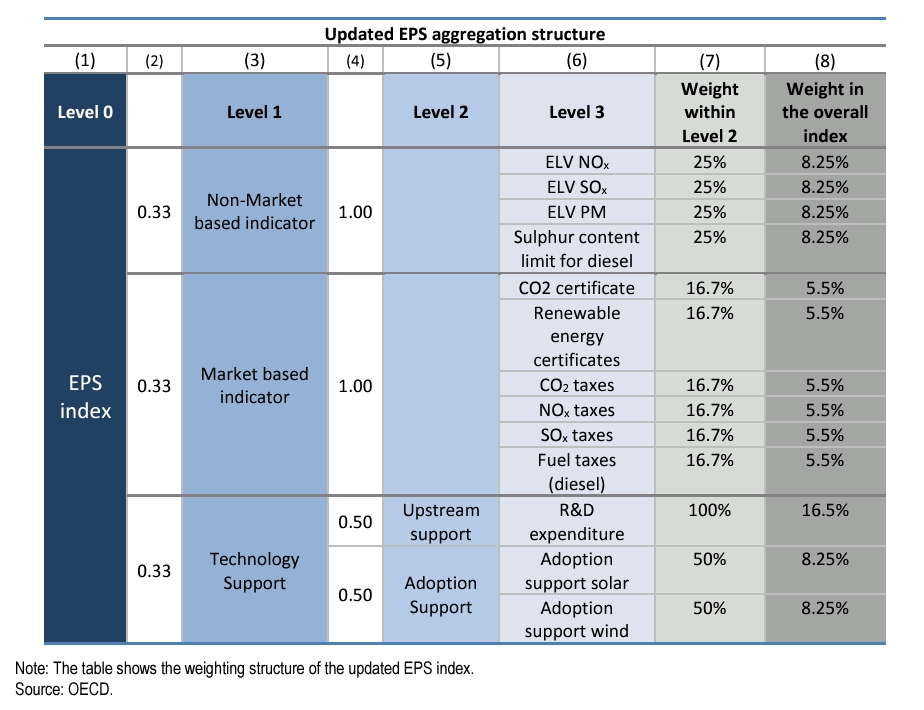 Fig.2
Fig.2
The index ranges from 0 (not stringent) to 6 (highest degree of stringency) and covers 40 countries for the period 1990-2020.
Our dependent variable is GDP growth rate, and our independent variables include environmental regulation stringency, trade openness, and innovation capacity. We control for other factors that may affect economic performance, such as human capital and institutional quality.
Data Analysis
Our data analysis is based on the following datasets:
1. Environmental Regulation Stringency Index : This dataset is developed by the World Bank and provides a comprehensive measure of environmental regulation stringency across countries.
2. World Development Indicators (WDI): This dataset is developed by the World Bank and provides a comprehensive set of development data, including GDP growth rate, trade openness, and innovation capacity.
3. Global Innovation Index (GII): This dataset is developed by Cornell University, INSEAD, and the World Intellectual Property Organization (WIPO) and provides a comprehensive measure of innovation capacity across countries.
According to data from the OECD and World Bank, the combined nominal GDP of OECD countries significantly increased from approximately $12 trillion in 1990 to roughly $50 trillion in 2022.On average, Environmental Policy Stringency significantly increased since 1990 across OECD countries. Over the past two decades since 2000 it more than doubled (+138%) from 1.3 to 3.1.The average annual growth rate of the EPS between 1990 and 2000 is 6.8%, and 8% between 2000 and 2010. While the increase in policy stringency has been substantial over the past decades, the trend has flattened in the most recent decade with an average annual growth rate of 1.1% between 2010 and 2020. The EPS levelled-off between 2010 and 2015. It increased since 2015 to reach a score of 3.1 in 2020.Over the entire series between 1990 and 2020 environmental policy stringency increased on average by 348% (from 0.69 to 3.09) in OECD countries.
The substantial increase in the Environmental Policy Stringency on average across the OECD over the past decades masks wide heterogeneity across countries.
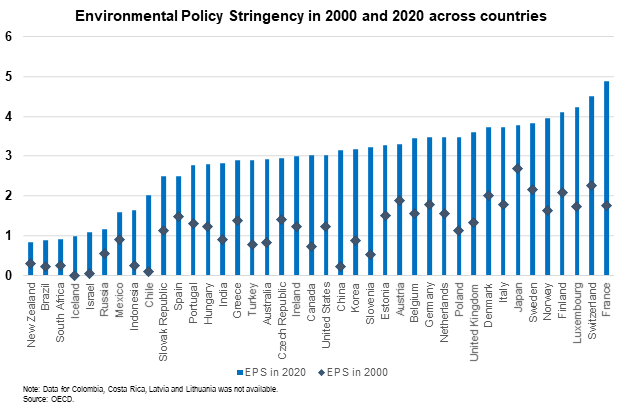 Fig.3
Fig.3
All countries increased their environmental policy stringency between 2000 and 2020. In 2020, the countries with the most stringent environmental policies are France, Switzerland, Luxembourg and Finland.
Carbon dioxide emissions rose strongly in 2021, but less so in 2022. Although the first four months of 2023 point to only a modest rise, CO2 emissions continue to increase. If this trend persists, there is no global reduction in CO2 emissions on the horizon,thus there is a need for increased environmental policy stringency,pushing countries towards adopting renewable and green energy technologies which are known for low or No Carbon emissions involving creation of innovative products running on high speed on less energy expense.Thus the innovations driven by this are obviously greener.The Global Innovation Tracker asks how efficient are the greenest supercomputers, that is to say,how many Gigaflops can they perform per Watt of energy consumed? This is a key question, as a supercomputer consumes vast amounts of energy, similar to what is needed to power a small city. The performance of energy-efficient (green) supercomputers more than doubled from 2021 to 2022 (54.3 percent).
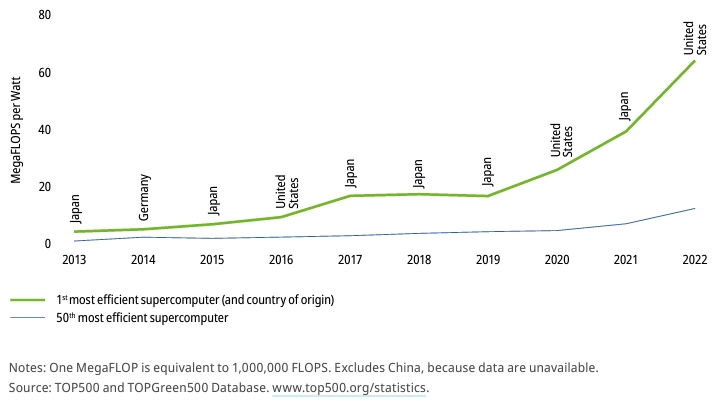 Fig.4
Fig.4
The greenest known supercomputer is Henri from the United States, followed by Frontier TDS, also from the United States, while third is France’s Adastra.
The falling cost of renewable energy is key to countering climate change and the resultant environmental challenges. Both solar and wind electricity generation costs fell by around 13 percent between 2020 and 2021. This means that 70 percent (96 percent) Global Innovation Index 2023 of the solar (wind) generation capacity newly installed in 2021 is cheaper and thus more competitive than the cheapest fossil fuel-fired new generation option.
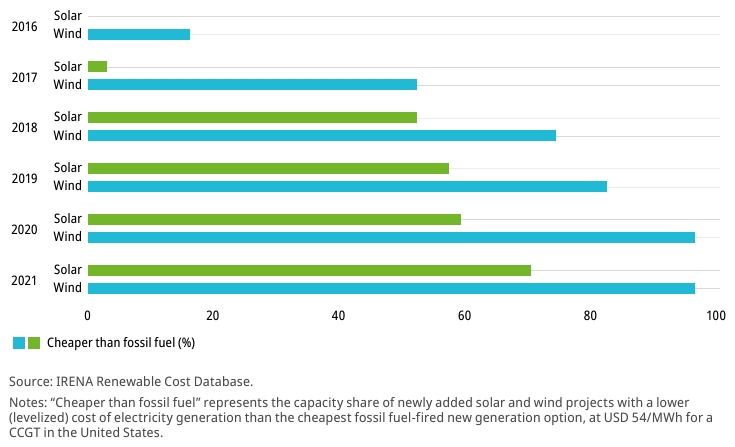 Fig.5
Fig.5
This makes it possible to target cost-saving incentives at encouraging the adoption of low-emission technologies, instead of relying on regulation or taxation to deter high-emission activities.
Note: The data analysis is based on the latest available data from reputable sources, including the World Bank, the World Intellectual Property Organization (WIPO), and Cornell University.
Results
Findings suggest that an increase in the environmental policy stringency is associated with an increase in GDP in the long-run. Whereas in the short run, more stringent environmental policies have been shown to have a questionable impact on GDP.Our results shows that environmental regulations have a positive impact on economic growth and competitiveness, particularly in industries with high environmental innovation potential.increase in GDP thus increases the competitive ability of the country across the world.
Discussion
Our findings suggest that well-designed environmental regulations can have positive impacts on economic growth and competitiveness. However, we also highlight the importance of considering the heterogeneity of environmental regulations and their impacts across industries and countries.this heterogeneity is one which questions the accuracy of the data being obtained and studied but it is obvious that the positive impact is for sure but the level of it among the countries hugely varies. particularly among countries that are leading the action against climate change, because their efforts to achieve deep emission reductions could put their own pollution-intensive producers at a competitive disadvantage in the global economy.
Here we are particular about the OECD countries.The OECD is an organization that focuses on areas such as science, technology, innovation, trade, and energy
The United States, Japan, Germany, France, and the United Kingdom are the largest economies in the Organization for Economic Cooperation and Development.
Here is a list of Top countries by GDP in 2024:
United States: $29.17 trillion
China: $18.27 trillion
Germany: $4.71 trillion
Japan: $4.07 trillion
India: $3.889 trillion
United Kingdom: $3.587 trillion
France: $3.174 trillion
Italy: $2.376 trillion
Among these except India and China all are OECD countries by trying to adapt to stringent environmental regulations these countries continue to maintain a High level of Economic growth backed up by investments in sustainable green innovation technologies.
There are two different views in the environmental economics literature on the effects of asymmetric policies on the performance of companies competing in the same market: the pollution haven hypothesis and the Porter hypothesis. The pollution haven hypothesis, which is based on trade theory, predicts that more stringent environmental policies will increase compliance costs and, over time, shift pollution-intensive production toward low abatement cost regions, creating pollution havens and causing policy-induced pollution leakage (e.g., Levinson and Taylor, 2008). This is a particularly troubling problem for global pollutants such as carbon dioxide, because it means that on top of the economic impacts on domestic firms, abatement efforts will be offset to some extent by increasing emissions in other regions.
In contrast, the Porter hypothesis (Porter and van der Linde 1995b) argues that more stringent environmental policies can actually have a net positive effect on the competitiveness of regulated firms because such policies promote cost-cutting efficiency improvements, which in turn reduce or completely offset regulatory costs, and foster innovation in new technologies that may help firms achieve international technological leadership and expand market share.
In 2024, Singapore was ranked first in the index of competitiveness for countries worldwide with an index value of 100. Switzerland was ranked second in that year with an index of 97.55, with Denmark in third.
The GII unveils the world’s innovation leaders, gauging the innovation performance of 133 economies.
Switzerland is the most innovative economy for the 14th year in a row. India ranks 39th overall, and first among lower-middle-income economies.
Sweden Ranks second,United States Ranks third,Singapore Ranks fourth,United Kingdom Ranks fifth.
Here is where Environmental Performance Index (EPI)comes into play,The EPI is prepared by Yale and Columbia universities in collaboration with the World Economic Forum.In 2024, Estonia had the highest Environmental Performance Index (EPI) score, followed by Luxembourg, Germany, Finland, and the United Kingdom.The EPI is a biennial report that assesses how sustainable countries are.
It’s based on 58 indicators across 11 categories, including air quality, climate change, and biodiversity.The EPI compares countries’ performance against their stated environmental policy targets.In 2024, India ranked 176th out of 180 countries on the EPI. This low ranking highlights the need for India to take action to improve its sustainability.
Conclusion
In conclusion, our study finds that environmental regulations can have positive impacts on economic growth and competitiveness, particularly in industries and Countries with high environmental innovation potential. Our study provides insights for policymakers to design effective environmental regulations that promote sustainable economic growth and development.countries which have an higher Environmental Performance Index topping the Innovation Index eventually leading to their higher Competitiveness Index and GDP as per latest 2024 data is a visible evidence for the conclusion of this study being conducted.
References
EMPIRICAL EVIDENCE ON THE EFFECTS OF ENVIRONMENTAL POLICY STRINGENCY ON PRODUCTIVITY GROWTH ECONOMICS DEPARTMENT WORKING PAPERS No. 1179 By Silvia Albrizio, Tomasz Koźluk and Vera Zipperer (2014)
OECD Trade and Environment Working Papers 2014/03 The Stringency of Environmental Regulations and Trade in Environmental Goods Jehan Sauvage https://dx.doi.org/10.1787/5jxrjn7xsnmq-en
Aghion, P., Dechezleprêtre, A., Hemous, D., Martin, R., & Van Reenen, J. (2016). Carbon prices, carbon capture, and the low-carbon transition. Journal of Economic Perspectives, 30(3), 141-162.
Dechezleprêtre, A., & Sato, M. (2017). The impacts of environmental regulations on competitiveness. Review of Environmental Economics and Policy, 11(1), 24-42.
OECD (2021), Assessing the Economic Impacts of Environmental Policies: Evidence from a Decade of OECD Research, OECD Publishing, Paris, https://doi.org/10.1787/bf2fb156-en.
MEASURING ENVIRONMENTAL POLICY STRINGENCY IN OECD COUNTRIES: AN UPDATE OF THE OECD COMPOSITE EPS INDICATOR ECONOMICS DEPARTMENT WORKING PAPERS No. 1703 (25 March 2022) By Tobias Kruse, Antoine Dechezleprêtre, Rudy Saffar, and Léo Robert
World Intellectual Property Organization (WIPO) (2023). Global Innovation Index 2023: Innovation in the face of uncertainty. Geneva: WIPO. DOI:10.34667/tind.48220
Policy maker’s Summary ,Block, S., Emerson, J. W., Esty, D. C., de Sherbinin, A., Wendling, Z. A., et al. (2024). 2024 Environmental Performance Index. New Haven, CT: Yale Center for Environmental Law & Policy. epi.yale.edu
OECD ECONOMIC OUTLOOK (December), VOLUME 2024 ISSUE 2 116 Database © OECD 2024
World Bank national accounts data, and OECD National Accounts data files.Licen
se : CC BY-4.0