NITI AAYOG’S SDG INDIA INDEX REPORTS: AN ASSESSMENT OF SELECTED CASE STUDIES
Shravani Thota, Muskan Jaiswal, Rishabh Dev Bharadwaj, Avika Kamboj, Rajlakshmi Anand
INTRODUCTION
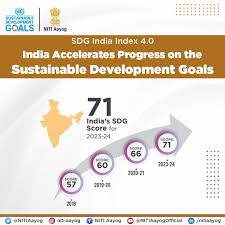
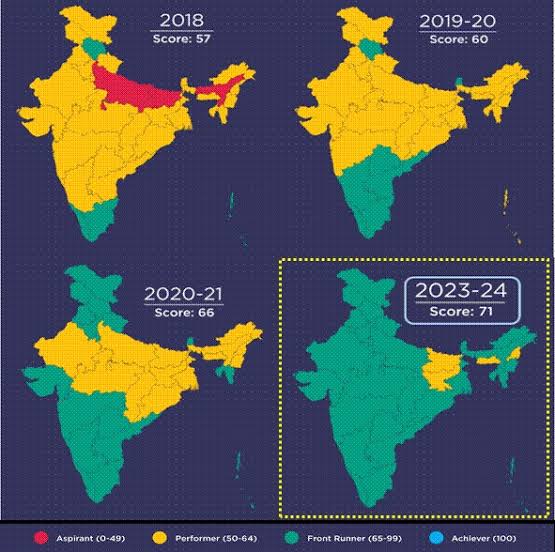
The MoSPI’s 2022 publication “Guidance on Monitoring Framework on SDGs at the sub-national Level” inter alia includes the guidelines for the development of SDG-based National Indicator Framework (NIF) and State Indicator Framework (SIF), which facilitates localization and assists State Governments in the development and refinement of the sub-national level monitoring framework by providing comprehensive guidance. In consonance with the MOSPI’s NIF and SIF, NITI Aayog has released four reports titled ‘SDG India Index,’ covering indices for 2018-19, 2019-20, 2020-21, and 2023-24 based on the globally accepted Sustainable Development Solution Network (SSDN) methodology (PIB, 2024). These reports illustrate the challenges respective States/UTs face in monitoring SDGs at the sub-national level, and the best practices being followed in the States/UTs for SDG monitoring. This monitoring mechanism through indigenized dashboards has facilitated Evidence-Based Policy Making (EBPM) in Indian policy circles. These tools evaluate the performance of the states and union territories aligned with the NIF, providing both goal-wise scores, ranking, and a composite score (0-100) that reflects overall progress collated from the raw data. (PIB, 2024). Thus, the following article undertakes four case studies (i.e., Delhi, Telangana, Uttar Pradesh, and West Bengal) to assess and delineate the attempts of SDG localization on the ground.
DELHI
The Delhi government has established a comprehensive framework to monitor and advance the Sustainable Development Goals (SDGs), aligning closely with national and global standards. This structured approach ensures effective tracking and targeted interventions across various development sectors. Central to Delhi’s SDG monitoring is the integration with the National Indicator Framework (NIF), developed by the Ministry of Statistics and Programme Implementation (MoSPI). The NIF offers a cohesive structure for assessing progress on SDGs across India, with over 95% of national indicators currently supported by available data. (PIB, 2024)
As of 2024, Delhi achieved a score of 70 on the SDG India Index. The city excelled in areas such as affordable and clean energy (SDG 7), good health and well-being (SDG 3), and clean water and sanitation (SDG 6). However, challenges persist in domains like climate action (SDG 13) and responsible consumption and production (SDG 12), indicating areas requiring intensified efforts. Recognizing the need for granular data, MoSPI is exploring non-traditional data sources, including Citizen-Generated Data (CGD) and geospatial information. These innovative approaches aim to complement official statistics, providing a more nuanced understanding of SDG progress at various administrative levels.
Focus Areas: SDG GOAL 3: Delhi has made remarkable progress in healthcare, achieving significant milestones in immunization, life expectancy, and health worker density. The immunization coverage in children aged 9–11 months has surpassed the national target of 100%, reaching an impressive 105.0%, making Delhi a leader among Union Territories (UTs). Additionally, life expectancy in India was 70 years as per the Sample Registration System (2016–2020), but Delhi stands out with the highest life expectancy at 75.8 years, reflecting better healthcare facilities and living conditions. In terms of health worker density, India had 49 health workers per 10,000 population in 2019, with 17 states and 2 UTs meeting the national target of 45 health workers per 10,000 population. Among UTs, Delhi leads with 79.04 health workers and midwives per 10,000 population, demonstrating its strong healthcare infrastructure and workforce commitment. These achievements highlight Delhi’s exemplary healthcare performance and its continued efforts toward improving public health indicators.
SDG GOAL 4: Delhi has demonstrated outstanding performance in higher secondary education, achieving the highest Gross Enrolment Ratio (GER) among Union Territories (UTs) at 94.9%. Nationally, the GER at the higher secondary level stands at 57.6%, indicating room for improvement across many regions. Among the states, Himachal Pradesh recorded the highest GER at 94.1%, while Nagaland had the lowest at 35.8%. Delhi’s exceptional enrolment rate reflects its strong educational infrastructure and commitment to enhancing access to higher secondary education.
SDG GOAL 5: The wage gap among regular employees in India remains significant, with females earning around three-fourths of what males earn, according to the Periodic Labour Force Survey (PLFS) 2022–2023. However, Delhi stands out as the best performer, achieving a female-to-male wage ratio of 1, indicating equal pay for men and women among regular-waged employees. This milestone highlights Delhi’s progress in gender wage equality, setting a benchmark for other regions in the country.
SDG GOAL 10: The Gini coefficient, a measure of wealth inequality ranging from 0 (low inequality) to 1 (high inequality), indicates the level of economic disparity in a region. According to NFHS-5 (2019–2021), India’s Gini coefficient stands at 0.20. Among all regions, Delhi emerges as the best performer with a Gini coefficient of 0.08, reflecting the lowest income inequality in the country. This suggests a more equitable distribution of wealth in Delhi compared to other states and union territories.
SDG GOAL 11: Individual household toilets (urban households): In 2023, 95.29 percent of individual household toilets were constructed against the target under the SBM(U). 17 States and 4 UTs have surpassed their target of 100 percent construction of individual household toilets. Delhi has the lowest percentage of toilet construction, with 31.66 percent and 15.50 percent against the respective State/UT. SDG GOAL 12: Use of nitrogenous fertilizer out of NPK: The ratio considered ideal for balanced and sustainable consumption of NPK fertilizers [Nitrogen (N), Phosphorus (P), and Potassium (K)] is 4:2:1, thus implying that the use of nitrogenous fertilizer in the total mix should not exceed 57.0 percent. In 2021–2022, 65.24 percent of nitrogenous fertilizer was used out of the total NPK in the country. Delhi has 87.20 percent utilization of nitrogenous fertilizer.
Performance of Delhi on the SDG India Index: Delhi has consistently ranked among the top-performing Union Territories in SDG rankings. Here is Delhi’s performance over the years:
| 2018 | 2019-20 | 2020-21 | 2023-24 | |
| Rank (Delhi) | 1 | 1 | 1 | 2 |
| Score | 69 | 61 | 75 | 77 |
| SDG | 2018 | 2019-20 | 2020-21 | 2023-24 |
| SDG 1 | 30 | 54 | 81 | 67 |
| SDG 2 | 72 | 56 | 63 | 80 |
| SDG 3 | 47 | 54 | 90 | 93 |
| SDG 4 | 50 | 64 | 75 | 85 |
| SDG 5 | 37 | 27 | 33 | 60 |
| SDG 6 | 62 | 61 | 61 | 86 |
| SDG 7 | 51 | 96 | 100 | 100 |
| SDG 8 | 86 | 60 | 65 | 58 |
| SDG 9 | 100 | 100 | 66 | 75 |
| SDG 10 | 80 | 69 | 72 | 56 |
| SDG 11 | 39 | 63 | 65 | 75 |
| SDG 12 | – | 39 | 50 | 43 |
| SDG 13 | – | 30 | 55 | 49 |
| SDG 14 | – | – | – | – |
| SDG 15 | 77 | 82 | 81 | 68 |
| SDG 16 | 68 | 64 | 62 | 51 |
Delhi has made significant progress in various Sustainable Development Goals (SDGs) over the years, with notable improvements in areas such as Good Health and Well-being (SDG 3), Quality Education (SDG 4), and Affordable and Clean Energy (SDG 7), where it reached 93%, 85%, and 100% respectively in 2023-24. However, challenges remain in SDGs such as Reduced Inequalities (SDG 10), Peace, Justice, and Strong Institutions (SDG 16), and Life on Land (SDG 15), which saw a decline in performance. While strides have been made, continued efforts are needed to address areas with slower progress to ensure a more sustainable and equitable future for the city.
TELANGANA
The Government of Telangana has developed a State Indicator Framework. The State Indicator Framework of Telangana includes indicators similar to the National Indicator Framework (NIF) as well as state-specific indicators, referred to as “State Related.” As mentioned in the previous paper, the state government has also linked the schemes it is implementing to the Sustainable Development Goals (SDGs). The total number of state indicators across 17 goals is 517, with 290 being similar to national indicators and 233 being state-related indicators. A total of 105 schemes have been mapped to the 17 Sustainable Development Goals (Planning Department, Telangana State, n.d.).
Although detailed data are available on how many state-level targets have been assigned across SDGs, there is no publicly available information on the details of these targets. The Planning Department and the Telangana State Development Planning Society (TSDPS), which serves as the nodal department for the overall monitoring of SDGs in the state and conducting evaluation studies, do not publicly disclose information about the State Indicator Framework or progress tracking of SDGs. The Directorate of Economics and Statistics, responsible for providing relevant data for SDGs, assisting departments in evolving studies and surveys, and releasing reports/publications, also does not make this information available on its website. Similarly, the Centre for SDGs, established at the MCRHRD Institute, functions as a think tank, conducting capacity-building and training programs, organizing orientation programs on SDGs, and hosting state, national, and international-level workshops and conclaves (MCRHRD Institute, n.d.). However, it does not publicly disclose information, although it maintains a training portal for government employees. The state of Telangana aligned its focus areas of the Aspirational District Program with SDGs but did not develop district indicator frameworks. The lack of transparency regarding SDG tracking suggests information asymmetry. The SDGs were promulgated in 2015, with a target to be achieved by 2030; however, in 2025, the state still struggles to track its progress, which is a concerning indicator of implementation challenges.
NITI Aayog has released four reports on the SDG India Index, covering indices for 2018, 2019, 2020-21, and 2023-24. Telangana initially started as a “Performer” in 2018 and has since been in the “Frontrunner” category in the SDG India Index rankings (NITI Aayog, 2023).
| 2018 | 2019-20 | 2020-21 | 2023-24 | |
| Rank | 9 | 3 | 10 | 9 |
| Score | 61 | 67 | 69 | 74 |
The performance of Telangana amongst 16 SDGs (SDG17 is not scored on the SDG India Index) over the years is as follows :
| Telangana Score | 2018 | 2019-20 | 2020-21 | 2023-24 |
| SDG1 | 52 | 52 | 68 | 91 |
| SDG2 | 53 | 36 | 50 | 58 |
| SDG3 | 73 | 66 | 67 | 73 |
| SDG4 | 66 | 64 | 63 | 64 |
| SDG5 | 43 | 26 | 41 | 49 |
| SDG6 | 55 | 84 | 96 | 90 |
| SDG7 | 63 | 93 | 100 | 100 |
| SDG8 | 75 | 82 | 73 | 84 |
| SDG9 | 16 | 61 | 59 | 60 |
| SDG10 | 100 | 94 | 67 | 65 |
| SDG11 | 44 | 62 | 76 | 86 |
| SDG12 | – | 58 | 73 | 75 |
| SDG13 | – | 66 | 43 | 59 |
| SDG14 | – | – | – | – |
| SDG15 | 83 | 88 | 81 | 82 |
| SDG16 | 66 | 77 | 71 | 67 |
| SDG17 | – | – | – | – |
The performance of Telangana across 16 SDGs (excluding SDG 17, which is not scored in the SDG India Index) has varied. The state has consistently performed well in SDG 3 (Good Health and Well-Being), SDG 8 (Decent Work and Economic Growth), SDG 10 (Reduced Inequalities), SDG 15 (Life on Land), and SDG 16 (Peace, Justice, and Strong Institutions). Additionally, between 2019 and 2023-24, significant progress was observed in SDG 1 (No Poverty), SDG 6 (Clean Water and Sanitation), SDG 7 (Affordable and Clean Energy), and SDG 9 (Industry, Innovation, and Infrastructure). However, Telangana has consistently underperformed in SDG 5 (Gender Equality). A deeper analysis of the statistics suggests that the low score in SDG 5 is attributable to factors such as a low sex ratio at birth, crimes committed against women, and a high percentage of ever-married women aged 15-49 who have experienced spousal violence. Additionally, missing data for many targets measured in the NIF has further affected the state’s ranking (NITI Aayog, 2018, 2019, 2020-21, 2023-24).
UTTAR PRADESH
The Government of Uttar Pradesh (UP) has developed a State Indicator Framework (SIF) aligned with the National Indicator Framework (NIF) to monitor progress toward the Sustainable Development Goals (SDGs). The SIF consists of 301 indicators, enabling comprehensive tracking at both state and district levels (Ministry of Statistics and Programme Implementation, 2022).
The Planning Department serves as the nodal agency for SDG implementation and monitoring in UP, while the Directorate of Economics and Statistics is responsible for collecting and analyzing relevant data. The state has also launched an SDG dashboard, allowing real-time tracking of progress (MOSPI, 2022).
Performance of Uttar Pradesh in the SDG India Index: NITI Aayog has published four reports on the SDG India Index, covering rankings for 2018, 2019-20, 2020-21, and 2023-24. Uttar Pradesh has shown steady progress, improving its overall ranking and moving from a Performer to a Frontrunner category in 2023-24 (NITI Aayog, 2023).
Uttar Pradesh’s SDG Performance Over the Years :
| Uttar Pradesh | 2018-19 | 2019-20 | 2020-21 | 2023-24 |
| Rank (out of 28 states and 8 UTs) | 25 | 23 | 19 | 14 |
| Composite Score (0-100) | 42 | 55 | 60 | 67 |
| Uttar Pradesh | 2018 | 2019-20 | 2020-21 | 2023-24 |
| SDG 1 | 40 | 55 | 70 | 78 |
| SDG 2 | 45 | 52 | 60 | 72 |
| SDG 3 | 50 | 57 | 75 | 85 |
| SDG 4 | 47 | 60 | 70 | 80 |
| SDG 5 | 30 | 40 | 50 | 65 |
| SDG 6 | 50 | 62 | 75 | 92 |
| SDG 7 | 60 | 75 | 95 | 100 |
| SDG 8 | 35 | 50 | 60 | 70 |
| SDG 9 | 55 | 65 | 78 | 85 |
| SDG 10 | 40 | 55 | 60 | 66 |
| SDG 11 | 35 | 50 | 68 | 82 |
| SDG 12 | 30 | 45 | 65 | 85 |
| SDG 15 | 50 | 55 | 60 | 70 |
| SDG 16 | 42 | 58 | 65 | 77 |
WEST BENGAL
Based on the NITI Aayog’s 2023-24 SDG India Index tabular impact analysis of capacity development and advocacy on the progress of SDG localization, respective States/UTs have been marked on 5 areas and 12 parameters. 1.) Vision/Roadmap: The state of West Bengal has developed a vision document entailing mission and short/long-term plans with targets to be achieved by 2030 (NITI Aayog Report, 2021-22) but it is not available in the public domain as of yet. 2.) Coordination: The Department of Planning and Statistics has been designated as the nodal department for coordinating and monitoring SDG implementation in the State. Despite having a mechanism for coordination with line departments at the state level and formation of working groups/ Committees/ task forces, the state does not have a mechanism for mapping SDGs with schemes and departments in particular. The concerned departments have initiated the process of framing the policy based on State Plan 2030. 3.) Monitoring and Reporting: Despite identifying 585 measurable indicators consisting of inputs, outputs as well as proxy indicators for monitoring the progress of the SDGs. The government of West Bengal does not have any SDG dashboard, State Indicator Framework (SIF), District Indicator Framework (DIF), or Block Indicator Framework (BIF) to date. 4.) Budgeting: The Annual Financial Statement of the state does mention the SDG-based scheme allocation, but it’s generalized and not specific. 5.) Capacity Building: The state has an active involvement of CSOs/ CSR in awareness generation and capacity building. Alongside, it capacitates building and training the officials.
The following tabular data highlights the state’s progress made so far based on the NITI Aayog’s SDG India Index Reports: Aspirant (0-49), Performer (50-64), Front Runner (65-99), Achiever (100).
|
WEST BENGAL |
2018-19 |
2019-20 |
2020-21 |
2023-24 |
|
Rank (out of 28 states and 8 UTs) |
13 |
14 |
11 |
10 |
|
Composite Score (0-100) |
56 |
60 |
62 |
70 |
|
WEST BENGAL |
2018-19 |
2019-20 |
2020-21 |
2023-24 |
|
SDG 1 |
57 |
52 |
59 |
63 |
|
SDG 2 |
50 |
46 |
46 |
56 |
|
SDG 3 |
66 |
70 |
76 |
79 |
|
SDG 4 |
51 |
50 |
54 |
60 |
|
SDG 5 |
40 |
38 |
41 |
45 |
|
SDG 6 |
54 |
83 |
81 |
86 |
|
SDG 7 |
40 |
58 |
98 |
100 |
|
SDG 8 |
63 |
72 |
57 |
63 |
|
SDG 9 |
45 |
68 |
53 |
66 |
|
SDG 10 |
76 |
73 |
71 |
70 |
|
SDG 11 |
25 |
34 |
45 |
54 |
|
SDG 12 |
57 |
79 |
79 |
94 |
|
SDG 13 |
37 |
39 |
39 |
44 |
|
SDG 14 |
43 |
50 |
50 |
100 |
|
SDG 15 |
88 |
88 |
53 |
91 |
|
SDG 16 |
72 |
73 |
81 |
82 |
|
SDG 17 |
– |
– |
– |
– |
West Bengal, since 2018, has been consistently categorized as an ‘Aspirant’ under SDG 5 and 13. The state has been a persistent ‘Performer’ under SDG 1, 4 and 8. ‘Front Runner’ under SDG 3, 6, 10, 12, 15 and 16. And an exceptional ‘Achiever’ status under SDG 7 and 14 has been allocated. Whereas SDG 17 has not been quantitatively analyzed due to data unavailability, qualitative analysis has been attempted (SDG India Index, 2018, 2019, 2020, 2023).
Though a few Indicators of Immediate Concerns (Ioc) have been highlighted in the DST, Govt. of India sponsored project jointly conducted by the West Bengal State Council of Science and Technology (WBSCST) and Institute of Development Studies Kolkata (IDSK), 2022 Final Report – titled ‘Mapping Science and Technology Needs in West Bengal.’ These district-wise immediate IoCs have been identified using secondary data sources like NFHS-5, NSS-PLFS (2019), NCRB (2018), Agricultural Statistics at a Glance (2018), etc. Moreover, the report highlights three inherent limitations – i.) The indicators represent certain determining factors, which might not be brought to daylight with just the value of the indicators; ii.) Official secondary data sources suffer from serious limitations, making it hard to conduct District-level or Block-level studies; iii.) The lived experiences of the common people remain partially unaddressed. Consequently, to align with the Agenda 2030 governance spirit, the state of West Bengal needs to synchronize its efforts and match the competitive and cooperative federal trajectories at this sand-clock juncture.
In conclusion, it can be stated that the overall ranking of all the selected cases has improved gradually, which can be congenially attributed to the tracking of local initiatives despite data irregularities and gaps. Thus, NITI Aayog must be credited as it has not just pushed SDG localization through Evidence-Based Policy Making (EBPM) but has institutionalized SDG monitoring as a standalone/parallel framework by turning it into an integral part of national and sub-national thinking about development through institutional ownership, collaborative competition, capacity development, and following a whole-of-society approach.