Authors:
Aamani Bhardwaj, Maria Martinez, Gauri Khanna, Folashade Ruth Abayomi-Mighty, Navani Sana, Swetna Mago Bhatia, Adewale Ademola Joshua, & Aminat Temilola Shaibu
Introduction
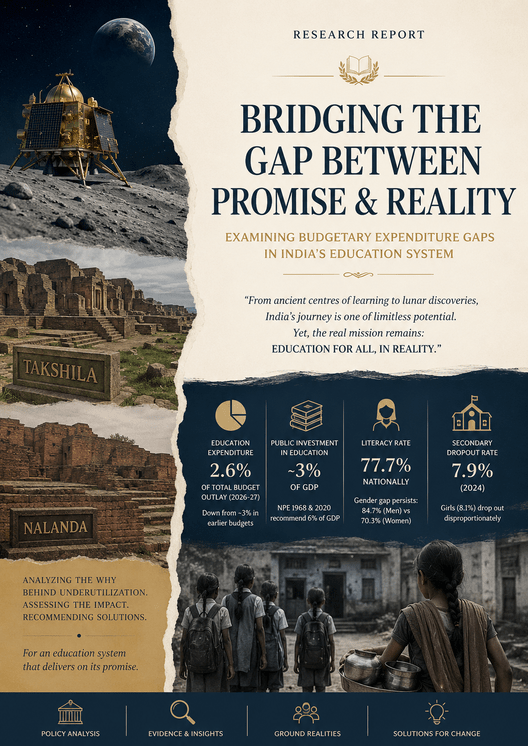
The nation that takes pride in being one of the only four countries to send a probe to the lunar surface and in which India made the pathbreaking discovery of water molecules on the lunar surface, and which has been home to universal education institutions like Takshila and Nalanda today stands with figures like these: India’s contribution to its educational needs still stands at around 3% of its GDP while the National Policy on Education 1968 and 2020 both recommend increasing public investment on education to 6% of GDP. It is concerning that as a proportion of the total budget outlay (₹53.5 lakh crore for 2026-27), education accounts for about 2.6%, down from around 3% in earlier budgets like 2019-20 (Karthika, 2025). Moreover, India’s literacy rate 77.7% nationally, with a persistent gender gap (84.7% for men versus 70.3% for women) and a state-level range from 96.2% in Kerala to 66.4% in Andhra Pradesh remains far from a uniformly “ideal” level across states (International Institute for Population Sciences [IIPS] & ICF, 2021).
This paper aims at looking at what lies behind this constant gap in the demand, supply, allocation and optimum spending of the budgetary allowances. Is the real problem that the education allowance has never been 6% of the GDP, the recommended percentage? Or is it also that whatever amount is allocated never gets spent in the right manner, and on the right things, at the time when it would have most impact? Where do the allocated funds go if not spent on recommendations made? Why is the school dropout rate still very high in secondary years? The secondary-level dropout rate, while it fell from 13.1% in 2018 to 7.9% in 2024, remains nearly three times the rate observed at the elementary level (8.2% versus roughly 3%) and continues to affect girls disproportionately (8.1%) (ASER Centre, 2025; Department of School Education and Literacy, 2025). Can just higher allocation of funds resolve these issues? The problem lies much deeper. Young girls disproportionately drop out to take on household chores cited by roughly 42% of girls who leave school or because safe transport to school is unavailable, among the leading reasons for female discontinuation identified in national surveys on school non-attendance (Ministry of Statistics and Programme Implementation, n.d.). What will eventually bring about the major mindset shifts? There has been a visible effort by governments year after year, but the gaps don’t seem to lessen.
The primary research objective of this report, is thus, to examine the extent of budgetary expenditure gaps in the Indian education system. This will be done by identifying the core reasons of why educational funds are underutilized in the first place. Secondly, this report will assess the impact of expenditure gaps on educational development how this expenditure inefficiency is actually demonstrated by on-ground realities of poor infrastructure, lack of resources and other similar deficiencies. Third, using a top-down approach, this report shall address administrative, institutional and policy-related bottlenecks affecting expenditure while also proposing policy recommendations for improving fund utilization and implementation efficiency (Upadhyaya, 2025; Mehta, 2025).
While much of the existing scholarship on educational financing concentrates on allocation patterns, this report shifts focus to expenditure effectiveness examining not merely how much is budgeted, but how efficiently those resources are actually deployed. The report also explores the direct link between policy implementation and expenditure outcomes and provides recommendations targeted specifically at reducing leakages, delays and underutilization of resources (Motkuri & Revathi, 2024; School Education in the Union Budget 2026, 2026).
The structure of the research report is as follows: An overview of educational financing in India and the larger background of public spending on education is given at the very outset. The policy framework that governs educational financing is then established by looking at significant educational policies and patterns in government spending. Building on this framework, the study looks at the many kinds of budgetary spending gaps and their causes, focusing on institutional, administrative, and policy-related constraints. The key findings are then analysed in terms of how they impact both the efficiency of spending and the progress of education. The study offers legislative recommendations and grassroots solutions before concluding with the macro implications of improving financial efficiency and accountability in the education sector.
This brings us back to the central research question guiding this research report: what are the structural, administrative, and institutional factors driving the persistent gap between budgeted allocations and actual expenditure in India’s school education sector, and how does this underutilization shape educational outcomes?
Literature Review
Public expenditure on education leads to individual development and collective economic benefits. The National Education Policy of India 2020 outlines the vision of the new education system in India (Nandini, 2020). There were several policies implemented since Independence to transform the education sector. Central government donates to education in two ways, namely, centrally supported schemes and central sector schemes. The Kothari commission in 1966 recommended that public expenditure should reach the level of 6% of the Gross Domestic Product. Then the Saikia Committee of 1966 stressed the need for expenditure of 6% of the GNP. The Right to Education Act gave shelter to many deprived students to pursue education, and it mandates that schools reserve 25% of positions in their admissions (Khaitan, 2021).
Educational spending increased from 2.8% of GDP in 2014-15 to 3.1% in 2019-20 (Ansari & Khan, 2018), who examined the level, trend, and growth of public expenditure on education in India.
Financial constraints are widely cited as a primary reason for the failure to achieve key educational targets. Historically, State governments are the primary funders of public education. Systemic bureaucratic leakage and unspent funds often distort the perceived progress of educational funding (Comptroller and Auditor General of India, 2025; Foundation for Responsive Governance, 2026). Sector-wise distribution sheds light on the equitable allocation of resources across primary, secondary, and higher education (Kumar, 2020). As per the University Grants Commission (2021), a considerable amount of expenditure on higher education goes in the form of salaries and maintenance, while leaving limited resources for research, infrastructure development, and quality enhancement. Spending on public education makes up less than 4% of GDP (Anuradha and Tanuka, 2008). According to Bhattacharyya (2019), in all 28 Indian states, public spending on education is directly linked with GDP growth, with a correlation between GDP and expenditure on education of 0.42. The share of secondary education in the total expenditure has been rotating around 28-30%. Ansari and Khan (2018) similarly found that central government spending has increased, while state government spending has decreased. Educational expenditure in India has generally remained between 3-4% of GDP over the past two decades. Inadequate public investments are one of the major reasons behind India’s failure to achieve several educational targets (Tilak, 2006). Elementary education receives the largest share of educational expenditure (Guleria et al., 2025). Although extensive literature exists on educational expenditure trends, relatively few studies distinguish between budget allocations and actual expenditure. Most analyses focus on the volume of spending rather than the efficiency of fund utilization.
Educational financing remains a critical determinant of the quality, accessibility, and sustainability of education systems worldwide. In India, concerns regarding the adequacy of education funding and the effectiveness of public expenditure have generated considerable scholarly attention. Several studies have examined trends in educational financing, expenditure priorities, and the relationship between budgetary allocations and educational outcomes. Among these studies are the works of De and Endow (2008), Patel (2026), and Samanta and Samanta (2026), which collectively provide valuable insights into budgetary allocation, expenditure patterns, and financing challenges within India’s education sector.
De and Endow (2008) conducted a comprehensive analysis of public expenditure on education in India, focusing on expenditure trends and educational outcomes. Using secondary data obtained from government reports and expenditure records, the study examined changes in educational financing over time and assessed the roles played by both the central and state governments. The findings revealed that although educational expenditure increased significantly over the years, total spending remained below the internationally recommended benchmark of 6 percent of Gross Domestic Product (GDP). The study observed that state governments continued to shoulder the largest share of educational expenditure, particularly in non-plan spending, while the central government increasingly assumed responsibility for plan expenditure through various educational programmes and centrally sponsored schemes. The study further revealed that expenditure growth contributed substantially to improvements in educational access and enrollment, particularly at the elementary education level. Government efforts to expand basic education resulted in increased school participation and wider access to educational opportunities for disadvantaged populations. However, the authors noted that improvements in educational quality did not occur at the same pace as enrollment growth. Despite increased spending, challenges related to infrastructure development, teacher quality, and learning outcomes persisted. The study concluded that higher expenditure alone could not guarantee improved educational outcomes unless accompanied by effective implementation strategies and efficient utilization of resources. The findings highlighted the existence of a gap between expenditure commitments and actual educational performance, emphasizing the need for stronger monitoring and accountability mechanisms in the education sector.
Building upon the discussion of educational financing in India, Patel (2026) examined recent budgetary trends in the education sector from 2020 to 2025, with particular attention to government priorities under the National Education Policy (NEP) 2020. The study employed a descriptive trend analysis using secondary data obtained from Union Budget documents, Ministry of Education reports, Economic Surveys, and other government publications. The primary objective was to assess changes in education budget allocations and identify priority areas receiving government attention during the period under review. The findings indicated that education funding experienced a temporary decline during the COVID-19 pandemic, reflecting the economic pressures faced by the government. However, budgetary allocations increased steadily in subsequent years, demonstrating renewed commitment to educational development and recovery. The study reported that India’s education budget increased from approximately ₹99,312 crore in 2020–21 to about ₹1,28,650 crore in 2025–26. Significant funding was allocated to programmes such as Samagra Shiksha Abhiyan, PM Poshan, PM SHRI Schools, Kendriya Vidyalayas, and Navodaya Vidyalayas, reflecting the government’s emphasis on improving educational access, quality, and inclusiveness. Patel further observed a shift in policy priorities toward digital learning, skill development, innovation, and post-pandemic educational recovery. The study highlighted the increasing importance of technology-driven education and workforce development initiatives as part of India’s broader educational transformation agenda. Nevertheless, despite the upward trend in budget allocations, educational expenditure continued to fall below the 6 percent GDP benchmark recommended by NEP 2020. The study concluded that although government commitment to education financing had strengthened considerably, the effectiveness of these investments depended largely on efficient implementation and proper utilization of allocated resources. Thus, the research emphasized that increasing budget allocations alone would not automatically lead to improved educational outcomes unless accompanied by sound expenditure management practices.
While De and Endow (2008) and Patel (2026) focused primarily on India’s education financing system, Samanta and Samanta (2026) expanded the discussion by providing a comparative analysis of public financing of school education across selected South Asian countries. The study adopted a longitudinal comparative research design and utilized secondary data obtained from UNESCO, the World Bank, national budget documents, and education reports. The objective was to examine expenditure priorities, funding patterns, and their implications for educational equity and quality within the South Asian region. The study found that most South Asian countries had increased public spending on school education over time, reflecting growing recognition of education as a key driver of economic and social development. However, considerable differences existed among countries in terms of expenditure priorities, funding efficiency, and educational outcomes. In the case of India, the researchers observed a steady increase in educational expenditure, particularly in elementary education, consistent with national efforts to promote universal basic education. Despite these improvements, significant challenges remained regarding educational equity, regional disparities, and effective resource utilization. The study further demonstrated that countries achieving better educational outcomes were not necessarily those spending the most money but rather those that utilized educational resources more efficiently and maintained strong accountability systems. The authors argued that effective educational financing requires more than increased budget allocations. Instead, educational investments must be strategically directed toward teacher development, infrastructure improvement, digital learning, inclusion programmes, and monitoring mechanisms. The study also emphasized the importance of governance structures and institutional capacity in determining the success of educational expenditure. Consequently, the researchers concluded that educational outcomes depend not only on the amount of funding available but also on how effectively those resources are allocated and managed.
Taken together, the findings of these studies reveal several important themes regarding educational financing in India. First, all three studies acknowledge the importance of sustained government investment in education as a prerequisite for educational development and national progress. Second, the studies consistently demonstrate that although educational budgets have increased over time, actual expenditure levels remain below recommended targets, particularly the 6 percent GDP benchmark. Third, the literature highlights the persistent challenge of translating financial investments into measurable improvements in educational quality and learning outcomes. Furthermore, the studies collectively suggest that budgetary allocations alone are insufficient for achieving educational transformation. Effective resource utilization, strong governance mechanisms, transparency, accountability, and equitable distribution of funds are equally important factors influencing educational outcomes. The literature also highlights the growing role of the central government in educational financing and the increasing emphasis on digital learning, skill development, and quality improvement initiatives. Despite these positive developments, challenges related to regional inequalities, expenditure efficiency, and educational quality continue to constrain the effectiveness of public investment in education.
The study by the Accountability Initiative, Centre for Policy Research (2020–2021) analyzed the allocation, release and utilization of funds under the Samagra Shiksha programme across major Indian states. The study found that significant differences existed in fund utilization among states: some states utilized most of their approved budgets, while others spent less than half. Delays in fund releases and difficulties in meeting matching fund requirements contributed to low expenditure, and states collectively spent a relatively small portion of approved budgets during the study period. The study directly examines budget-to-expenditure gaps in school education and highlights how administrative and financial challenges affect fund utilization.
CPR’s Accountability Initiative’s series of Budget Briefs offers the most detailed, programme-specific data on Samagra Shiksha, India’s flagship school education scheme and the main vehicle for implementing the Right to Education (RTE) Act, 2009 and the NEP 2020. The briefs describe three compounding layers of fiscal underperformance: allocation versus Ministry projection, fund release versus allocation, and state spending versus approved budget. The allocation to Samagra Shiksha in the 2022-23 budget was the highest since the scheme was launched, with the Government of India allocating ₹37,383 crore at the beginning of the fiscal, 25% higher than the revised estimates of the previous year, but still below the Ministry of Education’s own projected requirement. Release layer faces huge delays. Till 30th November, 2022, only 51% of GoI allocations were released to states as against 40% released till October, 2021. The gap is even starker at the level of state expenditure. Across states, less than two thirds of the approved budget was spent between FY 2018-19 and FY 2021-22 and in FY 2022-23, only 22% of the total approved budget had been spent by October 2022. There is significant variation across states with utilisation rates as low as 37% in Maharashtra in FY 2021-22. The briefs also monitor downstream outcomes and note that the ICT infrastructure in government schools remained flat at 33 per cent between 2019-20 and 2021-22. The scheme is funded on a 60:40 central-state cost-sharing ratio (90:10 for northeastern and Himalayan states), and the analysis makes clear that delayed releases from the centre compound states’ already limited administrative and absorptive capacity. These briefs constitute the most operationally precise documentation of the budget-to-expenditure gap in Indian school education.
Delays persist at the release stage in more recent years as well: in FY2023-24 the Centre released only 72% of the approved central share nationally, rising to 75% in FY2024-25 yet Meghalaya received 99% of its share while West Bengal received just 18% (Foundation for Responsive Governance, 2026). By FY2024-25, average state-level utilisation of released funds stood at just 62% nationally, with Tamil Nadu (23%) and West Bengal (24%) among the weakest performers and northeastern states such as Nagaland (90%) among the strongest (Foundation for Responsive Governance, 2026; iDream Education, 2026). This widening gap between release and utilisation reinforces the distinction this paper draws between a Centre-side funding gap and a state-side absorption gap: even where the Centre releases funds promptly, several states remain structurally unable to spend them.
Karthika K, in her article “Trend Analysis of Education Budget Allocation and Expenditure (2015–2025): Assessing the Implications before and after the implementation of NEP 2020” published on the Centre for Educational and Social Studies website, examines a decade of education financing in India. India’s education budget has undergone significant expansion over the past decade, with school education allocations nearly doubling from ₹42,219 crores in 2015 to ₹78,572 crores in 2025, and higher education rising similarly from ₹26,855 crores to ₹50,078 crores in the same period. Before NEP 2020, allocations followed traditional patterns centred on infrastructure, teacher recruitment, and curriculum but post NEP, the emphasis shifted toward digital education, skill development, and research. However, a persistent and structurally embedded gap between budgeted allocations and actual expenditure remains the central challenge: during the pandemic year of 2020, for instance, only ₹51,842 crores were spent against an allocation of ₹59,845 crores a shortfall of nearly ₹8,000 crores and this pattern of underutilisation due to administrative bottlenecks, delayed fund releases, and weak state-level absorption capacity has continued beyond the pandemic as well. On the outcomes side, NEP 2020 has delivered measurable gains in secondary and higher education, with the Gross Enrollment Ratio for higher education rising sharply from 27.4% in 2020 to 39.7% in 2024, and secondary enrollment reaching 72.3% confirmed as statistically significant through t-test analysis. Primary education enrollment, however, showed virtually no change, given it was already near-universal, suggesting that NEP-driven reforms have had limited additional impact at the foundational level. A concerning structural signal is the 61% cut in UGC allocations in 2024–25, indicating a possible pivot away from traditional higher education funding models. Most critically, despite a decade of nominal budget growth, India’s total education expenditure as a share of GDP has remained stagnant between 2.8% and 2.9% well below the 6% of GDP target set by NEP 2020 itself and the long-standing global benchmark. The paper concludes that the real challenge is no longer the size of the budget but the efficiency of its utilisation, recommending a shift toward outcome-based budgeting linked to measurable literacy and enrollment targets, stronger financial oversight, increased investment in teacher training and digital infrastructure, and targeted funding for underserved and marginalised communities (Karthika).
In the article “School Education in the Union Budget 2026” published on Education for All in India on February 1, 2026, the author provides a detailed analysis of the Union Budget 2026–27 and its implications for school education. The Union Budget 2026-27, presented by Finance Minister Nirmala Sitharaman on February 1, 2026, allocates a record ₹83,562 crore to the Department of School Education and Literacy a 6.35% rise from the previous year under the broader vision of Viksit Bharat 2047 and NEP 2020 implementation. Major scheme allocations include ₹42,100 crore for Samagra Shiksha Abhiyan and ₹12,750 crore for PM POSHAN, alongside new initiatives like AVGC Content Creator Labs in 15,000 secondary schools, a High-Powered Education-to-Employment Committee, BharatNet expansion to all government secondary schools, and dedicated girls’ hostel funding per district. However, the budget’s record headline numbers are tempered by two structural concerns: first, as a share of total government outlay, education has actually declined to about 2.6% from 3% in 2019-20; and second, the chronic gap between Budget Estimates, Revised Estimates, and actual expenditure persists actuals in 2023-24 were ₹1,14,054 crore against a BE of ₹1,20,000 crore, and the RE for 2024-25 was revised downward by nearly ₹7,000 crore from BE, with actuals typically falling 10-15% short. Combined Centre-State spending remains at 4.1-4.6% of GDP still well below NEP’s 6% target and a 6.35% nominal growth rate may not even outpace inflation, meaning real-term stagnation is a genuine risk. The report concludes that bolder financial commitments, stronger state-level coordination, and improved implementation frameworks are essential for these allocations to translate into measurable outcomes (“School Education in the Union Budget 2026”).
Venkatanarayana Motkuri and E. Revathi, in their article “Private and Public Expenditure on Education in India: Trend over last Seven Decades and impact on Economy,” published in the Indian Public Policy Review in February 2024, conduct a comprehensive seven-decade analysis of education financing in India. The central argument is that while both public and private education expenditure have grown enormously in absolute terms public rising from ₹64.5 crore in 1951-52 to ₹7,36,581 crore in 2018-19, and private from ₹86.5 crore to ₹5,09,961 crore , the more consequential story is the structural shift in the ratio between the two. At independence, private expenditure actually exceeded public; public then outpaced private through the 1950s–80s, driven by Kothari Commission recommendations and Five-Year Plan investments; but since the 1990s coinciding directly with economic liberalisation private expenditure has consistently grown faster than public, with the public-to-private per capita ratio peaking at 2.3 in 1991-92 and declining to 1.5 by 2018-19 and projected to fall further. By 2018-19, public and private spending together reached 6.6% of GDP (3.9% public + 2.7% private), technically meeting the long-standing 6% benchmark but crucially, only because private households are bearing a growing and disproportionate share of the burden. In real terms (constant prices), private expenditure on education has shown accelerating growth since the 1970s while public expenditure growth has decelerated throughout meaning the state is progressively retreating from education financing even as demand expands. The paper theorises this through excess demand (public supply too limited to meet growing demand, pushing families toward private institutions) and differentiated demand (perceived quality gaps favouring private schools and colleges), both of which are rooted in inadequate public investment rather than genuine household preference. Private institutions 46% of school enrollment and 70% of higher education enrollment by 2021-22 are filling the gap left by the state, but at an increasing cost to households, particularly lower-income ones for whom education spending as a share of total consumption has risen five times since the 1950s. The econometric analysis strengthens the policy case: Granger causality testing shows that public expenditure on education causes GDP growth, which in turn causes private expenditure but not the reverse. Private spending does not independently drive growth. This means cutting or stagnating public investment in education is not just an equity failure but an economic one. The Vector Error-Correction model confirms a long-run equilibrium relationship between public education spending and GDP, with both short-run and long-run coefficients statistically significant. The paper concludes by warning that NEP 2020, while endorsing the 6% GDP target and aiming to curb commercialisation, contains provisions such as fee-setting autonomy for private institutions and relaxed entry norms that may inadvertently deepen privatisation, particularly in higher education. The study further notes that the share of the Union government in total educational expenditure fell from 24.9% in 2014–15 to 17.7% in 2019–20, with states contributing about 3% of GDP compared to a paltry 1% from the centre. In international comparisons, India ranks last among BRICS countries in education spending as a share of GDP and, at its 131st HDI rank, spends proportionately as little as Angola (Motkuri and Revathi).
Rutvik Upadhyaya, in the “Demand for Grants 2025-26 Analysis: Education” report published by PRS Legislative Research in February 2025, provides a comprehensive review of the Ministry of Education’s budget allocations and key education policy issues. The Ministry’s total allocation for 2025-26 stands at ₹1,28,650 crore a 13% increase over revised estimates of 2024-25 but this headline figure is immediately qualified by the fact that in 2024-25, the Ministry underspent its budget by 5%, with school education underspending by 7% and higher education by 2%, continuing the chronic pattern of budget-to-expenditure gaps. The Department of School Education received ₹78,572 crore (61% of the Ministry budget), with Samagra Shiksha Abhiyan alone accounting for 52% of this yet between 2018-19 and 2023-24, only 85% of Samagra Shiksha allocations were actually utilised on average. Other schemes fared far worse: PM-SHRI actual spending in 2023-24 was 70% lower than budgeted, PM-POSHAN estimated spending in 2024-25 was 25% lower than budgeted, and STARS spending was 32% below revised estimates. Education’s share of the total Union Budget has also been on a declining trend since 2015-16, even as nominal allocations grow meaning education is losing ground relative to overall government priorities. On the structural side, the report flags several interlocking crises: Gross Enrollment Ratio drops sharply from 93% at primary level to just 56% at higher secondary level, with states like Bihar at only 30%; 35% of all schools enrol fewer than 50 students, creating severe resource and teacher shortages; 16% of teaching posts for grades 1-8 were vacant as of 2022-23, rising to 40% in Jharkhand and 32% in Bihar; 12% of teachers across all levels lacked professional qualifications, with 48% of pre-primary teachers unqualified; and only 44% of targeted school heads and teachers had been trained under NISHTHA as of February 2025. In higher education, 78% of all colleges are privately run and 66% of enrollment is in private colleges which cost twice as much as government institutions while scholarship spending by the Ministry has actually declined year-on-year from ₹2,218 crore in 2017-18 to ₹1,282 crore in 2024-25 RE, deepening affordability concerns. India’s R&D expenditure stands at just 0.64% of GDP, with universities contributing only 9% of total R&D spending far below global peers. The combined Centre-State education expenditure reached 4.64% of GDP in 2020-21, still significantly short of NEP 2020’s 6% target, and the mean years of schooling in India remains just 6.6 years against the prescribed 12 lower even than Bangladesh (7.4) and Brazil (8.3) (Upadhyaya).
Prof. Arun C. Mehta, in his brief “Analysis of Department of School Education Budget Allocations (2025-2026)” published on Education for All in India, provides a focused analysis of the Department of School Education and Literacy’s budget for 2025-26. The Budget Estimates for 2025-26 stand at ₹78,572.10 crores a 16.3% increase from the Revised Estimates of 2024-25 (₹67,571.20 crores) and significantly higher than actual expenditure of ₹67,972.28 crores in 2023-24. The budget is heavily concentrated in three areas: Samagra Shiksha at ₹41,250 crores (52.5% of the total department budget), PM POSHAN at ₹12,500 crores (15.9%), and KVS and NVS combined at 18.8% together accounting for nearly 87% of the department’s entire allocation. Samagra Shiksha’s allocation has grown 25.6% over actual 2023-24 expenditure and 11.5% over RE 2024-25, reflecting strong on-paper commitment to NEP 2020 implementation but the paper flags a critical concern: ₹4,180 crores (11.3%) of Samagra Shiksha funds went unutilised in 2023-24, raising serious questions about absorption capacity even as allocations climb further. PM SHRI shows the most dramatic jump a 66.7% increase from RE 2024-25 to BE 2025-26 yet its actual expenditure in 2023-24 was only ₹1,214.68 crores against a budgeted ₹6,050 crores, one of the starkest utilisation failures across all schemes. The brief also highlights a deeply concerning enrollment decline of 6.7 million students (2.77%) between 2022-23 and 2023-24 and calls for urgent state-wise analysis of how Samagra Shiksha funds are being utilised given this drop. On digital infrastructure, only 53.9% of total schools and 46.2% of government schools had internet facilities, making the proposed broadband connectivity push a welcome but long-overdue intervention. The National Means cum Merit Scholarship Scheme received only ₹374 crores with no significant increase a concern given the growing private school cost burden on families. The core tension in this budget: allocations are rising faster than the system’s demonstrated ability to spend and utilise funds implementation capacity, not funding, is now the binding constraint (Mehta).
Association of Indian Universities (2023) emphasized the importance of research as a core function of higher education and a key driver of national development. The authors argued that universities are expected not only to impart knowledge through teaching but also to contribute to societal progress through research and innovation. To strengthen the research culture in India, several initiatives such as the National Research Foundation (NRF), SPARC, STRIDE, and IMPRESS were introduced to promote collaboration among universities, industries, and government agencies. The study further noted that excellence in education depends on the effective utilization of available resources and the creation of an enabling environment that supports meaningful research activities. This perspective suggests that the value of educational funding lies not only in allocation but also in its effective utilization, which is central to understanding budget-to-expenditure gaps in the education sector. In a related discussion, the Association of Indian Universities (2023) examined the growing influence of technology and artificial intelligence on education. The study observed that technological innovations have transformed teaching and learning processes by promoting personalized learning and increasing access to educational resources. According to the authors, educational institutions must invest in digital infrastructure, technological tools, and skill development initiatives to prepare learners for the demands of the twenty-first-century workforce. The study further highlighted the changing role of teachers as facilitators of learning rather than mere transmitters of knowledge. These findings imply that adequate and efficient utilization of educational funds is necessary to support technological advancement and educational transformation. Consequently, budget-to-expenditure gaps may restrict investments in technology, thereby affecting the quality and effectiveness of school education.
Karmakar and Suri (2023) investigated the financing of higher education in India with particular emphasis on the allocation of funds under the Union Budget for the 2022–2023 fiscal year. The study identified both external and internal sources of educational financing, including international agencies, government institutions, private organizations, and non-governmental organizations. The authors found that several challenges continue to affect educational financing in India, including weak utilization of revenue sources, commercialization of education, low tuition fees in public institutions, and disparities in fund allocation. The study further revealed that government funds are distributed through designated agencies rather than directly to educational institutions, with a significant proportion of funding allocated to institutions such as the Indian Institutes of Technology and central universities. Despite increases in budgetary allocations, financing challenges remain a major obstacle to educational development. Although the study focused primarily on higher education, its findings provide useful insights into issues of resource allocation and expenditure management that are relevant to understanding budget-to-expenditure gaps in the school education sector.
Similarly, the study titled Public Expenditure on Education in India: Trends and Implications (Guleria et al., 2025) examined patterns of public spending on education across different educational levels. The study analyzed budgetary allocations from both state and central governments and assessed how funds were distributed among various educational subsectors. Findings revealed that educational expenditure increased considerably in the 2022–2023 fiscal year, with budget provisions for education and training reaching over ₹941,746 crore. The study noted that education accounted for a substantial proportion of government expenditure, reflecting the importance attached to educational development. However, the authors stressed the need for continuous review and evaluation of funding patterns to ensure that educational resources are distributed effectively and equitably. The study underscores the importance of monitoring not only the amount allocated to education but also how effectively such allocations are translated into actual expenditures and educational outcomes.
Choudhary (2026), in a report published by PRS Legislative Research, examined expenditure trends within India’s Ministry of Education between 2017–18 and 2025–26. The study revealed that ministry expenditure grew at a compound annual growth rate of 5% during the period under review. It further showed that approximately 95% of allocated funds were utilized by the revised stage of the budget cycle. However, concerns were raised regarding the timing of expenditure, as a significant proportion of funds remained unspent until the final months of the financial year. The report highlighted recommendations by the Standing Committee on Education, which emphasized the need for more balanced expenditure patterns throughout the year to improve financial efficiency. The study also provided valuable statistics on school enrolment, teacher population, and educational institutions across India, highlighting the scale of government investment required to sustain the education sector. These findings are particularly relevant to the present study because they directly address issues of fund utilization, expenditure timing, and budget implementation, which are central to understanding budget-to-expenditure gaps in India’s school education sector.
Singh (2019) presents a multi-level comparative analysis of public expenditure on school education across global, national, inter-state (with focus on Jharkhand), and union budget dimensions. The methodology is based on secondary data from Union Budget documents, State Budget documents, Economic Surveys, MHRD Annual Reports and BRICS Joint Statistical Publications. As a percentage of GDP, the average on education expenditure in the world was 4.16% between 2000 and 2014, and India recorded only 2.6% (2007) and 2.9% (2016), which was the lowest among the BRICS countries with South Africa leading at 6.9%. Within India, the paper documents long-run expenditure trends showing that while absolute spending on education grew alongside GDP, school education expenditure as a share of GDP fluctuated between 2.2% and 2.7% from 2005–06 to 2015–16, averaging 2.5%, with elementary education maintaining roughly 2% of GDP throughout. The paper examines the variations between Budget Estimates (BE) and actual expenditure in the Department of School Education and Literacy for the period 2010-11 to 2017-18 and finds the worst execution gap in 2014-15 (83% utilization) due to the 14th Finance Commission’s fiscal devolution to the states, which structurally shifted the fiscal burden from the ministry to the states without ensuring equivalent increases in states’ education spending. The paper concludes that the realisation of the universal, free and compulsory quality school education as mandated by the RTE Act and aligned with SDG-4 can only be realised through the joint and sustained commitment of both central and state governments.
Patil, Hanagodimath, and Jai Prabhakar (2022) have emphasized that educational expenditure should be viewed as an investment in human capital. The study treats education expenditure as an investment in human capital. Sometimes regional disparities in the public expenditure results in unequal educational outcomes across all the states. Tilak emphasizes the role of the state as the primary provider of education. Balodi and Srivastava (2021) further examined government expenditure on education across Centre and states in India, finding structural imbalances in how funds are shared and utilized. Udayakumar, Rajendran, and Sugirtha Rani (2024) provided additional evidence through a trends and growth analysis of public expenditure on education in India, reinforcing the pattern of persistent gaps between allocation and actual spending.
Literature Review Synthesis
The reviewed studies consistently demonstrate that budget-to-expenditure gaps remain a persistent challenge in India’s school education sector. Although the studies were conducted across different periods and contexts, they converge on the view that increasing education budgets alone does not guarantee effective utilization of allocated funds. De and Endow (2008), Accountability Initiative (2020), CESS (2024), and Accountability Initiative & ResGov (2025) all report that substantial portions of education budgets remain unspent due to weaknesses in financial management and implementation rather than a lack of budgetary allocation.
Despite this broad agreement, the studies differ in the factors they emphasize. De and Endow (2008) attribute expenditure gaps mainly to delayed fund releases and weak coordination between the central and state governments. Accountability Initiative (2020) identifies delays in fund disbursement and states’ inability to provide matching funds as major barriers. In contrast, CESS (2024) emphasizes administrative bottlenecks and institutional inefficiencies. Accountability Initiative & ResGov (2025) highlight differences in state implementation capacity and programme management as key explanations for varying expenditure rates.
Taken together, these studies suggest that budget-to-expenditure gaps arise from a combination of administrative, institutional, and fiscal factors rather than a single cause. However, most focus on specific programmes, states, or individual aspects of education financing. Few provide a comprehensive analysis of budget allocations, actual expenditures, and implementation challenges across India’s school education sector over an extended period.
This study addresses that gap by examining budget allocations, actual expenditures, and the institutional and administrative factors associated with persistent budget-to-expenditure gaps across India’s school education sector.
Research Gap
Existing studies have examined education financing, fund utilization, and programme implementation in India. However, there is limited research that comprehensively analyzes budget allocations and actual expenditures across the school education sector while simultaneously examining the institutional factors responsible for persistent expenditure gaps. This study seeks to fill that gap.
Theoretical Framework
Having identified this gap in the literature, the analysis now turns to the theoretical frameworks that help explain why such gaps persist. This study situates its analysis within two complementary theoretical traditions: Fiscal Federalism and Public Financial Management (PFM). Neither framework alone accounts for the pattern documented in this paper that underutilization is structural, geographically concentrated, and persistent across scheme types but together they offer a two-level explanation that moves the analysis beyond simple description toward causal interpretation.
Fiscal Federalism theory examines how financial responsibilities and resources are divided between different tiers of government, and how the design of intergovernmental transfers shapes downstream outcomes (Oates, 1972; Rao, 2017). India’s school education financing operates through a conditional, cost-sharing model most visibly the 60:40 Centre-state split for Samagra Shiksha (90:10 for northeastern and Himalayan states) under which states must commit matching funds before releases are triggered. This paper’s findings are consistent with what fiscal federalism theory predicts of such conditional-grant systems: states with weaker fiscal capacity to meet matching requirements, or with administrative machinery too thin to process claims quickly, systematically lag in fund absorption. This explains why the North-East region recorded the lowest spending rate (89.90%) despite its favourable 90:10 ratio, pointing to state-capacity constraints operating independently of the funding formula, and why the North region’s absolute unspent total is so large it is not one anomalous state but a structural pattern across fiscally weaker states (Uttar Pradesh and Bihar together account for nearly a third of the national gap). The theory also clarifies a distinction the paper draws throughout: a funding gap versus an absorption gap. The former is a Centre-side release problem; the latter is a state-side capacity problem. Fiscal federalism theory locates both within the design of the transfer system itself, rather than treating them as isolated administrative failures.
Public Financial Management theory complements this by explaining what happens after funds reach the state level. PFM frameworks most notably the PEFA (Public Expenditure and Financial Accountability) framework evaluate government spending systems along dimensions such as budget credibility (how closely actual expenditure tracks the original budget), predictability of resource flow, and quality of expenditure control and reporting (PEFA Secretariat, 2016; Andrews et al., 2014). Applied here, PFM theory accounts for scheme-level variation that fiscal federalism alone cannot: why PM SHRI underspent by over 80% against its 2023-24 budget while Samagra Shiksha, a more institutionally mature and longer-running scheme, retained roughly 85% utilization over the same period. This gap in performance across schemes administered by the same states, under the same broad transfer architecture, points to weaknesses internal to public expenditure management procurement delays, weak in-year financial controls, and limited absorptive infrastructure at the point of spend rather than to funding design alone.
Read together, the two frameworks map the two structural points where India’s school education gap consistently emerges: the transfer boundary between Centre and state (fiscal federalism) and the execution boundary within the state’s own spending system (PFM). This dual lens frames the paper’s core argument: that the persistence of the budget-to-expenditure gap across a decade of rising allocations reflects intergovernmental and administrative design, not merely inadequate financial commitment.
Research Methodology
Building on this theoretical foundation, the following section outlines the methodological approach used to examine these dynamics empirically. This study adopts a longitudinal trend analysis using secondary data to examine education budget allocations and expenditure patterns in India over the period 2015–2026. The selected timeframe covers the years before and after the introduction of the National Education Policy (NEP) 2020, making it possible to assess whether the policy has influenced government spending on education and the utilization of allocated funds.
The study relies entirely on secondary data obtained from credible and publicly available sources. These include the Union Budget documents published annually by the Ministry of Finance and the Ministry of Education, which provide Budget Estimates, Revised Estimates, and Actual Expenditure figures. Additional information is drawn from Parliamentary Demand for Grants reports, PRS Legislative Research publications, Comptroller and Auditor General (CAG) audit reports, the Economic Survey of India, and relevant reports from NITI Aayog. To support the interpretation of the findings, the study also reviews peer-reviewed journal articles and reports published by international organizations such as UNESCO, the World Bank, and UNICEF on education financing and public expenditure.
Only data sources that met specific selection criteria were included in the study. These criteria required that the documents be published by recognized government agencies, reputable international organizations, or peer-reviewed academic journals; contain reliable quantitative information on education financing; cover the study period between 2015 and 2026; and provide sufficient methodological clarity. Sources that contained incomplete financial data, lacked official credibility, or were not directly related to public education expenditure were excluded from the analysis.
The analysis primarily employs descriptive statistics and trend analysis to examine changes in education financing over time. Annual budget allocations, revised estimates, and actual expenditures are compared to identify patterns in government spending before and after the implementation of NEP 2020. Percentage changes and budget utilization rates are calculated to determine how effectively allocated funds were spent each year. Particular attention is given to major government programmes, including Samagra Shiksha Abhiyan, PM POSHAN, and PM SHRI, to assess differences between allocated budgets and actual expenditures. The quantitative findings are further interpreted alongside evidence from policy documents and previous empirical studies to provide a broader understanding of the factors influencing education financing in India.
Although the study provides valuable insights into national education budgeting, it is not without limitations. Since the analysis is based entirely on secondary data, the findings depend on the accuracy and completeness of official government records and published reports. Changes in budget classifications, reporting formats, and programme structures across the study period may also affect year-to-year comparisons. Furthermore, the study focuses on national-level budgetary trends and does not examine differences in education financing across individual states or evaluate the direct impact of spending on educational outcomes. These limitations should be considered when interpreting the results, while recognizing that the study offers a useful overview of education financing trends and expenditure efficiency in India over the study period.
Research Objectives
- Assess the impact of expenditure inefficiency on educational development — This objective responds to the research question probing persistent secondary school dropout rates and maps onto whether simply increasing the allocation of funds can resolve these deep-rooted problems.
- Evaluate expenditure effectiveness over mere allocation volume — Rather than looking only at the size of the budget, this objective focuses on how efficiently resources are deployed, exploring the direct connection between policy implementation and actual expenditure outcomes. It addresses the core problem of India’s failure to meet the recommended 6% GDP allocation, as well as its failure to spend existing allocations correctly.
- Evaluate systemic and administrative bottlenecks — To identify and map the bureaucratic delays, fund-release bottlenecks, and capacity constraints at the state and local levels.
- Assess grassroots capacity and decentralized governance — To evaluate the administrative readiness of local educational authorities and School Management Committees in utilizing allocated funds before year-end deadlines.
- Conduct a structural analysis of fiscal federalism and cash flow delays — To trace the multi-tiered fund flow pipeline down to School Management Committees, identifying the specific friction points created by the central-state cost-sharing models.
- Develop outcome-based policy solutions — To develop actionable policy and governance recommendations addressing budgeting, fund disbursement, and the minimization of leakages and underutilization.
Data Collection and Findings
India’s School Education Budgets Analysis
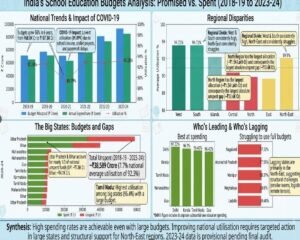
With the study’s objectives and methodology established, this section presents the empirical findings on budget allocation and expenditure patterns. Every year, the central government sets aside a sizable budget for school education across India’s states and union territories, and every year, states do not spend all of it. This section looks at six years of data from 2018-19 through 2023-24 to understand how large these budgets are, how much actually gets used, and which states and regions are performing well versus struggling.
Over six years, about ₹4,98,594 crore was allocated for school education schemes, and roughly ₹4,60,005 crore of it was actually spent. That leaves close to ₹38,589 crore about 7.7% of the total unutilized. The overall spending rate works out to 92.3%, which sounds reasonable on paper, but as Table 4.1 demonstrates, it conceals significant differences between states.
Trend of Budget Allocation and Expenditure (2018–19 to 2023–24)
Table 4.1 presents the annual budget allocation, actual expenditure, unspent funds, spending rate, and budget gap in India’s education sector from 2018–19 to 2023–24.
| Year | Allocation (₹ Cr) | Expenditure (₹ Cr) | Unspent (₹ Cr) | Spending Rate (%) | Gap (%) |
| 2018-19 | 68,881.12 | 63,528.79 | 5,352.33 | 92.23 | 7.77 |
| 2019-20 | 74,679.94 | 69,123.34 | 5,556.60 | 92.56 | 7.44 |
| 2020-21 | 68,772.37 | 61,268.79 | 7,503.58 | 89.09 | 10.91 |
| 2021-22 | 81,482.23 | 75,662.63 | 5,819.60 | 92.86 | 7.14 |
| 2022-23 | 96,956.44 | 89,872.36 | 7,084.08 | 92.69 | 7.31 |
| 2023-24 | 1,07,822.36 | 1,00,549.43 | 7,272.93 | 93.25 | 6.75 |
Note. Gap (%) = 100 − Spending Rate (%). Source: PRS Legislative Research (2019–2024), Demand for Grants Analysis: Education [annual series]; Ministry of Education, Government of India, Lok Sabha Unstarred Question replies, 2019–2024.
Budget allocations increased steadily from ₹68,881.12 crore in 2018–19 to ₹1,07,822.36 crore in 2023–24, indicating increased government commitment to the education sector. Actual expenditure also increased over the study period. Despite this, a portion of the allocated funds remained unspent each year. The largest gap was recorded in 2020–21, when 10.91% of allocated funds remained unutilized, attributable to disruptions caused by the COVID-19 pandemic. The smallest gap was observed in 2023–24, with only 6.75% of funds remaining unspent. Overall, while budgetary allocations and expenditures have grown substantially, the challenge of fully utilizing allocated funds persists.
National Budget Utilization
Table 4.2 presents the overall budget allocation, expenditure, and unspent funds in India’s education sector during the study period.
| Variable | Amount (₹ Cr) | Percentage (%) |
| Total Allocation | 4,98,594 | 100.0 |
| Total Expenditure | 4,60,005 | 92.3 |
| Total Unspent Funds | 38,589 | 7.7 |
The high spending rate suggests that a substantial proportion of allocated educational resources was utilized during the period. Nevertheless, ₹38,589 crore in unspent funds indicates persistent inefficiencies in budget execution. These expenditure gaps affect the implementation of educational programmes and the achievement of sectoral objectives.
State-Level Spending Performance
Table 4.3 presents the ten states with the largest education budgets over the six-year period.
| State | Allocated (₹ Cr) | Spent (₹ Cr) | Unspent (₹ Cr) | Spending Rate (%) |
| Uttar Pradesh | 78,315.43 | 70,519.42 | 7,796.01 | 90.05 |
| Bihar | 41,995.10 | 37,881.10 | 4,114.00 | 90.20 |
| Maharashtra | 40,943.99 | 38,927.45 | 2,016.54 | 95.07 |
| West Bengal | 34,006.77 | 31,180.55 | 2,826.22 | 91.69 |
| Madhya Pradesh | 31,081.78 | 28,521.07 | 2,560.71 | 91.76 |
| Rajasthan | 30,900.09 | 28,216.18 | 2,683.91 | 91.31 |
| Karnataka | 25,826.47 | 24,405.03 | 1,421.44 | 94.50 |
| Tamil Nadu | 23,592.23 | 22,744.32 | 847.91 | 96.41 |
| Andhra Pradesh | 22,726.43 | 21,259.33 | 1,467.10 | 93.54 |
| Gujarat | 20,309.34 | 19,097.79 | 1,211.55 | 94.03 |
Uttar Pradesh alone received approximately ₹78,315 crore over the six years, roughly 15.7% of the national total, and nearly double what the next state received. Its unused balance of ₹7,796 crore is by far the largest of any state. Together, Uttar Pradesh and Bihar alone account for nearly a third of the entire country’s unspent education funds. Conversely, Tamil Nadu achieved a spending rate of 96.4% on a large allocation, demonstrating that high spending rates are achievable even with substantial budgets.
Regional Spending Performance
Table 4.4 presents the spending performance of different regions in India based on their budget utilization rates.
| Region | Allocated (₹ Cr) | Spent (₹ Cr) | Unspent (₹ Cr) | Spending Rate (%) |
| West | 62,417.23 | 59,117.69 | 3,299.54 | 94.71 |
| South | 1,01,987.79 | 96,588.93 | 5,398.86 | 94.71 |
| Islands | 647.21 | 603.45 | 43.76 | 93.24 |
| Central | 43,013.68 | 39,427.84 | 3,585.84 | 91.66 |
| North | 1,54,241.76 | 1,40,657.86 | 13,583.90 | 91.19 |
| East | 1,06,776.75 | 97,079.53 | 9,697.22 | 90.92 |
| North-East | 29,510.04 | 26,530.04 | 2,980.00 | 89.90 |
The West and South regions both recorded spending rates of 94.71%, comfortably above the national average of 92.3%. The North-East region had the lowest spending rate of 89.90%, a pattern that holds consistently across almost every state in the region, pointing to structural factors such as smaller administrative teams, more challenging logistics in remote terrain, and slower fund-release cycles rather than any single year’s anomaly. The North region, which contains the largest absolute allocation owing to Uttar Pradesh, Rajasthan, and Bihar, consequently accounts for the largest absolute amount of unspent funds at approximately ₹13,584 crore.
States versus Union Territories
Table 4.5 presents the comparative spending performance of states and union territories.
| Category | Allocated (₹ Cr) | Spent (₹ Cr) | Unspent (₹ Cr) | Spending Rate (%) |
| States | 4,83,693.83 | 4,46,087.08 | 37,606.75 | 92.23 |
| Union Territories | 14,900.63 | 13,918.26 | 982.37 | 93.41 |
States account for 97.01% of the total allocation and approximately 97.5% of the unspent amount. Union Territories spend marginally more efficiently at 93.41% versus the states’ 92.23%, but their share of the overall picture is small enough that it does not significantly affect national averages. Improving national education spending efficiency therefore depends almost entirely on improving state-level absorption capacity.
Share of Total Unspent Funds by State
Table 4.6 highlights the states contributing most to the national education spending gap.
| State | Unspent Funds (₹ Cr) | Share of National Gap (%) |
| Uttar Pradesh | 7,796.01 | 20.20 |
| Bihar | 4,114.00 | 10.66 |
| West Bengal | 2,826.22 | 7.32 |
| Rajasthan | 2,683.91 | 6.95 |
| Madhya Pradesh | 2,560.71 | 6.64 |
| Maharashtra | 2,016.54 | 5.23 |
Of the ₹38,589 crore in total unspent education funds nationally, Uttar Pradesh alone accounts for 20.20%, followed by Bihar at 10.66%. Together these two states are responsible for nearly one-third of all unutilized education resources in the country. This concentration underscores that targeted interventions in a handful of high-population, low-utilization states would have a disproportionately large impact on the national spending rate.
Data Limitations
Several important caveats apply to the analysis above. Ladakh’s data for 2018-19 and 2019-20 was reported jointly with Jammu & Kashmir prior to the 2019 union territory reorganization and cannot be disaggregated. The 2020-21 dip in spending rates is almost entirely attributable to COVID-19 disruptions rather than any structural deterioration in state capacity. The 2023-24 figures remain provisional pending the Comptroller and Auditor General’s final audit and may be revised. PM SHRI data for 2022-23 reflects only approximately half a year of activity, as the scheme launched in October 2022. Finally, some states report combined central and state spending while others report only central scheme contributions, introducing inconsistencies in cross-state comparisons.
Discussion
This study demonstrates that the gap between allocated and actual educational expenditure in India is not merely a budgetary imbalance but a persistent implementation challenge. Throughout the study period, public expenditure on education remained between 2.8% and 4.6% of GDP, considerably below the 6% benchmark recommended by the Kothari Commission (1966) and reaffirmed in the National Education Policy (NEP) 2020. While previous studies have consistently highlighted this funding gap (De & Endow, 2008; Singh, 2019; Motkuri & Revathi, 2024), the present study extends the literature by showing that national expenditure figures conceal substantial variation in fund utilization across individual schemes and states.
Although the overall national utilization rate averaged 92.3% between 2018–19 and 2023–24, scheme-level analysis revealed significant disparities. PM SHRI utilized only ₹1,214.68 crore of its ₹6,050 crore allocation in 2023–24, whereas Samagra Shiksha consistently achieved an average utilization rate of about 85% (Mehta, 2025; Upadhyaya, 2025). These findings suggest that aggregate expenditure statistics may provide an overly optimistic picture of implementation performance by masking severe underutilization within specific programmes. They also refine the argument of De and Endow (2008), who maintained that increased education expenditure alone cannot improve outcomes without effective implementation. The present findings indicate that implementation challenges may be concentrated in newer programmes that have not yet developed sufficient administrative and institutional capacity, while more established schemes appear better positioned to absorb available funds.
The findings further complicate Patel’s (2026) description of post-pandemic recovery in education financing. Government allocations increased steadily from ₹68,881 crore in 2018–19 to ₹1,07,822 crore in 2023–24, demonstrating stronger fiscal commitment to the education sector. However, higher allocations did not translate into full expenditure, with over ₹7,272 crore remaining unspent even during the best-performing financial year. This supports Karthika’s (2025) conclusion that the principal constraint is no longer the availability of financial resources but the capacity of institutions to utilize allocated funds efficiently. The evidence therefore suggests that increasing education budgets, although important, is unlikely to achieve intended outcomes unless accompanied by improvements in financial management and programme implementation.
Significant disparities were also observed across states and regions. Tamil Nadu recorded an expenditure utilization rate of 96.41%, compared with 90.05% in Uttar Pradesh, while the North-East region performed below the western and southern regions. These findings suggest that expenditure efficiency varies considerably within India and that the state may be a more meaningful unit of analysis than the national average. This observation challenges the comparative perspective of Samanta and Samanta (2026), who focused primarily on differences between countries. The Accountability Initiative (2020) similarly reported substantial fluctuations in utilization across states and programmes, indicating that even relatively high-performing states may experience implementation weaknesses under particular schemes.
The state-level findings also extend Singh’s (2019) explanation of the implementation difficulties that followed fiscal devolution under the Fourteenth Finance Commission. While fiscal decentralization may have created conditions for uneven expenditure performance, this study suggests that differences in administrative capacity play an equally important role. States such as Uttar Pradesh and Bihar accounted for a disproportionately large share of national unspent education funds despite receiving substantial allocations, whereas Tamil Nadu and Gujarat consistently utilized a greater proportion of their budgets. This indicates that allocation size alone does not determine expenditure performance; rather, the ability of state institutions to plan, release, and implement education programmes appears to be a critical determinant of effective fund utilization.
The findings also have broader economic and policy implications. Motkuri and Revathi (2024) argued that weaknesses in public education financing increase the financial burden on households through greater reliance on private education. Although this study did not examine household expenditure directly, persistent underutilization suggests that the effective level of public investment reaching schools remains below budgeted levels despite increasing government allocations. Consequently, states with consistently low expenditure utilization may provide fewer publicly financed educational opportunities, potentially increasing dependence on private expenditure. Furthermore, the existing 60:40 central-state cost-sharing arrangement (90:10 for northeastern and Himalayan states) means that delays in fund release at any stage of the financing process can reduce the time available for programme implementation. The Accountability Initiative (2020) reported that only 51% of central allocations had been released by late November 2022, illustrating how delayed disbursement may contribute to lower utilization irrespective of a state’s administrative capacity.
Overall, the findings suggest that India’s budget-to-expenditure gap should be viewed primarily as an implementation challenge rather than simply a financing problem. Underutilization is concentrated within particular schemes, states, and fiscal years, indicating that a uniform national response is unlikely to address the underlying causes. Instead, policy efforts should prioritize timely fund releases, targeted capacity-building for newly introduced programmes, stronger financial management systems, and enhanced monitoring of persistently low-performing states. These measures are likely to improve expenditure efficiency more effectively than increasing budgetary allocations alone.
This study is limited by its reliance on secondary administrative data, government budget documents, and legislative reports, which describe expenditure patterns but do not explain the administrative or institutional processes responsible for underutilization. In addition, expenditure utilization reflects the proportion of funds spent rather than the quality or effectiveness of that expenditure, and differences in state reporting timelines may affect direct comparisons. Future research should employ mixed-method or comparative case-study approaches involving both high- and low-performing states to examine the institutional factors influencing expenditure performance. Further studies should also investigate whether higher utilization rates consistently translate into improved educational outcomes such as literacy, school completion, infrastructure development, and learning achievement.
Conclusion
This study has analyzed the variation between fund allocation and actual school expenditure in India across the period 2015 to 2026. While significant investment in the sector has been carried out, the study demonstrates that simply increasing nominal allocations does not ensure development in the education sector. The issue is not merely the level of financial provision but the efficient use, timely implementation, and effective management of resources.
The findings establish that budget deficits in education financing are structural rather than episodic in nature, consistent with the fiscal federalism and public financial management dynamics outlined earlier in this study. Despite school budgets rising from ₹42,219 crore in 2015 to ₹83,562 crore for 2026-27, large amounts of allocated resources remain unutilized, particularly under flagship programmes such as Samagra Shiksha, PM-SHRI, and PM-POSHAN. Delays in budget releases, bureaucratic obstacles, insufficient coordination between levels of government, and weak execution capabilities at the state and local levels are among the most significant factors driving this underutilization. The consequences are not merely statistical: they are evident in poor infrastructure, teacher shortages, deficient digital connectivity, inadequate student welfare measures, and regional disparities in learning outcomes.
In light of these findings, forthcoming policy directions should prioritize financial efficacy alongside financial scale. This requires expediting budget release timelines, developing more robust monitoring and accountability mechanisms, improving cooperative frameworks between the centre and states, and building administrative capacity at the institutional and district levels. An outcome-oriented system of budgeting, anchored in measurable indices such as enrollment rates, student learning outcomes, teacher-student ratios, and infrastructure standards, could create the conditions for fiscal provisions to become genuinely accountable and effective.
While an increase in financial commitment toward the long-standing target of 6% of GDP remains essential, the provision of finance alone cannot catalyze meaningful change in this sector. Resources must be appropriately directed toward actual educational needs. By addressing the budget-to-expenditure gap and strengthening the implementation mechanism, India can establish a more accountable framework for educational financing, translating budgetary allocations into tangible progress for students across the country.
References
Accountability Initiative. (2020). Samagra Shiksha: Budget brief 2020–21. Centre for Policy Research. https://accountabilityindia.in/wp-content/uploads/2020/01/Samagra-Shiksha-2020-21.pdf
Accountability Initiative, & ResGov. (2025). Samagra Shiksha budget brief FY 2024–25. ResGov. https://resgov.org/contents/reports/129_Samagra%20Shiksha%20Budget%20Brief.pdf
Ansari, T., & Khan, M. A. (2018). An analysis of public expenditure on education in India. World Wide Journal of Multidisciplinary Research and Development, 4(4), 89–92.
ASER Centre. (2025). Annual status of education report (ASER) 2024. Pratham. https://asercentre.org/aser-2024/
Association of Indian Universities. (2023). Higher education for Atmanirbhar Bharat. University News, 61(12), 12–15.
Balodi, B., & Srivastava, A. (2021). Government expenditure on education: A study of Centre and states in India. Educational Quest: An International Journal of Education and Applied Social Sciences, 12(3), 1–11.
Bhattacharyya, P. (2019). Public expenditure on education and economic growth: A state-level analysis in India. Humanities & Social Sciences Reviews, 7(6), 533–539. https://doi.org/10.18510/hssr.2019.7683
Centre for Educational and Social Studies. (2024). Trend analysis: Education budget allocation and expenditure (2015–2025): Assessing implications. https://cessedu.org/blog/trend-analysis-education-budget-allocation-and-expenditure-2015-2025-assessing-implications
Choudhary, J. (2026, February 17). Demand for grants 2026–27 analysis: Education. PRS Legislative Research. https://prsindia.org/files/budget/budget_parliament/2026/DfG_Analysis_2026-27-Education.pdf
Comptroller and Auditor General of India. (2025, December 9). Performance audit report on school education, Odisha [Tabled in the Odisha Legislative Assembly]. As reported in Shivani, K. N. (2025, December 10). 3.5 lakh lack uniforms, books a year late in Odisha schools as half of Samagra Shiksha funds lie idle: CAG. Careers360.
De, A., & Endow, T. (2008). Public expenditure on education in India: Recent trends and outcomes (RECOUP Working Paper No. 18). Research Consortium on Educational Outcomes and Poverty, University of Cambridge. https://www.ssoar.info/ssoar/handle/document/69258
Department of School Education and Literacy, Ministry of Education, Government of India. (2025). Unified District Information System for Education Plus (UDISE+) 2024–25.
Foundation for Responsive Governance (ResGov). (2026, February 1). Samagra Shiksha budget brief (Vol. 3, Issue 1). https://resgov.org/contents/reports/129_Samagra%20Shiksha%20Budget%20Brief.pdf
Guleria, N., Mittal, R. K., Isha, T., & Goutam, S. (2025). Public expenditure on education in India: Trends and implications. International Journal of Engineering Technologies and Management Research, 12(6), 32–50. https://doi.org/10.29121/ijetmr.v12.i6.2025.1625
iDream Education. (2026, July 9). Samagra Shiksha 2.0: What it funds and where the utilisation gap shows up. https://www.idreameducation.org/blog/samagra-shiksha-abhiyan-2-0-utilisation-gap/
International Institute for Population Sciences (IIPS), & ICF. (2021). National Family Health Survey (NFHS-5), India, 2019–21. Ministry of Health and Family Welfare, Government of India.
Karmakar, R., & Suri, C. (2023). Financing of higher education in India: Allocation of funds as per Union Budget 2022–2023 [Unpublished manuscript].
Karthika, K. (2025). Trend analysis of education budget allocation and expenditure (2015–2025): Assessing the implications before and after the implementation of NEP 2020. Centre for Educational and Social Studies. https://cessedu.org/home
Mehta, A. C. (2025, February 4). Analysis of Department of School Education budget allocations (2025–2026). Education for All in India. https://educationforallinindia.com/analysis-of-department-of-school-education-budget-allocations-2025-2026/
Ministry of Statistics and Programme Implementation, Government of India. (n.d.). Household social consumption: Education in India (NSS report, latest round).
Motkuri, V., & Revathi, E. (2024). Private and public expenditure on education in India: Trend over last seven decades and impact on economy. Indian Public Policy Review. https://ippr.in/index.php/ippr/article/view/246
Patil, A., Hanagodimath, S. V., & Jai Prabhakar, S. C. (2022). Public expenditure on the education sector in India. Antrocom Online Journal of Anthropology, 18(2a), 151–157.
Patel, H. (2026). A five-year budget trend analysis and evaluation of important priority areas for education financing in India (2020–2025). International Journal of Multidisciplinary Research and Growth Evaluation, 7(1), 382–387.
PRS Legislative Research. (2019–2024). Demand for grants analysis: Education [annual series]. https://prsindia.org
PRS Legislative Research. (2025, February 20). Demand for grants 2025–26 analysis: Education. https://prsindia.org/files/budget/budget_parliament/2025/Demands_For_grants_2025-26_Education.pdf
School education in the Union Budget 2026. (2026, February 1). Education for All in India. https://educationforallinindia.com/school-education-in-the-union-budget-2026/
Samanta, S., & Samanta, T. (2026). Public financing of school education in South Asia: A longitudinal comparative study of expenditure priorities and their implications for India. International Research Journal of Education and Technology, 9(2), 278–300.
Singh, U. (2019). A comparative study of the trends of public expenditure on education in India with special reference to school education [Unpublished research study]. Vinoba Bhave University.
Udayakumar, K., Rajendran, S., & Sugirtha Rani, A. (2024). Public expenditure on education in India: A trends and growth analysis. Shanlax International Journal of Economics, 12(3), 38–46.