IISPPR

International Institute of SDGS & Public Policy Research

IISPPR Field Research Program

Qualitative Research Methods Syllabus

About the Course

Program Duration

36 - 50 Hours Over 60 Days

Class Timings

Evening Class and Maximum 3 Classes a week

Class Dates

1st of January to 28th of February completely online class

What You’ll Learn

By the end of the course, participants will be able to:

1. Understand key concepts in data science, statistics, and visualization.

2. Analyze and interpret public datasets and policy indicators.

3. Apply machine learning and AI-based tools to social problems responsibly.

4. Identify biases, gaps, and ethical challenges in data-driven governance.

5. Communicate findings effectively through data storytelling and visualization.

6. Build a policy data dashboard or applied capstone project relevant to your domain. Network with like-minded professionals in the analytics and data science domain

What Makes This Course Different?

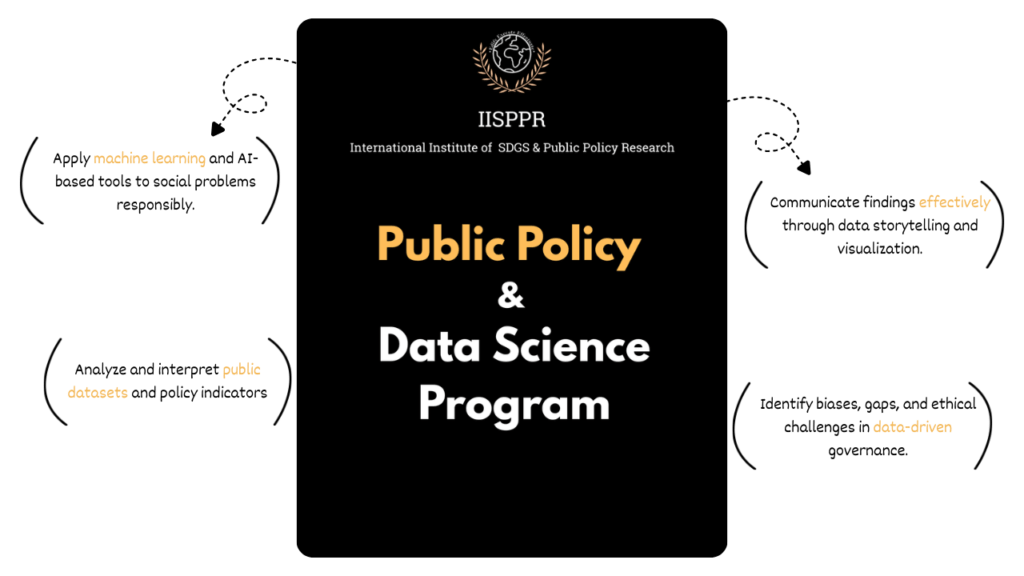
Critical, Not Just Technical

We go beyond definitions — unpacking power, participation, and systemic failures.

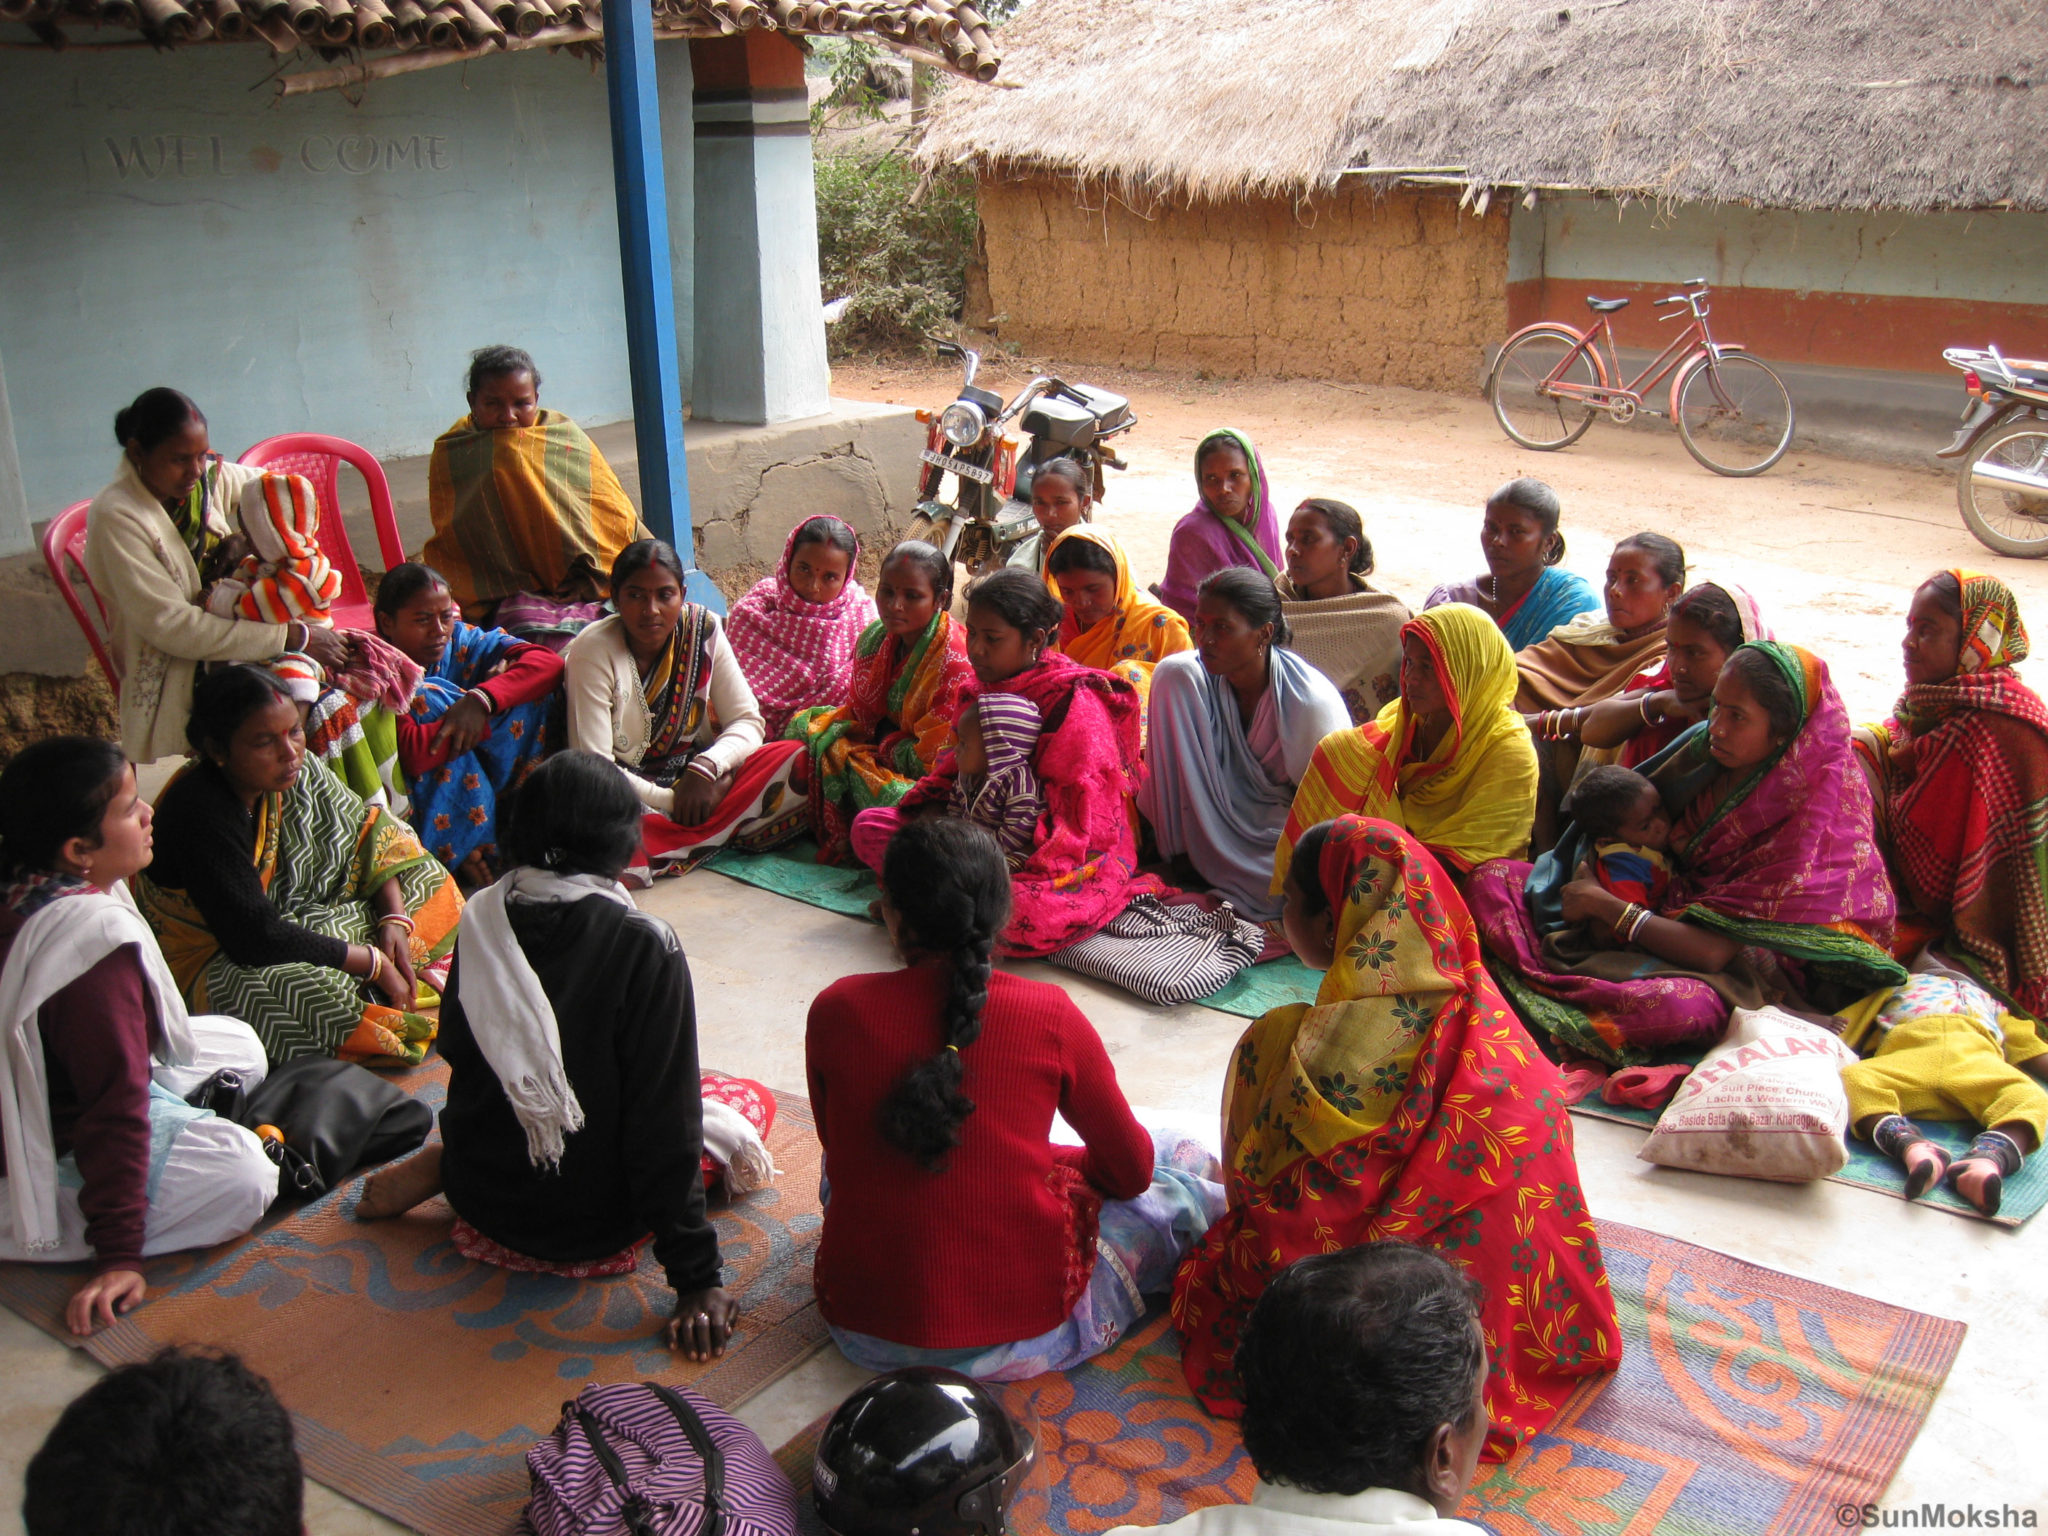
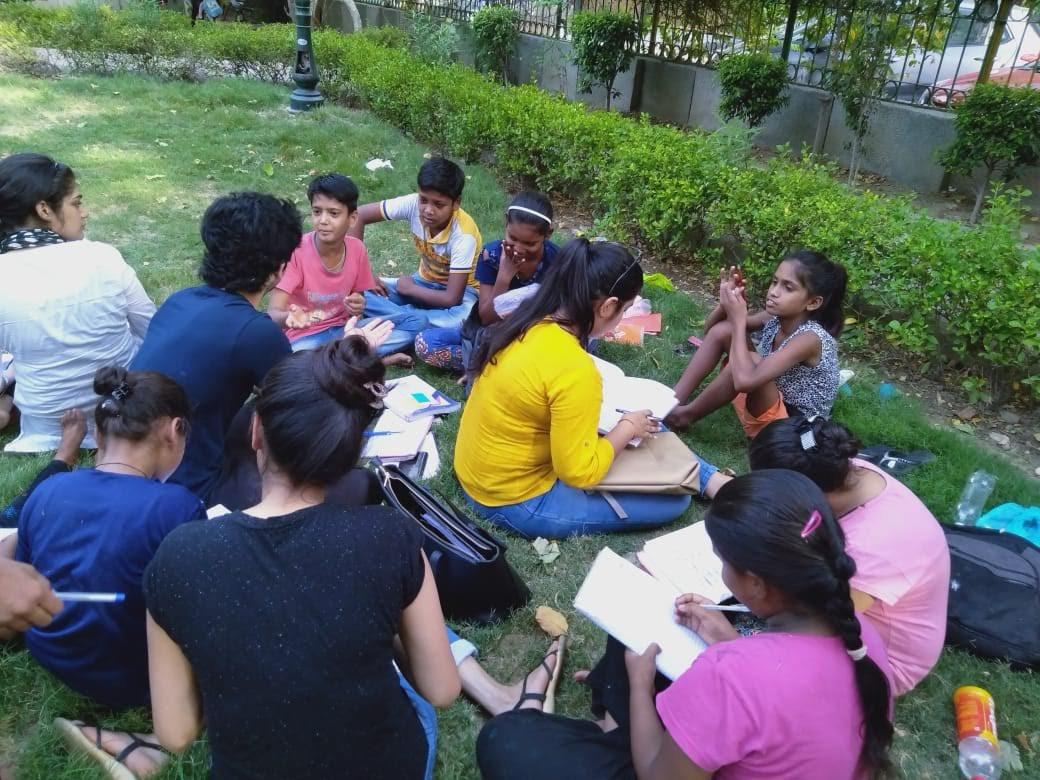
Global and Local Lens

From AI governance to grassroots movements — understand how global trends impact your everyday life.

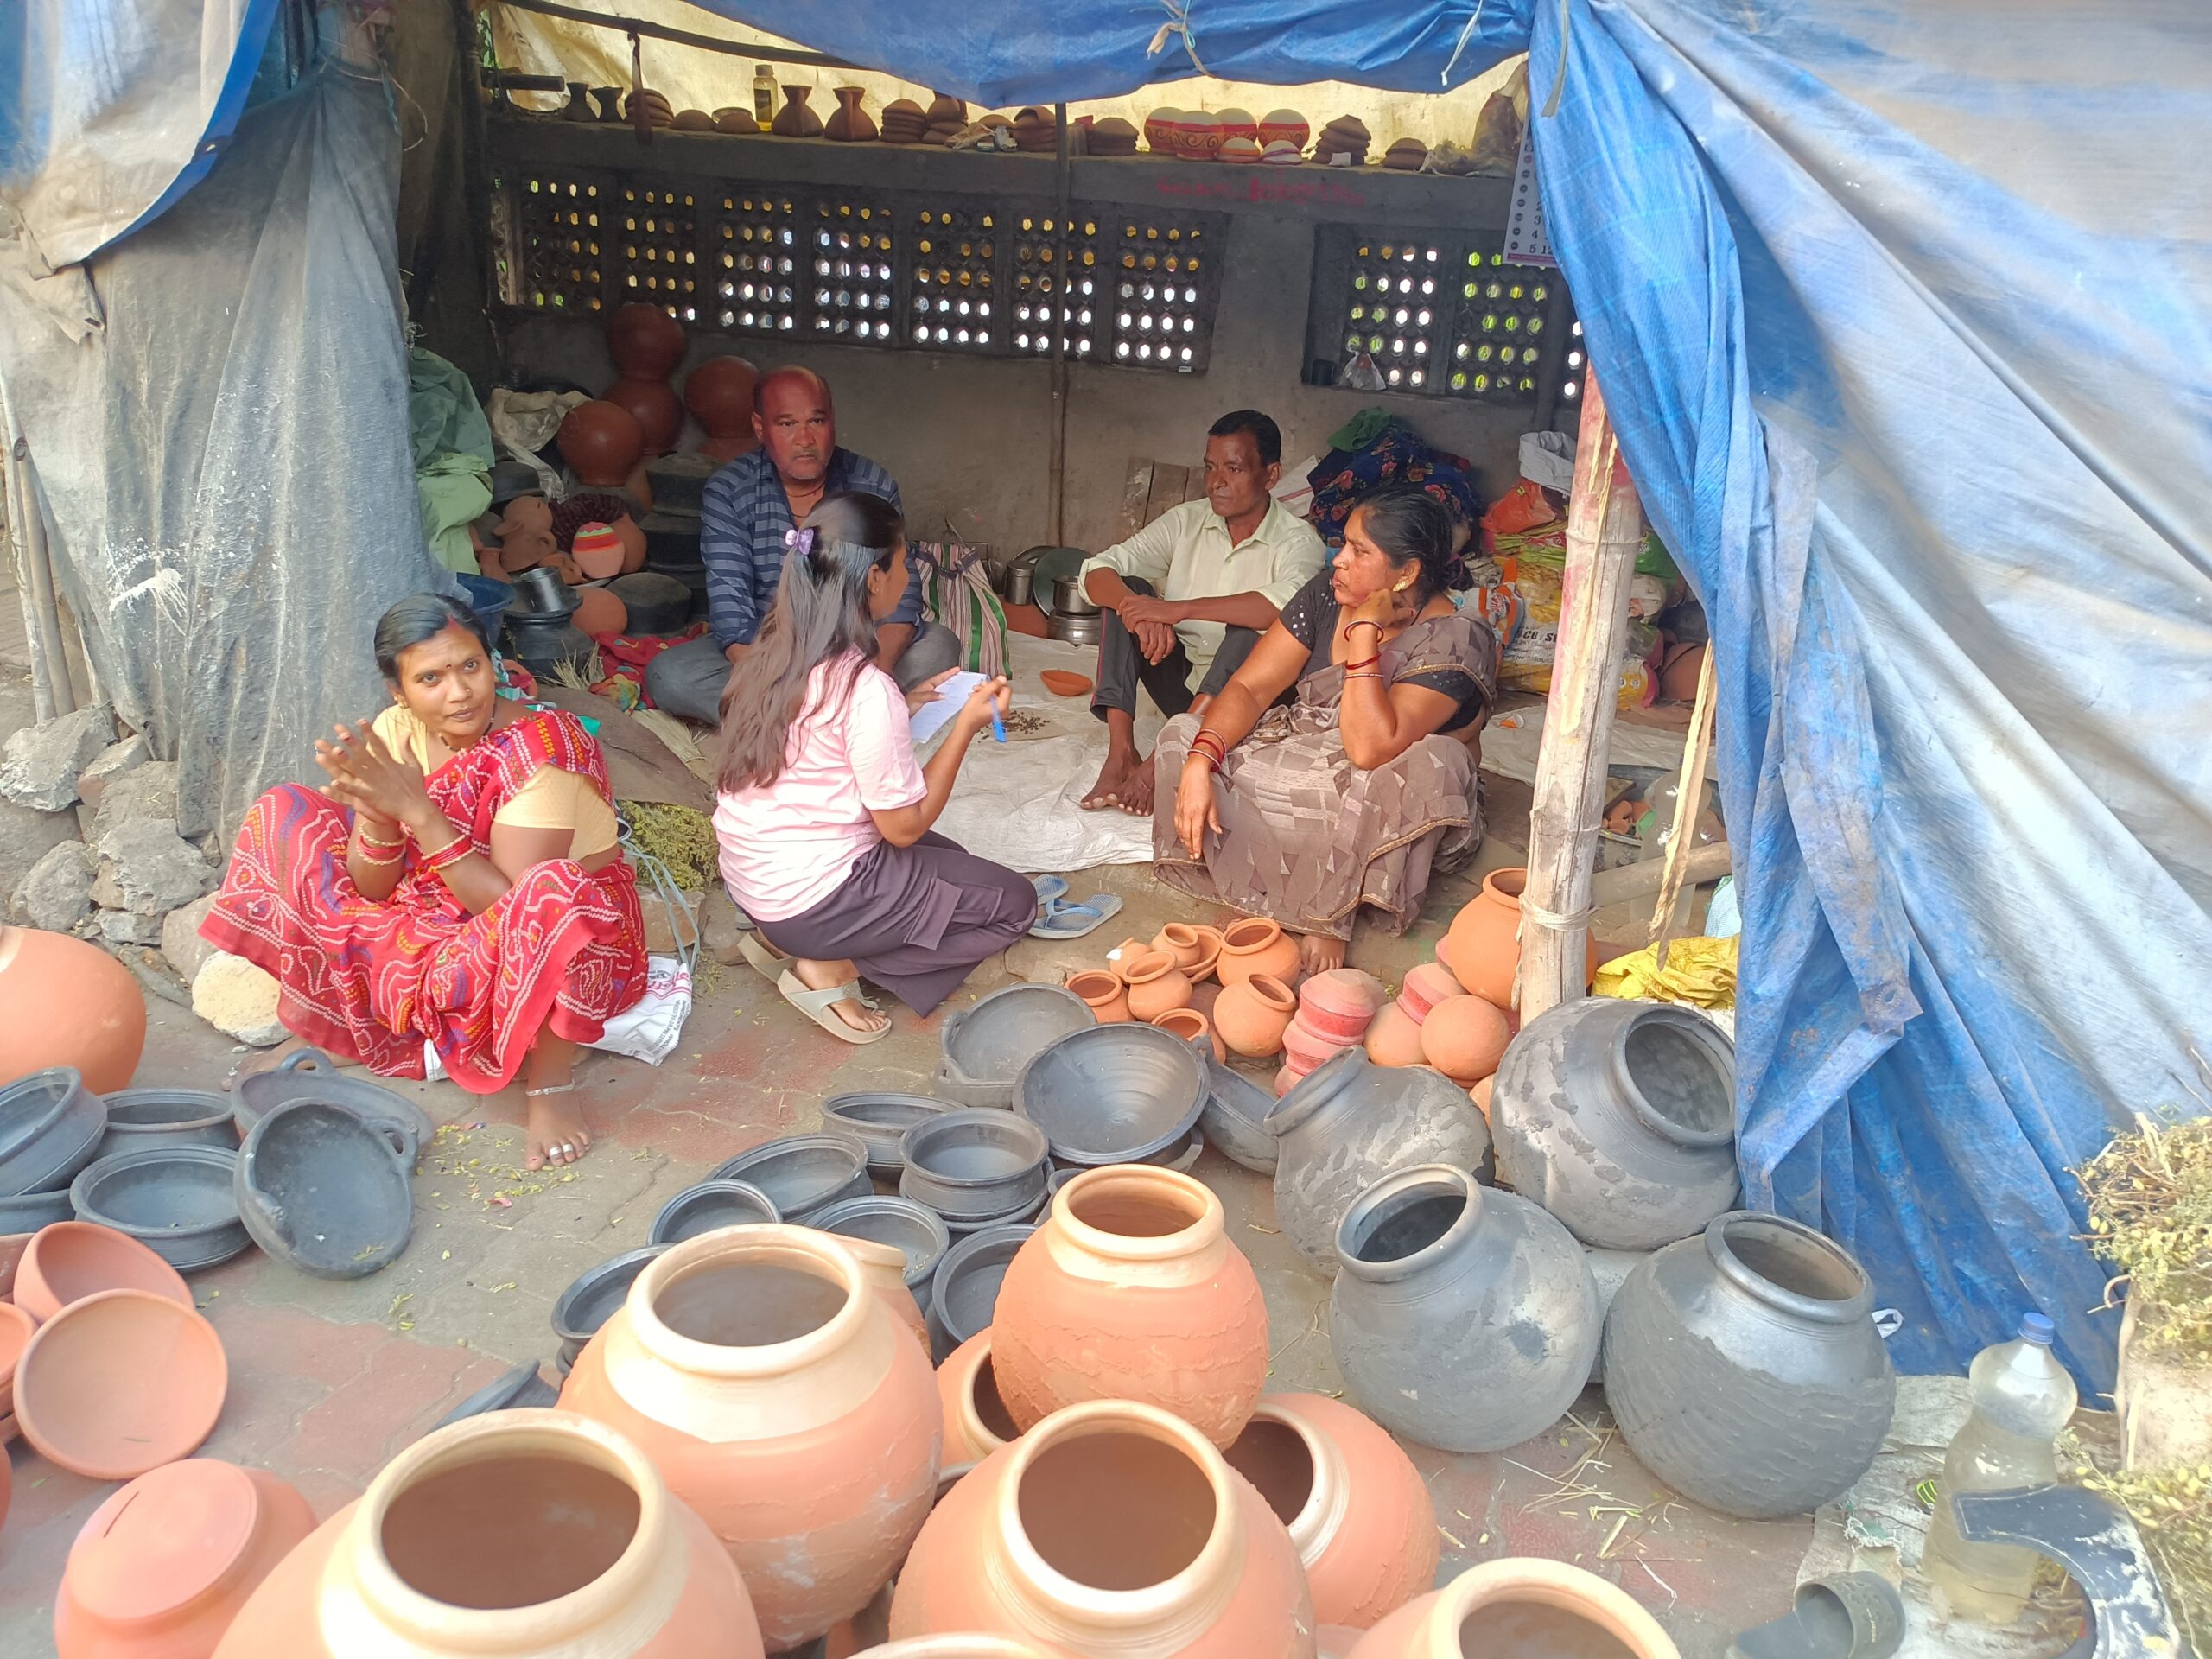
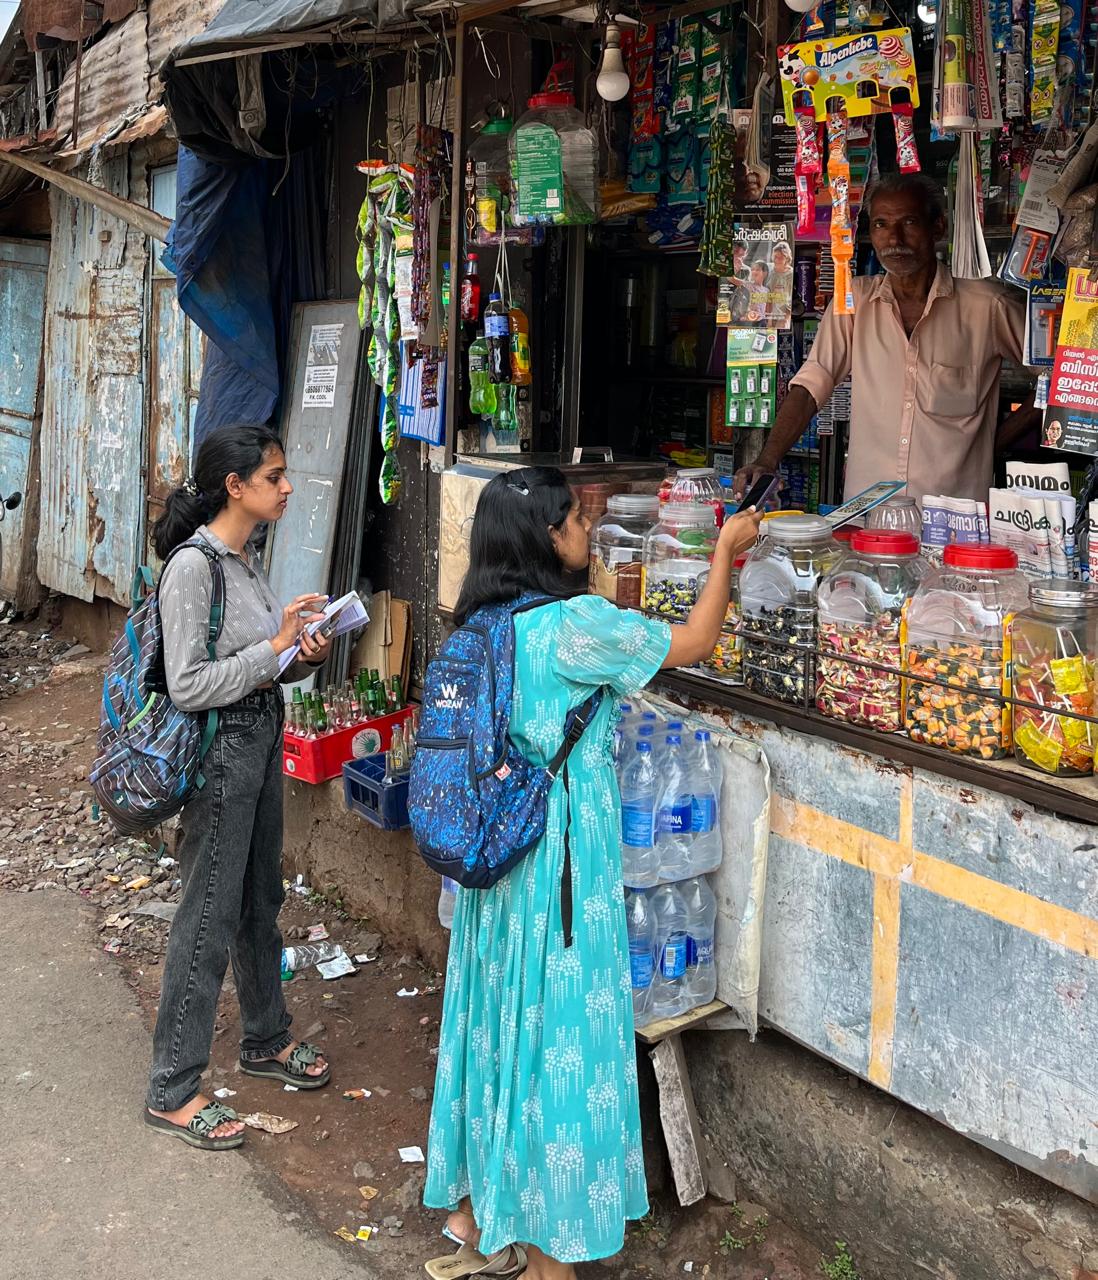
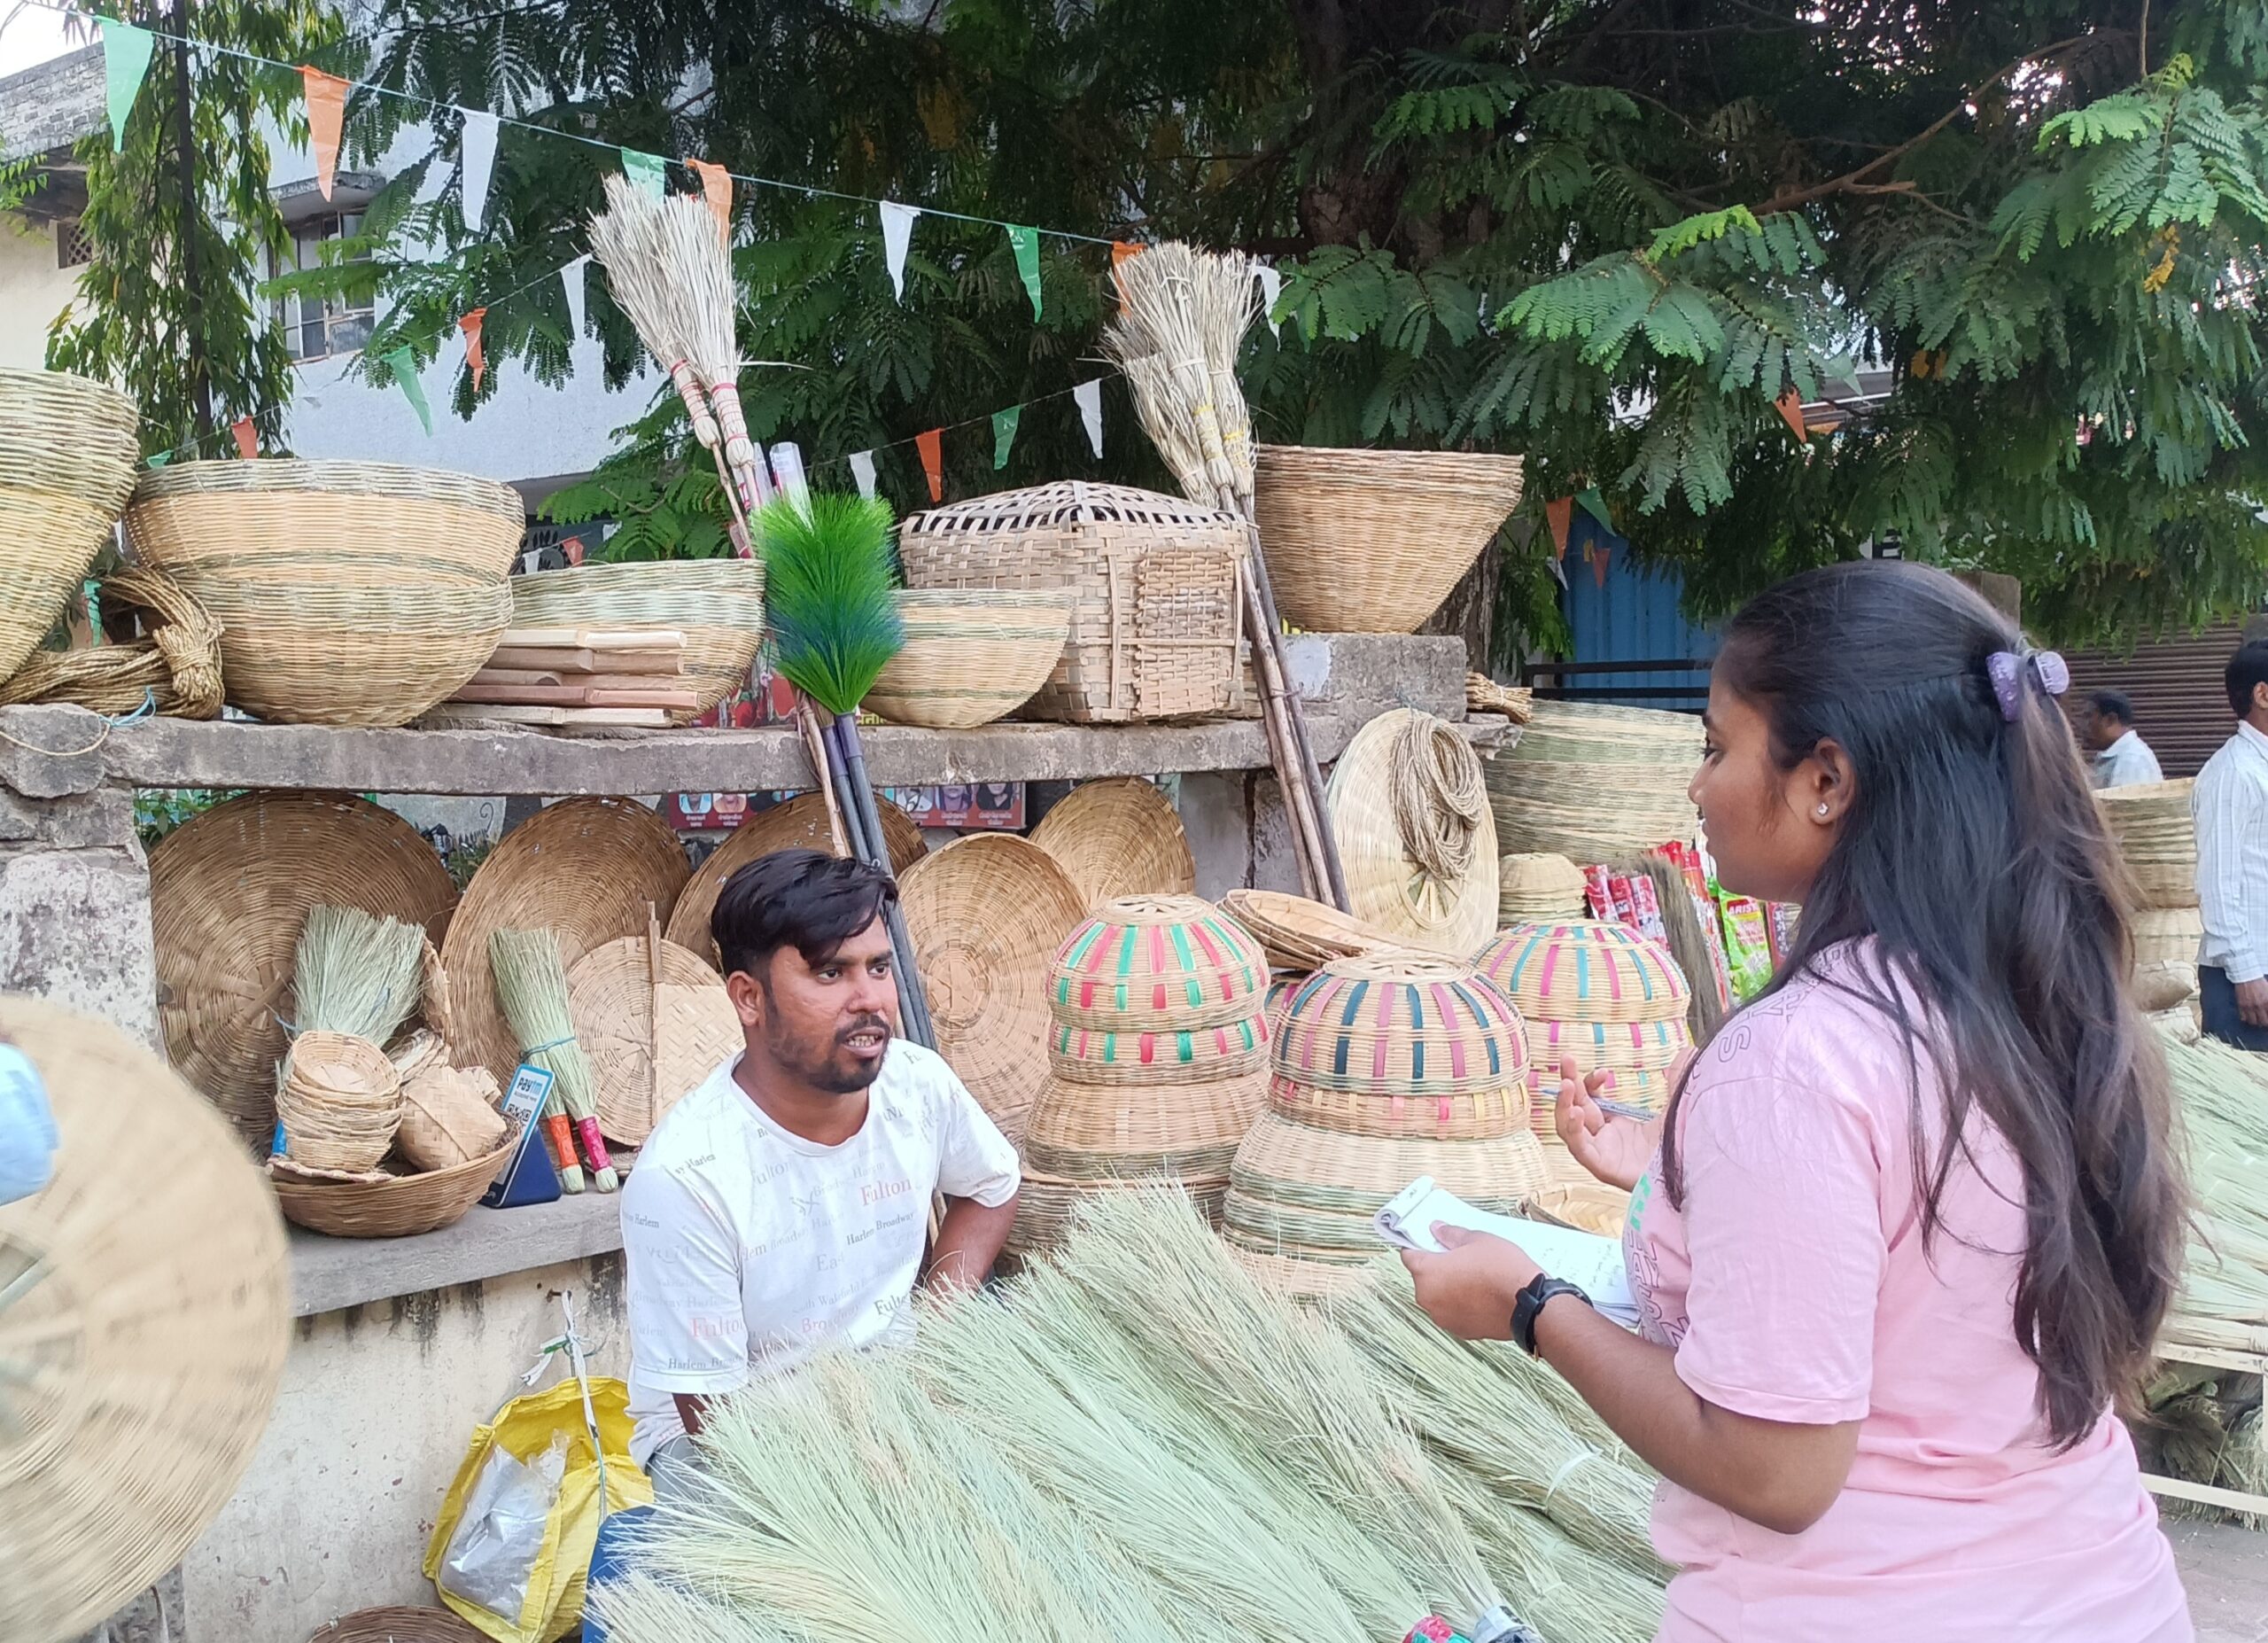
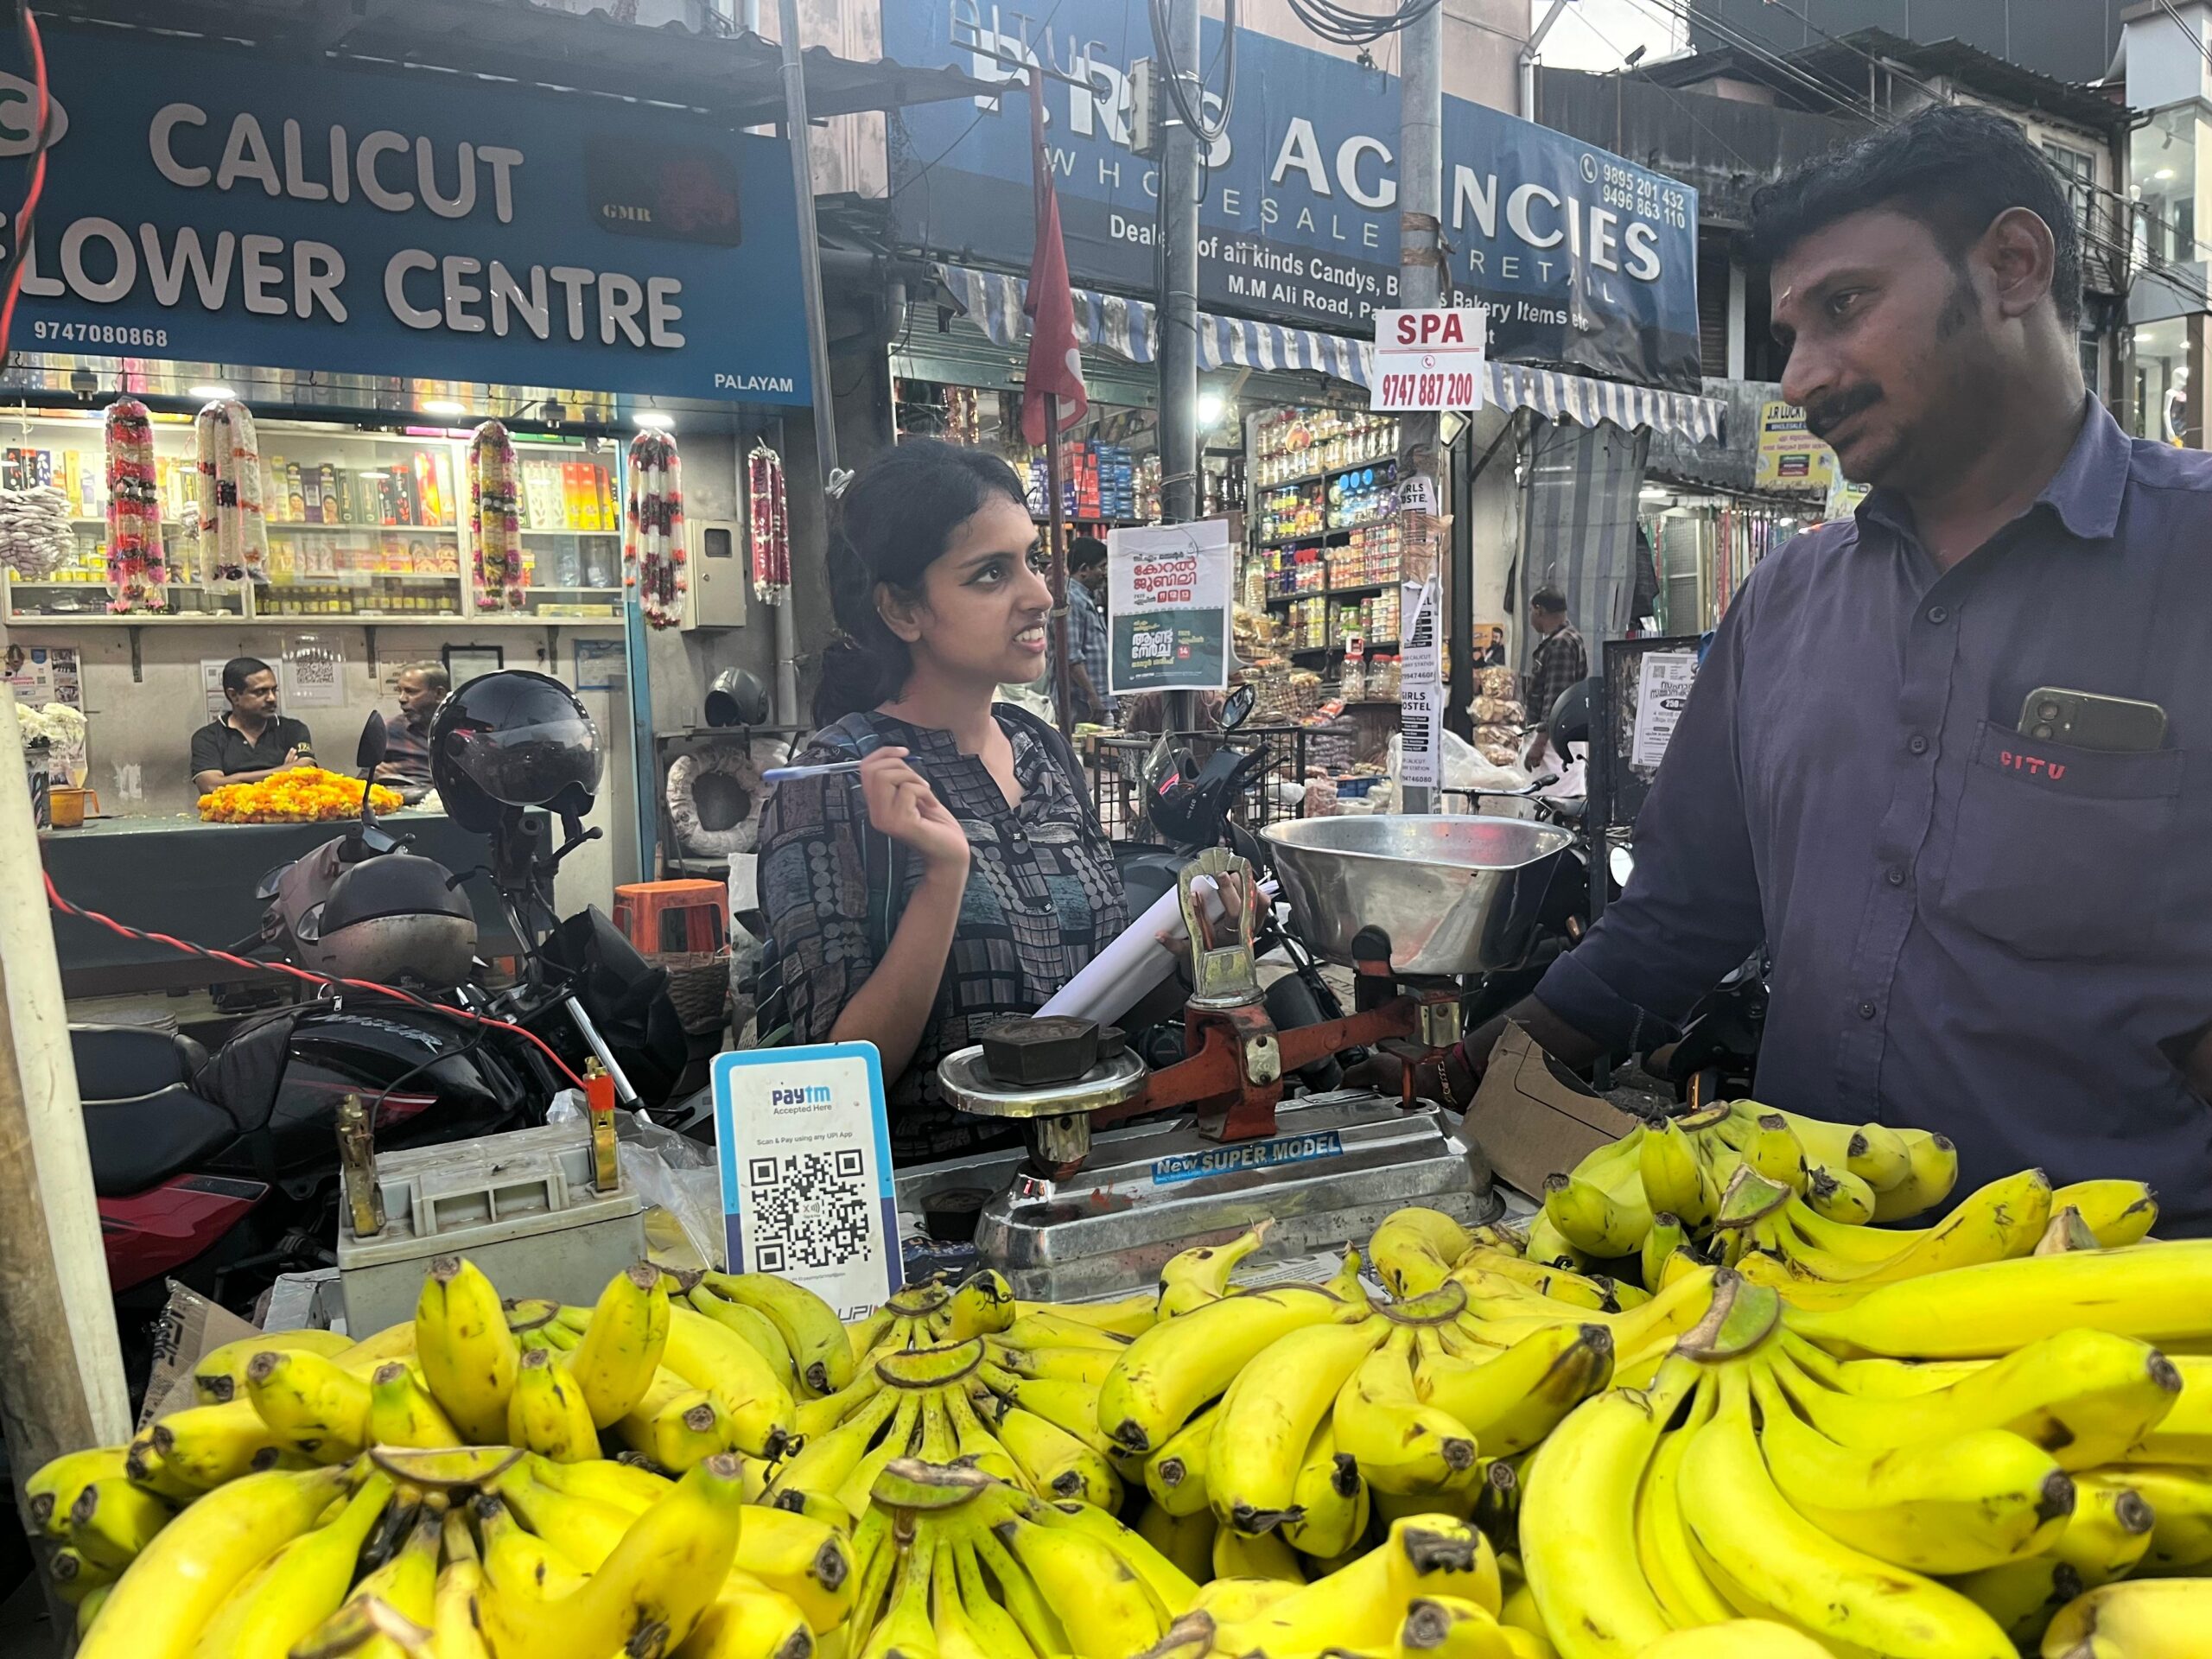
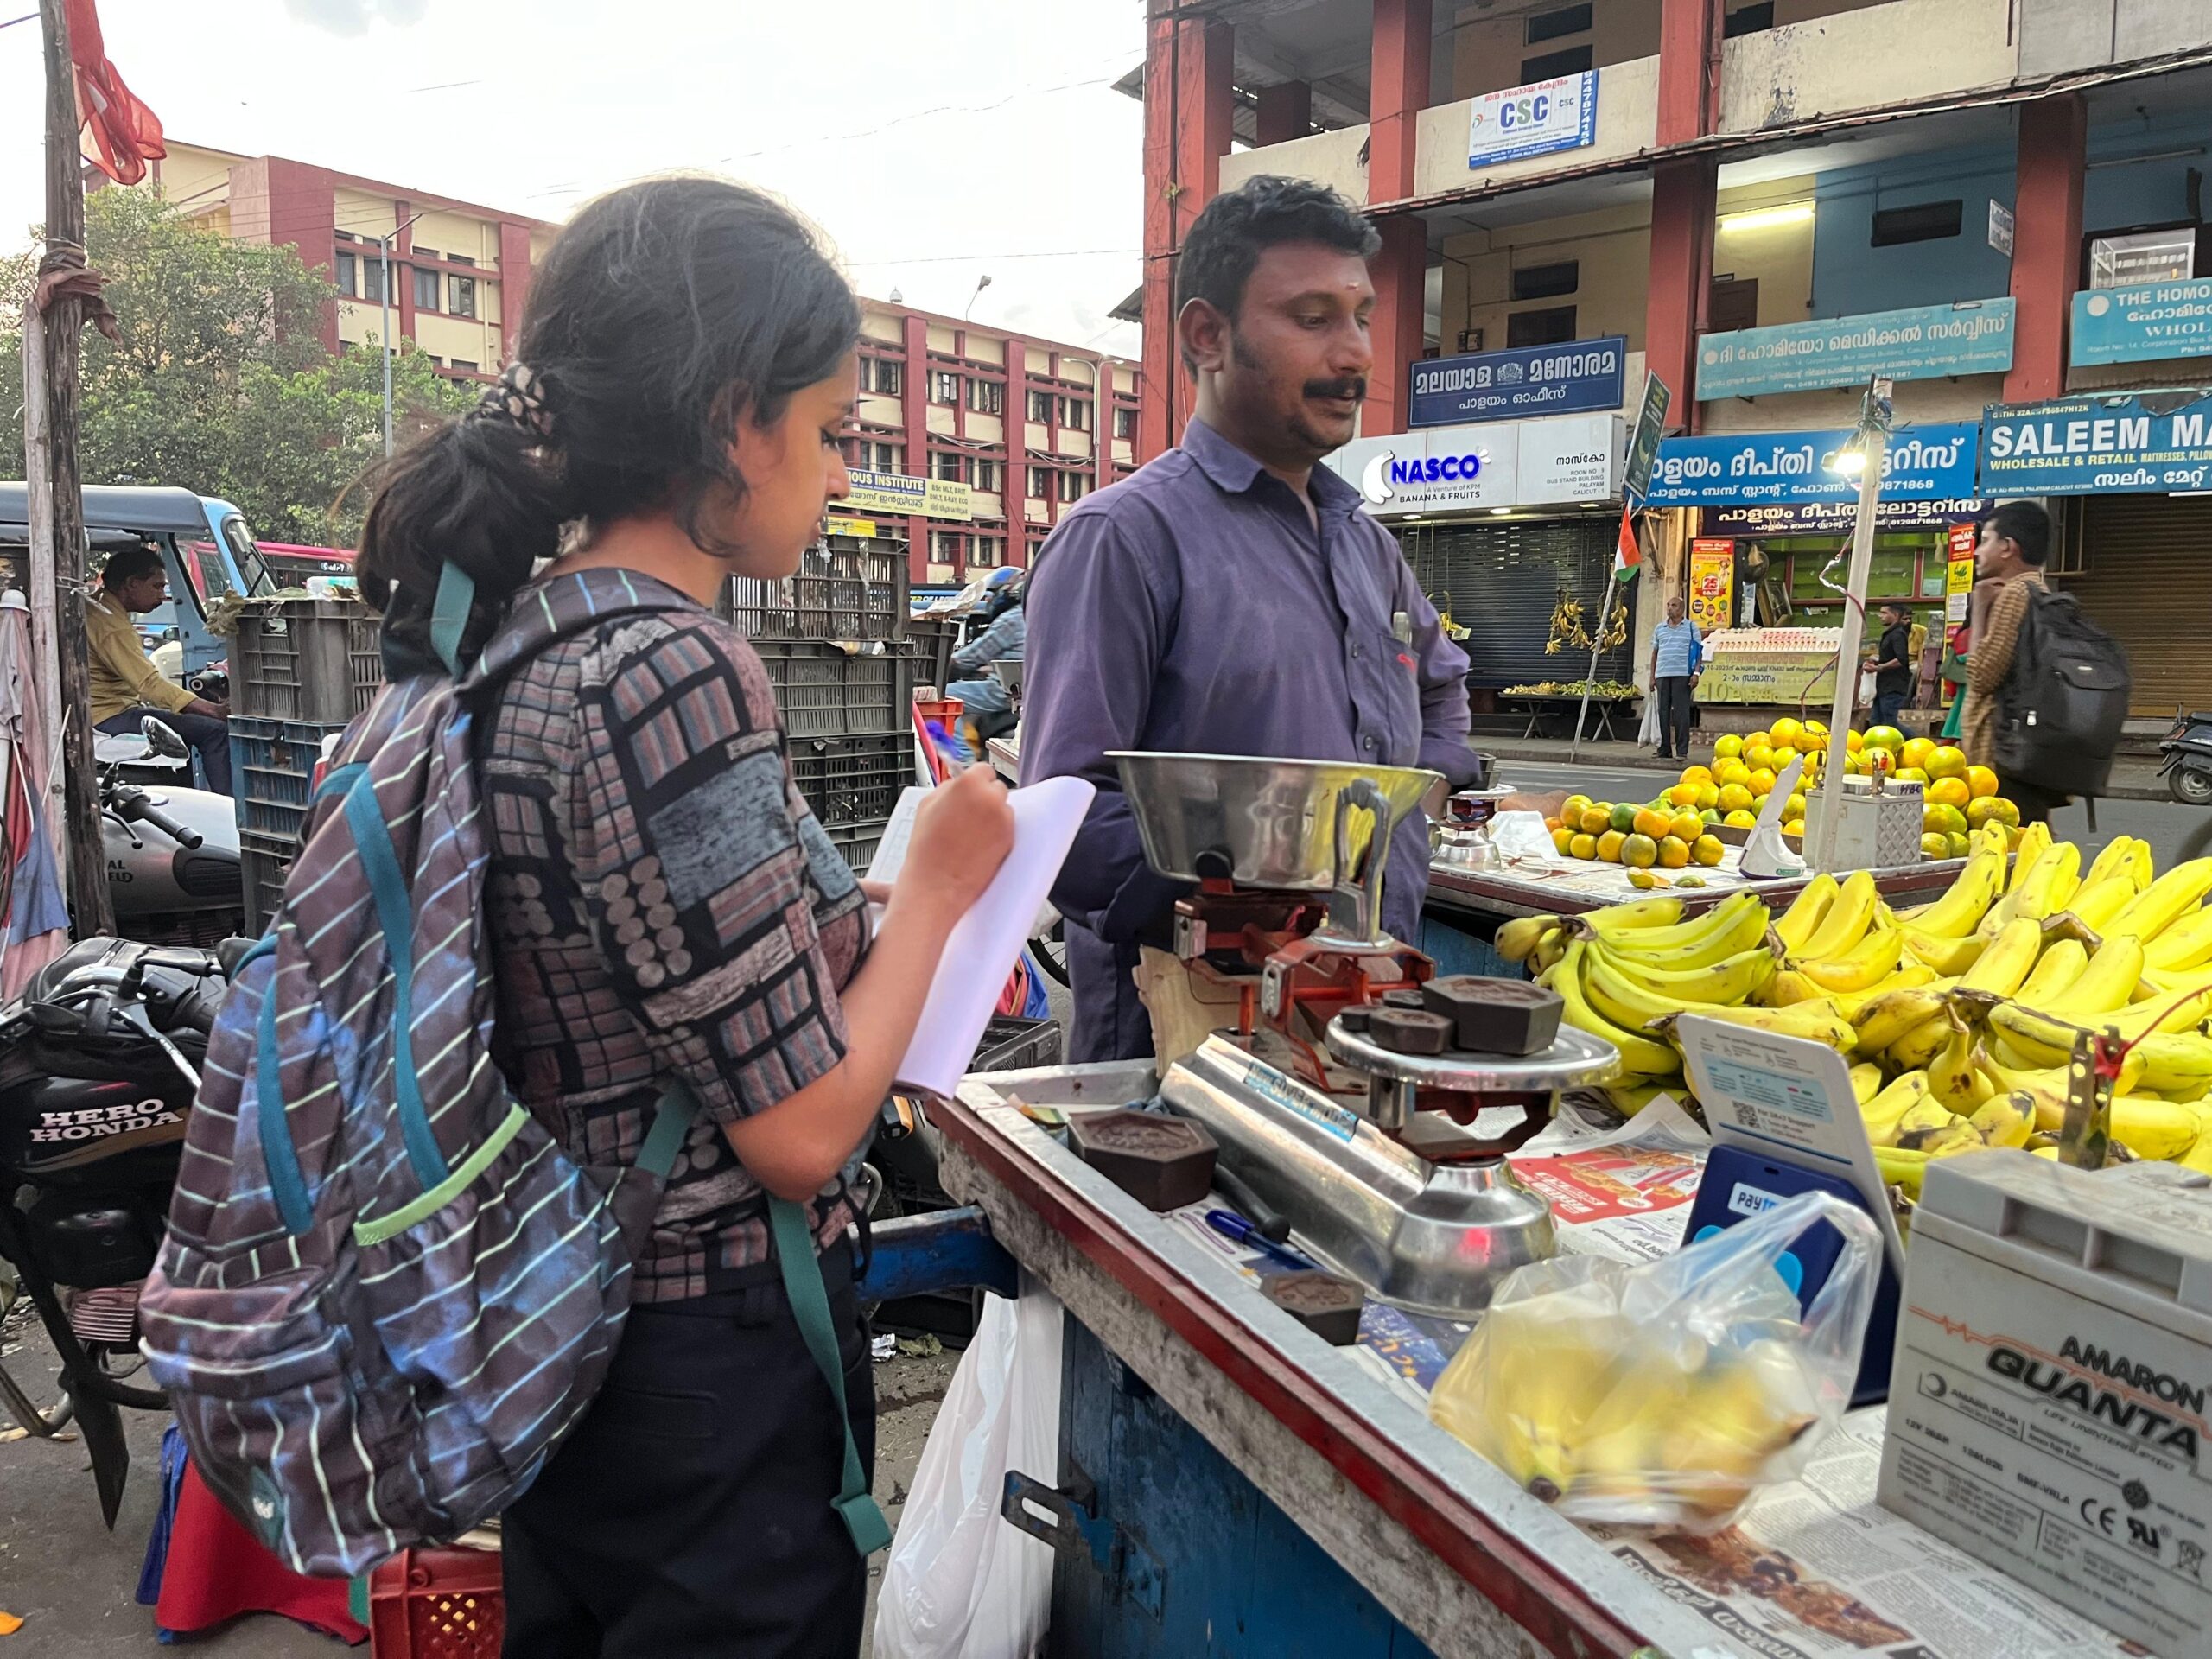
Practical Skills You Can Use

Master tools like data interpretation, ethnography, and policy brief writing to influence real change.

Learn to Communicate With Impact

From crafting persuasive briefs to writing academic research — develop skills that resonate with both policymakers and the public.

In a world flooded with technical policy jargon and one-size-fits-all theories, most public policy courses stay trapped in outdated models, ignoring the real forces of power, exclusion, and lived experiences.

Why Get Public Policy & Data science Certification From IISPPR ?

Who Should Enroll

Field Research Fellowship Program Overview

✓ Online Format: The program is fully online.

✓ Program Duration: Classes will be held from 1st of January to 28th of February 2025.

✓ Eligibility: The program is open to both undergraduate/postgraduate students and working professionals.

✓ Class Schedule: Classes will take place at 6 PM, four times a week. If a significant number of working professionals are enrolled, additional classes may be scheduled on Saturdays and Sundays, but the total number of classes each week will remain four.

✓ Homework and Reserve Days: After each class, there will be a designated reserve day to provide ample time for completing homework and assignments. This allows you to thoroughly review class materials and ensure all tasks are completed before the next session.

✓ Certification: A fellowship certificate will be awarded upon successful completion of the program

✓ Total Number of Seats: 20 for Pre Launch

About the Fieldwork

For the fieldwork, you won't need to travel far. You can conduct it right in your own neighborhood. We'll provide you with detailed instructions on how to carry out the fieldwork in your local area.

Syllabus

Level 3 - Public Policy Program

Lecture 1: Citizen Engagement, Participation, and Policy Advocacy

Topics: Participatory governance; lobbying; protest; policy literacy; social movements’ influence on policymaking.

Lecture 2: Data for Policymakers: Sources, Gaps, and Bias in Decision-Making

Topics: Surveys, administrative records, big data; accessibility issues; bias; data politics.

Lecture 3: Data Visualisation and Interpretation for Policy Impact

Topics: Data interpretation; visualization techniques; communicating data for policy impact; avoiding misuse.

Lecture 4: Introduction to Ethnography for Public Policy: Capturing Lived Realities

Topics: Ethnography’s role in policy research; understanding community realities; informal governance; qualitative insights.

Lecture 5: Ethnography in Action: Applying Ground-Level Insights to Policy Cycles

Topics: Integrating ethnographic evidence into policy design; monitoring; evaluation; ethical research practices.

Lecture 6 Writing Effective Policy Briefs: Clarity, Evidence, and Influence

Topics: Policy brief structure; crafting concise, actionable recommendations; communicating with policymakers.

Lecture 7: Academic Writing for Public Policy: Structuring Research Papers

Topics: Research paper components—abstract, introduction, literature review, methods, findings, conclusion; scholarly rigor.

Lecture 8: Advanced Research Paper Development: Publication-Ready Writing

Topics: Strengthening arguments; integrating theory and evidence; meeting academic publishing standards.

Lecture 9: Critical Evaluation of Public Policy: Reflection, Limitations, and Future Pathways

Topics: Interrogating policymaking limitations; structural exclusions; reflective learning; empowering engaged, critical citizens.

Level 4 - Data Science for Policy and Governance.

Module 1-6 Will focus on Public Health Data and Module 7-9 will focus on NSSO Data Analysis with PYTHON

Module 1
 

1. A Brief Introduction of SPSS

1.1. What is SPSS

1.2. Who uses it

1.3. How is it used

2. SPSS – A Tool of Statistical Study

2.1. Introduction

2.2. Getting Help

2.3. Data Entry

2.4. Questionnaire design

2.5. SPSS Menu Bar

2.6. Importing and Exporting Data

3. Statistics – The Main Function of SPSS

• 3.1. Types of Statistics

• 3.2. Types of Data

• 3.3. Basic Properties of Data

3.4. Level of Measurement and Statistical Methods

3.5. Statistical Research Process

Module 2

1. Descriptive Statistics in SPSS

1.1. Frequencies

1.2. Descriptive

1.3. Crosstabs

2. Statistical Estimation and Sampling Process

2.1. Types of Hypothesis Testing

2.2. Null and Alternate Hypothesis

2.3. Types of Error

• 2.4 Confidence Interval and Confidence Level

3. T – Tests

3.1. Assumptions of T Tests

• 3.2. Conducting T Tests

3.3. Understanding Output

· 3.4. Interpretation of different parts of Output

• 3.5. Practical example on T – Tests


Module 3

1. Chi square Test (Non parametric)

• 1.1. Types of Chi Square Test

1.2. Chi square – Goodness of Fit test

1.3. Assumptions of Chi square -Goodness of Fit Test

1.4. Conducting Chi square -Goodness of Fit Test

1.5. Understanding Output

•1.6. Chi square – Test of Independence

∙1.7. Assumptions of Chi square -Test of Independence

1.8. Conducting Chi square – Test of Independence

1.9. Understanding Output

1.10. Practical example on Chi square Test

(Non parametric)


Module 4
 

1. Correlation

1.1. Pearson’s correlation

1.2. Spearman’s correlation

1.3. Assumptions of Correlation

1.4. Conducting Correlation

1.5. Understanding Output

2. Linear Regression

· 2.1. Understanding why and where Regression is used

• 2.2. Assumptions of Simple Linear Regression

• 2.3. Conducting Simple Linear Regression

2.4. Understanding Output

2.5. Practical examples on Linear Regression

2.6. Multiple regression analysis

Module 5

Module 5

1. Nonparametric Procedures

1.1. Mann-Whitney U Test

1.2. Kruskal-Wallis Test

1.3. Wilcoxon Test

 
Module 6

1. Principal Component Analysis

1.1. What is Principal Component Analysis

1.2. Conducting Principal Component Analysis

1.3. Understanding Output

1.4. Data analysis with real examples in SPSS

Module 7
 

Extracting Data from NSSO & Introduction to PYTHON

Topics Covered

Overview of NSSO datasets (types of data, sources, accessing data).

Extracting data from NSSO (tools and methods for downloading).

Introduction to PYTHON interface, basic commands, and data types.

Importing and managing NSSO data in PYTHON.

Hands On

Downloading and extracting data from NSSO.

Importing NSSO datasets into PYTHON.

Data management in PYTHON: renaming, labeling variables, sorting, filtering.


Module 8
 

Descriptive Analysis & Graphical

Representation Using PYTHON

Topics Covered

Descriptive statistics (mean, median, standard deviation, frequency distribution).

Graphical representation in PYTHON(histograms, bar charts, scatter plots, pie charts).

Customizing graphs and exporting them for reports.

Hands On

Using PYHTON commands for descriptive statistics (summarize, tabulate, describe).

Creating and customizing graphs (histogram, twoway, bar, scatter).

Exporting graphs for reports.

Homework

Perform descriptive analysis and graphical representation for a provided dataset using PYTHON

Module 9

Normality Testing & Parametric vs Non-Parametric Tests in  PYTHON

Topics Covered

Introduction to normality testing (Shapiro-Wilk test, Q-Q plots, skewness, kurtosis).

Overview of parametric tests (t-test, ANOVA).

Overview of non-parametric tests (Mann-Whitney U test, Kruskal-Wallis test).

Hands On

Normality testing in PYTHON (swilk, qnorm, skewness, kurtosis).

Conducting parametric tests (t-test, ANOVA using ttest, anova).

Performing non-parametric tests (ranksum, kwallis).

PYTHON

Test a dataset for normality and conduct both parametric and non-parametric tests on

different variables.


Required Readings

⭐ Creswell, J. W. (2013). Qualitative Inquiry and Research Design: Choosing Among Five Approaches. Sage.

⭐ Charmaz, K. (2014). Constructing Grounded Theory. Sage.

⭐ Yin, R. K. (2018). Case Study Research and Applications: Design and Methods. Sage.

⭐ Gee, J. P. (2014). An Introduction to Discourse Analysis: Theory and Method. Routledge.

⭐ Riessman, C. K. (2008). Narrative Methods for the Human Sciences. Sage.

Note - Classes will be conducted online, and recordings will be available for 15 days. After completing the program, students will receive a fellowship certificate. Additionally, those who choose to contribute to a book chapter will be awarded a publication certificate, which will include a DOI.

Fee Structure

Our courses are designed to provide immense value at an incredibly affordable fee. While the actual cost of the course is RS 15000, we are currently offering an prelaunch offer at Rs 2999 or 55 dollars for International Students. We understand that financial situations vary, and if you are facing any financial difficulties, we invite you to pay what you can.

These courses are conducted on a non-profit basis, with the goal of making education accessible to everyone. However, there are significant expenses associated with running these programs that we strive to cover through these fees. Your contribution helps us continue providing quality education and support to all our students.

Testimonial

Photo Gallery